REPORT 2020 Force Measurements on Artificial Turf Materials - Kunstgress 2021 - Gode idrettsanlegg
←
→
Page content transcription
If your browser does not render page correctly, please read the page content below

REPORT 2020
 Force Measurements
on Artificial Turf Materials

 Kunstgress 2021
 A project focusing on artificial turf


Summary

Force measurements of different artificial turf materials at different temperatures has
been investigated. The report is a contribution to Kunstgress 2021 (KG2021), which is
a 3-year project focusing on the development and testing of new concepts for the
artificial turf pitches of the future. The aim of the project is to identify and investigate
alternative artificial turf systems without inorganic filling.

Force measurements for the various artificial turf materials systems was measured by
conducting drop tests of different combinations of artificial turf, shockpad and infill at
different temperatures. The shock absorption was measured for ten different
combinations of artificial turf materials before and after exposure of cooling, at -11 °C
for 25 hours.

Shock absorption were not calculated in this experiment, due to risk of destroying the
load cell. Therefore, in the report the basis for comparison is force measurement.

Before cooling, it was observed low standard deviation and expected results. The
lowest measured force was found for artificial turf without shockpad or infill (REF-P)
with a force measuring 10.39 kN ± 0.51 kN. This is was expected due to the absence
of shockpad and infill. The largest force measured was for artificial turf with shockpad
S1 without infill (S1-P) with a force of 2.53 kN ± 0.10 kN.

After cooling, a higher standard deviation can be observed for all samples, especially
for the samples with infill. The increase in standard deviations is believed to occur from
uneven distribution of filling and large temperature change. It seems that with an
increasing amount of infill, there is lower shock absorption after the cooling. The
greatest measured force after cooling was still REF-P at a force of 6.26 kN ± 0.83 kN.
The largest measured force after cooling, on the other hand, was artificial turf with
Alveosport shockpad (A-P) with a force of 2.52 kN ± 0.15 kN. The samples with
shockpads S1 and S2 without infill were found to have the same maximum measured
force and the associated time registered, after cooling. When sand and olives were
added as infill the measured force increased and the time considerably. The infill
became hard and solid after cooling. Which indicates that the sample became harder
and decrease in the deformation was observed. The samples that contain Alveosport
 I

as a shockpad, received greater shock absorption after cooling. This is due to the
Alveosport shockpad having a greater water absorption than the other shockpads after
being immersed in water during sample preparation.

From FIFA field tests in Norway, the shock abosprtion measured was in general low,
and the tests were during summer and autumn. The FIFA standard specifies that an
artificial turf can be tested all year, as long as the temperature are within the range of
–5 °C to +50 °C. As found in this experiment, the shock absorption varies greatly
according to temperature and weather conditions. Which show that the FIFA
requirements are not a great reflection on real conditions.

A surface with low shock absorption, which corresponds to higher force
measurements, is not favourable for athletes or users of the field. Football, and other
sports that use the artificial turf are a contact sport that include running, jumping, and
falling. If this is combined with an artificial turf with low shock abosprtion, the risk of
injury may increase, and it is less preferable to fall on.

 II
Sammendrag

I dette arbeidet ble kraftmålinger av ulike kunstgressmaterialer ved ulike temperaturer
målt. Rapporten er en del av prosjektet Kunstgress 2021 (KG2021), som er et 3-årig
prosjekt med fokus på utvikling og prøving av nye konsepter for fremtidens
kunstgressbaner. Målet med prosjektet er å identifisere og undersøke alternativer
kunstgress-systemer uten uorganisk ifyll.

Støtdemping til de ulike kombinasjonene av kunstgressmaterialer ble målt
veddroptesting av ulike kombinasjoner av kunstgress, dempematte og ifyll ved ulike
temperaturer, 26°C og -11°C. Støtdempingen ble målt for ti ulike kombinasjoner av
kunstgressmaterialer før og etter eksponering av avkjøling, -11°C i 25 timer.

Støtdemping ble ikke beregnet i dette eksperimentet, på grunn av risiko for å ødelegge
lastcellen. Derfor ble det i rapporten gjennomført kraftmålinger som
sammenligningsgrunnlag mellom prøvene, hvor kraft og tid ble registret.

Testresultatene ved romtemperaturer kan det observeres med et lite standardavvik og
tilhørende forventede resultater. Minst målte kraft var for kunstgress uten dempematte
og ifyll (REF-P) med en kraftmåling på 10,39 kN ± 0,51 kN, som er et forventet resultat
siden den ikke inneholder dempematte eller ifyll. Størst målte kraft var for kunstgress
med dempematte S1 uten ifyll (S1-P) med en kraft på 2,53 kN ± 0,10 kN.

Testresultatene etter avkjøling kan det observeres med et større standardavvik for alle
prøver, hvor standardavviket er spesielt økende for prøvene med ifyll. Økningen i
standardavvik forekommer trolig som følge av ujevn fordeling av ifyll og
temperaturforandring. Ved økende mengde sand som ifyll, synker støtdempingen etter
avkjøling. Minst målte kraft etter kjøling, var REF-P ved en kraft på 6,26 kN ± 0,83 kN.
Den største målte kraften etter kjøling var kunstgress med Alveosport dempematte (A-
P) med en kraft på 2,52 kN ± 0,15 kN. Prøvene med dempemattene S1 og S2 uten
ifyll hadde samme maks målt kraft og tilhørende tid registret, etter avkjøling. Da sand
og oliven ble tilsatt som ifyll, økte den målte kraften og tiden betraktelig. Ifyllet ble etter
avkjøling, hardt og solid. Prøvene som med Alveosport som dempematte fikk en lavere
måltstøtdemping etter avkjøling. Dette kan komme av at Alveosport dempematten har
en større vannabsorpsjon enn de andre dempemattene da de ble nedsenket i vann
ved prøvepreparering.
 III
Fra FIFA felt tester i Norge var støtdempingen generelt sett lav, og testene var
gjennomført om sommeren og høsten. FIFA-standarden spesifiserer at kunstgress
skal kunne testes året rundt, så lenge temperaturen er i området -5 °C til +50 °C. Som
funnene i dette forsøket viser varierer støtdempingen stort etter temperatur. Noe som
viser at FIFA-kravene ikke reflekterer virkelig forholdene.

En kunstgressbane med lav støtdemping, som tilsvarer høy kraftmåling, er ikke
gunstig for brukerne av banen. Fotball og flere idretter som benytter seg av
kunstgressbaner er kontaktsport som inkluderer løping, hopping og en del fall. Dersom
dette kombineres med kunstgressbane med lav støtdemping kan faren for skader øke
og det er mindre gunstig å falle på.

 IV
Table of contents

Summary .................................................................................................................... I

Sammendrag ........................................................................................................... III

1. Introduction ........................................................................................................ 1

2. Background ........................................................................................................ 2

 2.1. Artificial turf structure..................................................................................... 2

 2.2. Standards to validate the compliance of the football turf ............................... 4

3. Method ................................................................................................................ 5

 3.1. Materials........................................................................................................ 5

 3.2. Preparation and characteristics of the test samples ...................................... 7

 3.3. Preparation and verification of the drop test .................................................. 9

 3.4. Test procedure for drop test ........................................................................ 10

 3.4.1. Cools samples at -11 °C ....................................................................... 12

4. Results.............................................................................................................. 13

 4.1. Room temperature (26 °C) .......................................................................... 14

 4.2. Cold temperature (-11 °C) ........................................................................... 17

 4.3. Summary of results ..................................................................................... 20

5. Discussion ....................................................................................................... 21

 5.1. Results from the force measurements ........................................................ 21

 Summary of test results .................................................................................. 23

 5.2. Comparison of test methods ....................................................................... 23

 Parameters for the Instron Drop Tower ......................................................... 24

 The difference in measuring apparatus ......................................................... 24

 5.3. Results from similar experiments ................................................................ 25

 5.4. What impact does this have on the users of the turf ................................... 26

 5.5. Future work ................................................................................................. 27
6. Conclusion ....................................................................................................... 28

Appendix ................................................................................................................. 31

 Attachment A: Calculation process for adding infill. .............................................. i

 Attachment B: Calculation of standard deviation for the force measurements. .....ii
1. Introduction

The report is a part of the Kunstgress 2021 (KG2021) project. It is a 3-year project
focusing on the development and testing of new concepts for future artificial turfs. The
objective of the project is to identify and investigate alternative turf systems without
artificial infill. In this report the shock absorbing properties will be investigated and put
into context with the various combinations of artificial turf components and the impact
at different temperatures. Tests are performed at various temperatures to detect
variations in properties under simulated weather and seasonal conditions.

To measure the shock absorption of the various combinations a drop test will be
completed. This test will be conducted equal to the “FIFA Test Method 04a –
Determination of Shock Absorption”. The test is mainly based on a mass that falls
vertically from a given height, with a specific weight and velocity and the force
reduction is measured. Since the drop test and Advanced Artificial Athlete (AAA), used
in the FIFA test and Nordic Standard, is not identical, the results of the tests are only
comparable between themselves and not against other results.

By testing the shock absorbing properties at lower temperatures, the simulation of cold
winter season influences the characteristics and the materials shock absorption
properties compared to the properties of the material. The test and results are most
relevant for the Nordic countries that experience cold temperature in the winter, for
example in Oslo in January the temperature varies in average from 8 °C to - 7 °C, but
in Madrid in same moth varies from 10 °C to 3 °C [1], [2].

If there is great variation in shock absorption properties between summer and winter,
this will affect the user experience and player conditions in the winter. Therefore, it is
important to map shock absorption in winter also to set it up against the FIFA
requirement for shock absorption, which applies in summertime. Usually the tests that
have been carried out in Norway have in general low shock absorption, even though
they are tested during the summer [3]. If the shock absorption varies greatly according
to temperatures, the shock absorption will no longer be approved during the winter,
which shows that the FIFA requirements do not reflect real conditions.

 2
2. Background

The following chapter sets the theoretical framework for the report. The chapter
explains first the artificial turf structure and the components purpose and materials.
Afterwards, the standards for validation of compliance of the football turf and is
discussed in more detail.

 2.1. Artificial turf structure

Artificial turf as a total system can be divided into four (five) components: artificial turf
(fibres and backing), elastic-layer/shockpad, stabilizing infill and in some cases
performance infill. The components have different properties and characteristics and
advantages adapted to their application. Figure 1 show the cross section of the
artificial turf’s components structure.

Figure 1: An example of artificial turf structure with artificial turf (fibres and backing), stabilizing infill
(sand) and in some cases performance infill and shockpad (PAD) [4].

Artificial turfs are made of polymer materials and is designed to look and behave as
similar to natural grass as possible. The artificial turf is made up of fibre that is tufted
into the backing. The material in the backing is often polypropylene (PP) and the fibres
by linear low-density polyethylene (LLD-PE) [5]. The length, density and
characteristics of the fibres and backing is unique for each manufacturer and style of
turf.

The Shockpad (PAD), is an elastic layer placed underneath the artificial turf to provide
shock absorption and playing conditions for example sufficient ball bouncing. The PAD

 3
must be designed to allow drainage and must withstand temperature changes over
extended period without loss of mechanical properties such as decreased ductility and
increased hardness. The thickness varies from 10 – 35 mm, as seen in Table 1 [6].
The Shockpad used in this report is called S1, S2 and Alveo. The S1 is made of
recycled styrene butadiene rubber (SBR) material with a thickness of 25 mm. The S2
is made of recycled SBR and artificial turf fibres material with a thickness of 30 mm.
The Alveo Shockpad is a cross-linked closed cell polyolefin foam layer with thickness
of 12 mm [7].

 Table 1: Overview of the shockpad wit subsequent thickness and materials.

 Shockpad Thickness [mm] Material
 S1 25 Recycled SBR
 S2 30 Recycled SBR and fibres
 Alveosport 12 Polyolefin

The stabilizing infill is placed between performance infill and the backing. Main
purpose is to keep the backing and turf in place, as well as supporting the fibres to
remain upright. The most used stabilizing infill material is quartz sand.

The performance infill is placed on the top of stabilizing infill. The layer’s main purpose
is to maintain satisfying playing conditions in terms of both player and ball/surface
interaction. In this report olive granulate is being used as performance infill. Olive
granulate is fully organic and produced from grinded olive pits. They are light coloured
brown and without dust and impurities. The olive granulate also have preferable
practical properties for example: UV resistant, proven heat reduction, odourless and,
does not float and no irrigation needed [8].

 4
2.2. Standards to validate the compliance of the football turf

Due to various manufactures, installers, and producers the performance of an artificial
football turf is measured to validate the compliance with standards. By using a FIFA
Quality Concept or Nordic Standard (NS) the turf’s property are measured and
compared with the perceived playing conditions to ensure quality. The quality criteria
are commonly divided into three categories [9]:

 • Resistance of the surface to wear and tear (durability)
 • The football on the surface (ball-surface interaction)
 • The football players reactions to the surface (player-surface interaction).

One of the player-surface interaction criteria is called shock absorption. Shock
absorption is the ability to reduce the impact force of a body falling onto the surface
and indicates how much of the applied force is absorbed in the material [10]. Equation
(1) show how shock absorption is calculated.

 max (1)
 = [1 − ] × 100
 ref

Where SA, is shock absorption in %. Fmax is force measured on the surface in N. Fref
is reference force measured in N ( ∙ ∙ −2 ), tested on the test floor without
any sample. The apparatus used for measuring shock absorption is called Advanced
Artificial Athlete (AAA), which is electromagnet sprint-test foot system [11].

In practical terms, shock absorption means how hard the total system of
artificial turf system is. Shock absorption is measured with the following standards:
FIFA Quality (FIFA Test Method 04a) and Nordic Standard (NS-EN
15330-1:2013 “Synthetic turf and needle-punched surfaces primarily
designed for outdoor use.” in addition to NS-EN 14808:2006
“Surfaces for sports areas: Determination of shock absorption.”). The criteria vary from
55 – 70% for FIFA and Nordic Standard [10], [11].

 5
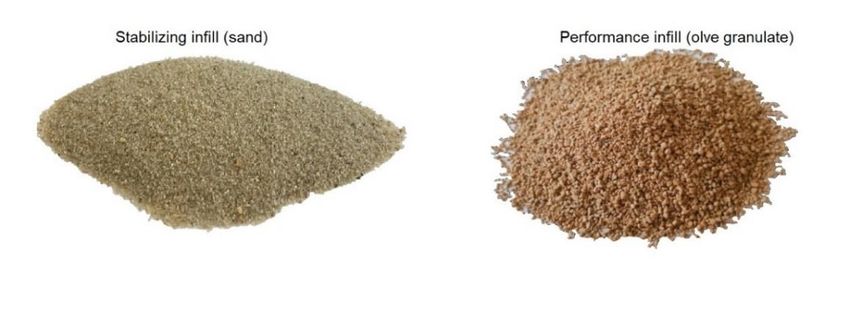
3. Method

The aim of the experimental work was to measure the shock abosprtion property on
artificial turf with different combinations of pad and infill. Force measurement were
done before and after exposing to temperature. The purpose of mapping shock
absorption on different combinations of artificial grass components is to map the
hardness of the surfaces and how much effect temperature has.

 3.1. Materials

The artificial turf, shockpads and infill materials tested was provided from Morton
ExtrusionTechnik. The artificial turf and the shockpads was delivered as pre-cut
samples and had the width and length of 300 mm. The infill materials came in bags
and had to be weighed before they were added into the test samples. An overview of
the components provided is seen in Table 2.

 Table 2: The table show the components and the type.

 Component Type

 Artificial turf PureField
 Ultra HD (30-17)
 Shockpad S1

 Shockpad S2

 Shockpad Alveosport

 Stabilizing Quartz sand
 infill
 Performance Olive granulate
 infill

Figure 2 – 4 illustrates the different artificial turf components used in the experiment.

 6
Figure 2: The artificial turf used in the experiment: PureField Ultra HD (30-17)

Figure 3: Sand and olive granules used for stabilizing- and performance infill in the experiment.

 Figure 4: Three different PADs used in the experiment: Shockpad S1, S2 and Alveo.
 Numbers in parentheses indicates the thickness.

 7
3.2. Preparation and characteristics of the test samples

The test samples contain different combinations of artificial turf, infill and/or PAD. A
total of twenty specimens were tested and specifications about each sample can be
found in Table 3.

A total of one of artificial turf, two infill materials and three shockpad are tested. The
artificial turf was tested both with and without PAD and infill. The same test specimen
combinations were first tested at 26 °C, because of the temperature at the test area,
and then at -11 °C. -11 °C were chosen because that is a potential temperature
reached during winter in the Nordic countries and therefore the intention is to measure
the extremal values to see if any changes could be seen.

When preparing the test specimens for testing, a certain procedure for adding infill
was followed. To know the exact amount of infill to be added into the turf, the area
density of turf and infill must be known. These parameters are present in the turf’s
certificates. The total area of the turf sample was measured by dividing the weight of
the turf by the turf’s area density. To calculate the right amount of infill to be added,
the area of the turf specimen was multiplied by the area density of either the sand or
olive granules. Equation (2) show how the exact area of the turf was calculated.

 turf (2)
 turf =

 turf

Where turf is the area of the artificial turf in 2 , turf is the weight of the artificial turf
in and turf is the area density of the artificial turf in ∙ −2 . Equation (3) show the
calculation process for adding infill for a specific test sample.

 infill = turf × (3)
 infill

 8
Where infill is the weight of the infill to be added in , turf is the area
of the artificial turf in m2 and infill is the area density of the infill to be
added in ∙ −2, specified by the product-system declaration by the
turf system producer. An example on how to calculate the area of the
turf, and the amount of sand and olive granules to be added is attached
in

Attachment . Table 3 shows the different the abbreviations with the containing
combinations with the type of shockpad and infill. The table also specify infill materials
type and area density. The abbreviation is based on the combination of components.
For example, S2-P-S: Shockpad S2 with PureField Ultra HD turf and Sand infill.

Table 3: Overview over the different combinations with specific infill area density. *-indicates not
following a product-system declaration, only based on assumptions. REF-P stands for: Reference
PureField turf, the remaining abbreviations stands for the combinations.

 Abbreviation Artificial turf PAD Stabilizing infill Performance fill
 Type Area Type Area
 density density
 [kg∙m-2] [kg∙m-2]
 REF-P PureField Ultra
 HD
 S1-P PureField Ultra S1
 HD
 S2-P PureField Ultra S2
 HD
 A-P Purefield Ultra Alveo
 HD
 S1-P-S* PureField Ultra S1 Sand 17.5*
 HD
 S2-P-S PureField Ultra S2 Sand 13
 HD

 9
A-P-S PureField Ultra Alveo Sand 17.5
 HD
 S1-P-S-O PureField Ultra S1 Sand 11 Olive 2
 HD stones
 S2-P-S-O* PureField Ultra S2 Sand 11* Olive 2*
 HD stones
 A-P-S-O PureField Ultra Alveo Sand 11 Olive 2
 HD stones

 3.3. Preparation and verification of the drop test

Instron Drop tower Impact System (CEAST 9350) was used for droptest of test
samples. When preparing each test sample,

were followed and the infills added accordingly. When adding infill, a Jordan scrubbing
brush (hard surface) were used to distribute the infill evenly into the surface and
between the fibres in the turf.

Before start of the drop test it was essential to the verify falling mass velocity, lifting
height and the total mass. First, the machine was set up vertically, with an angle of
90°, over the test sample. The mass and hemisphere was then lowered, to set the
reference height of approximately 0.00 mm at the top of the turf, as seen in Figure 5.
Then the lifting height was adjusted to the desired height at 55.00 mm, and when the
height was reached, the door to the drop tower was opened and the height was
measured manually with a measuring tape to make sure that the lifting height was
correct.

Furthermore, the total weight of the mass was adjusted, and lots were added to
achieve a total weight of 20.000 g ±100 g. The test foot, called hemisphere, has a
mass of 816 g and a diameter of 100 mm, and is also included in the total weight.
When the total mass and lifting height was adjusted according to the standards, the
impact velocity was then verified.

Verification of the velocity consisted of testing the given mass and lifting height on
similar samples, to check the impact velocity achieved. According to the standards,
the impact velocity should have been in the range of 1.02 ∙ −1 and 1.04 ∙ −1 , the

 2
velocity reached in the testing was 1.02 ∙ −1 . When all the parameters were
adjusted and verified, the setup was then ready, and the drop test could therefore start.

Figure 5: The figure show a cross section of how the lift height is being adjusted. The mass is the black
hemisphere, which has a height of 45 mm and a diameter (Ø) of 100mm and is above the artificial turf
in the figure. The figure shows the sample S1-P-S, artificial turf PureField Ultra HD with a height of
30mm with shockpad S1 with a thickness of 25 mm with stabilizing sand infill.

 3.4. Test procedure for drop test

As earlier mentioned, all the drop tests are performed as similar as possible to the
“FIFA Test Method 04a - Determination of Shock Absorption.”. Before start of the drop
test accommodate the requirements from preparation and verification of the drop test.
When adding a new sample, for example new artificial turf, PAD or infill, the lifting
height must be adjusted accordingly. After setting the lifting height, the foot was
lowered to reference height, 0.00 mm, to check if it is the correct height. First impact
starts by moving the sample so the mass will hit the lower left corner, approximately

 3
50 mm from each edge, shown in Figure 6. When the desired hit position is located,
the mass is then released and the force in kN, time in ms, velocity in ∙ −1 , and
energy in J (kg ∙ 2 ∙ −2 ) is recorded. The next impact follows the same procedure.
The second impact at lower right corner, third impact at upper left corner, fourth impact
at upper right corner and fifth impact at the middle of the test sample, as seen in Figure
6.

Figure 6: The figure shows the different impact positions in numerical order on the test specimen. The
figure shows the surface of artificial turf with stabilizing sand infill. As seen in the figure, both the width
and the length of the sample is 300 mm. The length between corner impact is 200 mm, which means
the impact is 50 mm from each edge and corner.

 4
3.4.1. Cools samples at -11 °C

To simulate winter season for a football turf, the test samples were also cooled to -11
°C and tested. To achieve this, the test samples were submerged in water at minimum
10 mm above the top of the artificial turf. After a minimum of one hour, the sample was
removed, placed on a free draining base, and allowed to drain by gravity for maximum
30 minutes. The test samples were then placed in a conditioning cabinet at
temperature of -11 °C of a minimum of 24 hours. Once the sample were removed after
25 hours, the samples were placed on a pre-cooled material surface in the Instron
drop tower, making sure that the samples maintained their temperature for as long as
possible and then they were drop tested. In between the five impacts, the temperature
was measured at the top of the surface with a probe to ensure it stayed above -2 °C.

Figure 7: The figure show where the ten samples were placed inside of the conditioning cabinet. A
cardboard is placed underneath the samples to avoid freezing into the metal shelves.

 5
4. Results

The results from the experimental work carried out in this report include force
measurements of a total of twenty samples. Ten samples were tested at room
temperature and ten samples after a given period in the conditioning cabinet. A limited
number of the samples associated graphs will be shown further in the results to show
the effect of temperatures on force measurements and time.

The calculation of shock absorption is the measured force divided by the reference
force, as seen in the Equation (1). But the reference force was not measured, therefore
the shock absorption cannot be calculated. Measuring of the reference point was not
completed due to risk of ruining the load cell. Therefore, in this report force
measurements are the only comparison basis between different combinations, layers,
and temperatures. For shock absorption, the greater the force measured, the lesser
shock absorption, which results as a harder substrate. Thus, one can say that a greater
force measurement equals lower shock absorption.

 6
4.1. Room temperature (26 °C)

Figure 8 show the curve course for force measurement on the artificial turf with S1
shockpad, without any infill. The curve course is very similar and uniform in the course.
Values for max force is measured between 2.5kN and 3.0kN for all the samples and
the top of the curve is measured between 21 ms and 23 ms.

 S1-P at 26 °C
 11,0
 10,5
 10,0
 9,5
 9,0
 8,5
 8,0
 7,5
 7,0
Force [kN]

 6,5
 6,0
 5,5
 5,0
 4,5
 4,0
 3,5
 3,0
 2,5
 2,0
 1,5
 1,0
 0,5
 0,0
 0

 10.1
 11.4
 12.6
 13.9
 15.2
 16.4
 17.7
 19.0
 20.2
 21.5
 22.8
 24.0
 25.3
 26.5
 27.8
 29.1
 30.3
 31.6
 32.9
 34.1
 35.4
 36.7
 37.9
 39.2
 40.4
 41.7
 43.0
 44.2
 45.5
 46.8
 48.0
 49.3
 1.3
 2.5
 3.8
 5.1
 6.3
 7.6
 8.8

 Time [ms]

Figure 8: The figure shows the curve course for the force measurement on Shockpad S1 without any
infill (S1-P) at room temperature 26 °C. The max force is measured at between 2.5kN and 3.0kN. The
 top of the curve is measured in time between 21 ms and 23 ms.

 7
Figure 9 show the curve course for force measurement on the artificial turf with S1
shockpad with both sand and olive granulate as infill (S1-P-S-O). The curve course
is very similar and uniform in the course. Values for max force is measured between
2.5kN and 3.0kN for all the samples and the top of the curve is measured between
21 ms and 23 ms.

 S1-P-S-O at 26 °C
 11,0
 10,5
 10,0
 9,5
 9,0
 8,5
 8,0
 7,5
 7,0
 Force [kN]

 6,5
 6,0
 5,5
 5,0
 4,5
 4,0
 3,5
 3,0
 2,5
 2,0
 1,5
 1,0
 0,5
 0,0
 0

 10.7
 11.7
 12.8
 13.9
 15.0
 16.0
 17.1
 18.2
 19.2
 20.3
 21.4
 22.4
 23.5
 24.6
 25.6
 26.7
 27.8
 28.8
 29.9
 31.0
 32.0
 33.1
 34.2
 35.2
 36.3
 37.4
 38.4
 39.5
 1.1
 2.1
 3.2
 4.3
 5.3
 6.4
 7.5
 8.5
 9.6

 Time [ms]

Figure 9: The figure shows the curve course for the force measurement on Shockpad S1 with both
sand and olive granulate infill (S1-P-S-O) at room temperature 26 °C . The max force is measured at
between 2.8 kN and 3.0 kN. The top of the curve is measured in time between 16 ms and 18 ms.

Figure 10 show the force measurement with the associated standard deviation for all
the samples at room temperature, 26 °C. The largest force measurement is the REF-
P, with a force at 10,39 kN. The lesser force measurement is S1-P with a force at 2.53
kN. For the samples using shockpad S1 and S2, no bigger change in force
measurement is observed when adding first sand, then using both sand and olive as
infill, measurements vary from 2.53 kN to a maximum of 2.96 kN in overall. The
samples using Alveosport as a shockpad is a bit different. The Alveo without any infill
is very hard, but when adding sand and olive granulate a lesser force is measured,
from 7.44 kN without infill to 4.78 kN with sand and olive infill.

 8
Force measurements at 26 °C
 11,0
 10,5 10,39
 10,0
 9,5
 9,0
 8,5
 8,0
 7,5 7,44
 7,0
 6,5
 6,0
 5,5
 Force[ KN]

 5,0
 4,78
 4,5
 4,0 4,18
 3,5
 3,0 2,84 2,96
 2,80 2,84
 2,5 2,53 2,64
 2,0
 1,5
 1,0
 0,5
 0,0

Figure 10: A graphical overview of force measurements on PureField Ultra HD with different
combinations of components at 26 °C. The black errors lines show the range of the standard deviation
of each sample.

 9
4.2. Cold temperature (-11 °C)

The ten samples in the conditioning cabinet was removed after 25 hours at -11 °C.
The temperature at the surface for each sample was measured directly after the drop
test was finished. The temperature measurement was within the range of -2 °C to
-6 °C.

Figure 11 show the curve course for force measurement on the artificial turf with S1
shockpad, without any infill. The curve course similar and uniform in the course.
Values for max force is measured between 2.4 kN and 2.7 kN for all the samples and
the top of the curve is measured between 20 ms and 24ms.

 S1-P at -11 °C
 11,0
 10,5
 10,0
 9,5
 9,0
 8,5
 8,0
 7,5
 7,0
 Force [kN]

 6,5
 6,0
 5,5
 5,0
 4,5
 4,0
 3,5
 3,0
 2,5
 2,0
 1,5
 1,0
 0,5
 0,0
 0

 10,1
 11,4
 12,6
 13,9
 15,2
 16,4
 17,7
 19,0
 20,2
 21,5
 22,8
 24,0
 25,3
 26,5
 27,8
 29,1
 30,3
 31,6
 32,9
 34,1
 35,4
 36,7
 37,9
 39,2
 40,4
 41,7
 43,0
 44,2
 45,5
 46,8
 1,3
 2,5
 3,8
 5,1
 6,3
 7,6
 8,8

 Time [ms]

Figure 11: The figure shows the curve course for the force measurement on Shockpad S1 without any
infill (S1-P) at room temperature - 11 °C. The max force is measured at between 2.4 kN and 2.7 kN.
The top of the curve is measured in time between 20 ms and 24 ms.

 10
Figure 12 show the curve course for force measurement on the artificial turf with S1
shockpad with sand and olive granulate infill. The curve course similar and uniform in
the course. Values for max force is measured between 4.9 kN and 5.5 kN for all the
samples and the top of the curve is measured between 8 ms and 10 ms.

 S1-P-S-O at -11 °C
 11,0
 10,5
 10,0
 9,5
 9,0
 8,5
 8,0
 7,5
 7,0
Force [kN]

 6,5
 6,0
 5,5
 5,0
 4,5
 4,0
 3,5
 3,0
 2,5
 2,0
 1,5
 1,0
 0,5
 0,0
 0

 10,5
 11,0
 11,6
 12,1
 12,7
 13,2
 13,8
 14,4
 14,9
 15,5
 16,0
 16,6
 17,1
 17,7
 18,2
 18,8
 19,3
 19,9
 20,4
 21,0
 0,6
 1,1
 1,7
 2,2
 2,8
 3,3
 3,9
 4,4
 5,0
 5,5
 6,1
 6,6
 7,2
 7,7
 8,3
 8,8
 9,4
 9,9

 Time [ms]

Figure 12: The figure shows the curve course for the force measurement on Shockpad S1 with both
sand and olive granulate infill (S1-P-S-O) at - 11 °C . The max force is measured at between 4.9 kN
and 5.5 kN. The top of the curve is measured in time between 8 ms and 10 ms.

Figure 13 show in general that the standard deviation has increased for all the
samples. The largest force measurement is the REF-P, with a force of 6.26 kN. The
lesser force measurement is the A-P with a force of 2.52 kN. The figure show that
when adding infill to all the shockpad combinations it becomes a greater force
measurement than without any infill. The largest increase in force measurement is
from S1-P at 2.58 kN, when only adding sand, to S1-P-S with a force measured at
5.29 kN. It seems that when adding olive granulate on the top of the sand infill, it has
no great significance to the force measurement. The combinations with Alveosport
shockpad has the lesser force measurement when comparing the other shockpads.

 11
Force measurements at -11 °C
 11,0
 10,5
 10,0
 9,5
 9,0
 8,5
 8,0
 7,5
 7,0
 6,5
 6,26
 6,0
 5,5
 Force [KN]

 5,29 5,20
 5,0
 4,5 4,57 4,47
 4,0 3,91
 3,5 3,38
 3,0 3,04
 2,5 2,58 2,52
 2,0
 1,5
 1,0
 0,5
 0,0

Figure 13: A graphical overview of force measurements on PureField Ultra HD with different
combinations of components at -11 °C. The black error bars show the range of the standard deviation
of each sample.

 12
4.3. Summary of results

Table 4 shows the average value and standard deviation for force measurement for
all the samples. Calculation of standard deviation is shown in Attachment B:
Calculation of standard deviation for the force measurementsIt can in general observe
for samples with infill material a greater force measurement after freezing. The
Alveosport shockpad combinations (A-P, A-P-S and A-P-S-O) has a lesser force
measured after cooling compared to the drop test at room temperature. The artificial
turf without shockpad or infill (REF-P) has a decreased force measured after cooling.
For the samples with shockpad S1 and S2 without any infill (S1-P and S2-P) no or
small change in shock abosprtion is observed after cooling.

Table 4: Overview of the force measurement at room and cold temperature. Standard Deviation
(Std.Dev.) is obtained from the calculation sheet in Attachment A.

 Sample Infill area density Force
 [ ∙ − ] measurement [kN]
 Sand - Olive stones Room temperature Cold temperature
 (26 °C) (-11 °C)
 Mean ± Std.Dev. Mean ± Std.Dev.
 REF-P 10.39 ± 0.51 6.26 ± 0.83
 S1-P 2.53 ± 0.10 2.58 ± 0.07
 S2-P 2.64 ± 0.09 3.04 ± 0.03
 A-P 7.44 ± 0.58 2.52 ± 0.15
 S1-P-S* 17.5 - 0 2.80 ± 0.12 5.29 ± 0.59
 S2-P-S 13 - 0 2.84 ± 0.07 4.57 ± 0.31
 A-P-S 17.5 - 0 4.18 ± 0.07 3.91 ± 0.62
 S1-P-S-O 11 - 2 2.84 ± 0.10 5.20 ± 0.29
 S2-P-S-O* 11 - 2 2.96 ± 0.06 4.47 ± 0.41
 A-P-S-O 11 - 2 4.78 ± 0.06 3.38 ± 0.30

 13
5. Discussion

The chapter addresses force measurements results, comparison of similar test
method and results from similar experiments found in literature.

5.1. Results from the force measurements

After the drop test at both temperatures, 26 °C and -10 °C, no visual damage could be
visually observed after testing.

From Figure 8 and Figure 11 the artificial turf with S1 shockpad without any infill at 26
°C and -11 °C, is presented. When compairing the figures, no major change in force
measurement or change in when the top of the curve is reached, is observed. This is
most likely because of low water absorption and that the shockpad is minimally
affected by the temperature change.

Before and after cooling of S1-P-S-O

Figure 9 and Figure 12, the artificial turf with S1 shockpad and sand and olive infill
(S1-P-S-O), the force measurement vary from 2.8 kN to 3.0 kN at 26 °C. For -11 °C
the force measurement varies from 4.8 kN to 5.5 kN. This indicate a change in shock
absorption after cooling. The time when the top of the curve is reached is unequal. At
26 °C the top is reached at 16 ms -18 ms. At -11 °C the range is between 8 ms - 10
ms. This indicates that the infill gives a higher shock abosprtion property at 26 °C than
at -11 °C. The time the top of the curve is reached is 8 ms longer at 26 °C than at -11
°C.

Samples with only shockpad

From Figure 10 and Figure 13, the lowest shock absorption was observed for REF-P,
which is an expected due to no added shockpad or infill, the force measured is lower
after cooling. This can be explained by the fibres becoming stiffer and providing better
shock absorption at -11°C than the ductility fibres at 26 °C. The artificial turf with
Alveosport shockpad (A-P), has a lower force measurement observed after cooling.
The force measured decreases from 7.44 kN to 2.52 kN. The shockpad could have
during watering had absorption of water. The absorbed water could have then frozen
 14
during cooling and this could have increased shock absorption. Therefore, the weight
of the samples should have been measured and weighed before and after cooling.
Since none of the shockpads is assumed to be 100% completed tight and could
contain some voids. The Alveosport shockpad which is a “sponge looking” foam
material, could contain capillary forces and have the ability to absorb more water than
the other shockpads. From Figure 13, the Alveosport shockpad combination (A-P, A-
P-S and A-P-S-O), changed in the shock abosprtion property to a lower force measure
after cooling. The biggest change in shock abosprtion is observed for A-P.

Samples with sand and olive granules

From Figure 13 it is observed a higher standard deviation for the samples with sand
and olive granulate infill. A higher standard deviation is most likely to occur from some
uneven distribution of infill and the large temperature change. Even though the infill
was laid and levelled as accurate as possible with the Jordan scrubbing brush (hard
surface) under preparation. A small difference in levelling will make a bigger difference
after cooling since the infill becomes hard, stuck and is not movable in the same way
as the behaviour in room temperature. From Figure 13 it is seen that both infills
systems, sand infill and a combination of both sand and olive granulate had about
equal shock absorption after cooling. This indicates that when adding olive granulate,
it does not have an impact on the shock absorption for either 26 °C or -10 °C. When
comparing the shockpads S1 and S2 with sand infills (S1/S2-P-S) after cooling, a
lower shock absorption is observed for S2. This may come from a greater thickness
of the pad and the lower amount of sand infill. It seems that an increasing amount of
sand will give a lower shock absorption after cooling.

Results from the drop test were expected, with the exception of the results affiliated
with the Alveosport shockpad. But to use artificial turf without shockpad is not an
option. A study from FieldTurf states that:

 “When installing lightweight infill systems, common with alternative / natural infills
 like cork, coconut and/or olive, there isn’t enough material in the system to provide
 the necessary shock absorption. To meet the needed industry safety requirements,
 a shockpad is added under the system to provide the adequate performance.” [12,
 p. 2]

 15
Summary of test results

Before cooling, a low standard deviation and expected results were observed. The
highest force measured was REF-P, but the lowest were S1-P. After cooling, a higher
standard deviation was observed. The highest force measured was REF-P, but the
lowest force measured was A-P. REF-P sample were highest force measured before
and after cooling, which is expected due to no added shockpad or infill. The samples
that contain Alveosport as a shockpad, received greater shock absorption after
cooling. The samples with infill had increased force measured, since the infill became
hard and solid after cooling.

5.2. Comparison of test methods

To be able to compare results and data from the different tests, it is important to
discuss which parameters were chosen during different procedures and mention what
is the difference and not the basis of comparison. When testing at a colder
temperature, both the FIFA and Nordic Standard specified a temperature of -5 °C
being used. In this experiment it was decided to use -11 °C due to the available freezer
only had this option and to test the extreme values would be of interest. By testing
shock absorption at conditions like -11 °C, gives an indication of which results could
be expected at lower degrees, but also whether a change can be observed or not.

Both the Nordic standard (NS) and FIFA procedure require larger samples than the
ones used in this experiment. From NS and FIFA, a minimum of 1m x 1m for a point-
elastic and mixed elastic sports surface is required. For an area-elastic combined
elastic sports surfaces measurement 3.5m by 3.5m is required [10], [11]. Both
standards require the impact position at least 100 mm apart from the other hit
positions, and at least 100mm from each edge. The samples from the experiment only
had dimensions equal to max length and width to 300 mm. The hit position at the test
samples were approximately 50mm from the edge and 100mm apart from the other
hit positions both vertically and horizontally, as seen in Figure 6. However, sample
size is not as relevant for drop-testing using the Instron Drop Impact Tower compared
with the AAA, used in the FIFA test. Since the AAA has three adjustable supporting
feet that are located on the sample itself, and the feet distance is required at not less

 16
than 250 mm from the impact position [11]. Since more impacts and low standard
derivation measured using the Instron, the test results are believed to be valid. During
the drop-testing, it was decided to use a total of five different hit positions, instead of
the three positions required at FIFA and NS, due to achieve more accurate results and
better comparison basis.

Parameters for the Instron Drop Tower

The height, velocity and mass were all according to the standard procedure in FIFA
Quality (Test method 04a) and Nordic standard (NS-EN 14808:2006). A height of
55mm, velocity equal 1.02 – 1.04 m/s and a total mass of 20.000g were used in the
experiment [10], [11].

The difference in measuring apparatus

In the experiment a drop impact test tower, Instron Drop tower Impact System (CEAST
9350), was used. The difference between the AAA, used in the FIFA test and the
Instron, is that the AAA uses a signal recording device to measure the velocity and
impact signal, but the Instron only measure the force by a load cell that is attached to
the hemisphere, when hitting the sample.

When FIFA and certified inspectors carry out measurements of shock absorption on
Norwegian artificial turfs, the test results are often very low and close to the minimum
limit for the requirements for shock absorption [3]. This means that if the artificial turf
is being winter maintenance and large temperature changes occur, the shock
absorption could go under the FIFA requirement limit for shock absorption. This will
affect the users experience and the player conditions for an unsatisfactory turf
condition during winter. Thus, there should be and specification requirement for turfs
that experience such conditions as Nordic countries, since FIFA requirements do not
reflect real conditions, only standardized countries that only experience conditions
above 0 °C.

 17
5.3 Results from similar experiments

In this intermediate chapter previous research and results will be discussed and linked
to the experimental results from the experiment in this report.

The study, “Effect of structural components, mechanical wear and environmental
conditions on the player-surface interaction on artificial turf football pitches” aimed to
determine the influence of structural components, the mechanical wear and
environmental conditions on the mechanical behaviour of third generation artificial
turfs. Twenty-three turf specimens were evaluated according to the FIFA Quality
programme. Mechanical properties were analysed according to the standard with
temperature, moisture, and wear conditions as variables. Temperature, in opposite to
wear conditions, did not significantly alter the mechanical behaviour of the surface,
although humidity reduced the degree of shock absorption of the artificial turf. The
characteristics of the components can explain up to 78,1% of the variance in
mechanical properties changes [13]. Small or no change in the shock abosprtion can
be observed in this study, but when testing SA at external conditions at -5 °C and 40
°C a change can be observed. Mainly the change occurs in a range of the standard
deviation. The results from this experiment is seen in Table 5.

 Table 5: Descriptive statistics of Shock Absorption (SA) from the study above [10].

 Variable Observations Mean ± Std.Dev.
 SA dry (%) 23 64.17 ± 1.57
 SA wet (%) 23 63.10 ± 1.66
 SA -5°C (%) 23 64.03 ± 2.50
 SA 40°C (%) 23 62.54 ± 2.84

Another study, “The effects of artificial surface temperature on mechanical properties
and player kinematics during landing and acceleration” aimed to determine the effects
of artificial surface temperature on mechanical properties of the turf and the kinematics
of a turf-sport related movement. In the study two identical third generation artificial
turfs were tested had fibre length of 65mm. The turf came from White Horse
Contractors in Abingdon (United Kingdom). The testing were done at two different
surface temperature, one with cold surface temperature outdoor at 1.8 °C to 2.4 °C

 18
and one with warm surface temperature indoor at 14.5 °C - 15.2 °C. Mechanical
properties were tested by measuring the surface properties. From their results the
temperature had a significant influence on the mechanical properties of the artificial
turf, including force absorption [14]. This study shows a magnificent change in force
abosprtion at two different surface temperature, since it is assumed that the same
combination of artificial turf, shockpad and infill is used at both surfaces, as shown in
Table 6. The force abosprtion is the same as shock absorption. However, due to no

information regarding the amount and type of infill materials, as well as what type of
shockpad being used. Therefore, it does not provide a suitable comparison basis with
the experimental results in this report, only that a change in temperature can occur,
but not the extent.

 Table 6: Force absorption of the cold and warm artificial surface, (Mean ± Standard Deviation) [11].

 Mechanical property Mean ± Std.Dev.
 Cold (1.8 °C - 2.4 °C) Warm (14.5 °C - 15.2 °C)
 Force absorption (%) 47.60 ± 2.43 62.20 ± 1.49

 5.4 What impact does this have on the users of the turf

A greater force measured on a specific surface, is equal to a surface with lesser shock
absorption which is harder substrate. A harder substrate is not beneficial for athletes
and to the users of the football turf due to higher risk for injuries and is less favourable
to fall upon [15]. For example, for football, which is a contact sport that include a lot of
running, jumping, and falling, none of the activities is preferable on a hard surface.
Due to frequent and repeated contact with the substrate, the force will absorb more in
the joints instead of substrate.

I order to be able to discuss more about what really happens and what impact this has
on the users, especially during the big temperature changes between summer and
winter, several properties of the artificial turf should be included, not only shock
absorption.

 19
5.5. Future work

Here are several points of interest in future work by measuring the effect of
temperature by force measurement and the associated time:

 • Testing at freeze point of water around 0 °C. To observe possible changes in
 shock absorption. More realistic temperature choice compared with -11 °C.
 • If a purpose of the testing is for a more specific area, the test should be with the
 optimal combination of shockpad and infill, with the desired and the lowest
 temperature that specific area can experience.
 • By drop testing with the same combinations, but without any sand infill,
 therefore only olive granulate as infill. This could give an indication of what
 causes the hardness after cooling.
 • Drop testing other types and amount of sand infill to map the properties of the
 sand after cooling.
 • Testing the artificial turf components at different surfaces underneath the
 sample, using for example concrete as both FIFA and NS uses as reference
 point and surface when testing.
 • The test samples should have been weighed before and after the cooling
 process to measure the water absorption of each sample.

 20
6. Conclusion

After the drop test at both temperature, 26 °C and -11 °C, no visual damage was
observed. The shock absorption value was not calculated in this experiment, due to
risk of destroying the load cell. In the report the basis for comparison is force
measurement.

Before cooling, it was observed low standard deviation and expected results. The
lowest force measured was REF-P with a force of 10.39 kN ± 0.51 kN, which is an
expected result due to no added shockpad or infill. The highest force measured was
S1-P with a force of 2.53 kN ± 0.10 kN.

After cooling, a higher standard deviation can be observed for all samples. A higher
standard deviation for the samples containing infill is most likely to occur from some
uneven distribution of infill and the temperature change. Increasingly amount of infill,
the lower shock absorption is observed after cooling. The lowest force measured was
observed at REF-P with a force of 6.26 kN ± 0.83 kN. The highest force measured
was observed at A-P with a force of 2.52 kN ± 0.15 kN. S1-P and S2-P had the same
force values measured and time recorded after cooling. When sand and olives were
added as infill the measured force increased and the time considerably. The infill
became hard and solid after cooling. The samples that contain Alveosport as a
shockpad, received greater shock absorption after cooling. This may be due to the
Alveosport shockpad having a greater water absorption than the other shockpads after
being immersed in water during sample preparation.

Previously FIFA field tests in Norway show in general a low shock absorption. The
field tests have been completed during the summer and autumn. The shock absorption
varies, as shown in this experiment, according to temperature and weather conditions.
This show that the FIFA testing is not a good reflection on real conditions.

A surface with a higher force measurement is not favourable for athletes or users of
the field. Football, and other sports that use the artificial turf, are contact sports that
include running, jumping, and falling. If these activities are combined with an artificial
turf with low shock abosprtion, the risk of injury may increase, and it is less preferable
to fall on.

 21
References

[1] “Weather statistics for Madrid (Spain),” YR, 2020. [Online]. Available:
 https://www.yr.no/place/Spain/Madrid/Madrid/statistics.html. [Accessed 13 07
 2020].

[2] “Weather statistics for Oslo (Norway),” YR, 2020. [Online]. Available:
 https://www.yr.no/place/Norway/Oslo/Oslo/Oslo/statistics.html. [Accessed 13
 07 2020].

[3] Kunstgress2021, “Pilotundersøkelse – spilleopplevelser av kunstgressbaner,”
 31 03 2020. [Online]. Available:
 https://www.godeidrettsanlegg.no/nyhet/hvordan-opplever-spillerne-
 kunstgressbanen. [Accessed 16 07 2020].

[4] “Contested Turf in San Francisco Bay Area Sports Field Design / Designing for
 Synthetic Turf Fields,” Carducci Associates, 03 2017. [Online]. Available:
 http://carducciassociates.com/news/2017/03. [Accessed 03 08 2020].

[5] Morton Extrusiontechnik GmbH, Mail exchange, Germany, 2020.

[6] T. Allen, L. Foster, M. Strangwood and J. Webster, Sports Materials, Basel:
 MDPI, 2020.

[7] SEKISUI ALVEO AG, Alveosport NU T 3001 12 mm, Luzern: alveo sport,
 2007.

[8] FieldTurf, “Technical Datasheet - PureSelect,” Germany, 2020.

[9] FIFA Quality Programme, “FIFA Quality Programme,” Fédération
 Internationale de Football Association, Switzerland, 2015.

[10] Standard Norge, “. Surfaces for sports areas - Determination of shock
 absorption,” Pronorm AS, Brussels, 2006.

 22
[11] “FIFA Quality Programme for Football Turf: Handbook of Test Methods,” 16 03
 2020. [Online]. Available: https://football-technology.fifa.com/media/1238/fqp-
 handbook-of-test-methods-2015-v31-w-cover.pdf. [Accessed 15 07 2020].

[12] M. C. Meyer, “STUDY CONCLUDES: SHOCK PADS NOT THE ANSWER TO
 FIELD SAFETY,” FieldTurf, Idaho, 2019.

[13] J. Sanchez-Sanchez, J. Garcia-Unanue, A. M. Gallardo, L. Gallardo, P.
 Hexaire and J. L. Felipe, “Effect of structural components, mechanical wear
 and enviromental conditions on the player-surface interaction on artifical turf
 football pitches,” 29 11 2017. [Online]. Available:
 https://www.researchgate.net/publication/321472301_Effect_of_structural_com
 ponents_mechanical_wear_and_environmental_conditions_on_the_player-
 surface_interaction_on_artificial_turf_football_pitches. [Accessed 26 06 2020].

[14] L. Charalambous, H. C. von Lieres und Wilkau, W. Potthast and G. Irwin,
 “ScienceDirect,” 27 01 2015. [Online]. Available:
 https://www.sciencedirect.com/science/article/pii/S2095254615000654.
 [Accessed 26 06 2020].

[15] C. Poulos, J. J. Gallucci, W. H. Gage, J. Baker, S. Buitrago and A. K.
 Macpherson, “The perceptions of professional soccer players on the risk of
 injury from competition and training on natural grass and 3rd generation
 artificial turf,” 03 08 2020. [Online]. Available:
 https://bmcsportsscimedrehabil.biomedcentral.com/articles/10.1186/2052-
 1847-6-11. [Accessed 01 03 2014].

 23
Appendix

Error! Not a valid result Calculation of standard deviation for the force pp.i
for table. measurements.

Attachment B Calculation process for adding infill pp.ii

 24
Attachment A:
Calculation process for adding infill.

 • The area of the turf is calculated using Equation (2):

 276.2
 = = = .
 ρAturf 3931 2

The value for were measured using a Mettler Toledo weighing device.

The value for were taken from the specific product-system declaration by the turf

system producer.

 • The weight of the sand infill to be added is calculated using Equation (3):

 Winfill = Aturf × ρAinfill (sand) = 0.0703 2 ∗ 11 000 = .
 2

The value were taken from the equation above.

The value for ( ) were taken from the specific product-system declaration by the

turf system producer.

 • The weight of the olive granules infill to be added is calculated using Equation
 (3):

 Winfill = Aturf × ρAinfill (sand) = 0.0703 2 ∗ 2000 = .
 2

The value were taken from the equation above.

The value for ( ) were taken from the specific product-system declaration by the

turf system producer.

 i
Attachment B:
Calculation of standard deviation for the force measurements.

Temperature: Max force
26°C
 Abbrev. Impact 1 Impac Impac Impac Impact Force Std.De
 t2 t3 t4 5 [kN] v [+/-]
 REF-P 9.86 10.18 10.83 10.05 11.02 10.39 0.51
 S1-P 2.45 2.45 2.61 2.46 2.66 2.53 0.10
 S2-P 2.74 2.72 2.58 2.52 2.66 2.64 0.09
 A-P 6.94 7.13 7.28 7.41 8.42 7.44 0.58
 S1-P-S 2.84 2.70 2.93 2.64 2.89 2.80 0.12
 S2-P-S 2.77 2.79 2.88 2.84 2.93 2.84 0.07
 A-P-S 4.13 4.29 4.21 4.19 4.10 4.18 0.07
 S1-P-S-O 2.78 2.69 2.89 2.89 2.93 2.84 0.10
 S2-P-S-O 2.87 3.01 2.94 2.98 3.02 2.96 0.06
 A-P-S-O 4.82 4.82 4.83 4.74 4.70 4.78 0.06
Temperature: Max force
- 10°C
Abbrev. Impact Impac Impac Impac Impact Force Std.De
 1 t2 t3 t4 5 [kN] v [+/-]
REF-P 5.66 5.34 7.32 6.90 6.09 6.26 0.83
S1-P x 2.55 2.68 2.54 2.55 2.58 0.07
S2-P 3.03 3.02 3.10 3.02 3.04 3.04 0.03
A-P 2.42 2.57 2.33 2.70 2.60 2.52 0.15
S1-P-S 5.85 4.69 5.27 4.72 5.93 5.29 0.59
S2-P-S 4.84 4.56 4.39 4.17 4.90 4.57 0.31
A-P-S 4.71 3.29 3.49 3.64 4.40 3.91 0.62
S1-P-S-O 5.01 4.83 5.48 5.18 5.48 5.20 0.29
S2-P-S-O 4.75 4.01 4.83 4.02 4.72 4.47 0.41
A-P-S-O 3.19 3.05 3.53 3.30 3.82 3.38 0.30

 ii
You can also read