Financial Vulnerability in the United Kingdom - Urban Institute
←
→
Page content transcription
If your browser does not render page correctly, please read the page content below
OPPORTUNITY AND OWNERSHIP

Financial Vulnerability in the United
Kingdom
From Brexit to the COVID-19 Pandemic

Breno Braga, Signe-Mary McKernan, and William J. Congdon
URBAN INSTITUTE

Elizabeth Mandiville, Mark Hayward, and Christopher Trepel
LOWELL’S EUROPEAN CONSUMER RESEARCH LABORATORY

March 2021

Financial well-being is multifaceted—reflecting people’s ability to manage daily
finances, resilience to economic shocks (such as an income drop or unexpected
expense), and capacity to pursue financial opportunities to move ahead. This brief
provides new insights about the ability of UK families to manage daily finances and
buffer against economic shocks. We developed an index that measures the overall
extent of household financial vulnerability in the UK and its individual nations, regions,
and parliamentary constituencies. We present our Financial Vulnerability Index findings
from the third quarter of 2017 through to the second quarter of 2020, a three-year
period covering the Brexit transition and the early months of the COVID-19 pandemic.
This is the first in a series of ongoing insights.

 Using both Lowell research and operational data and publicly available data to build our index, we
find that households in North East England are consistently more likely to be financially vulnerable than
any other UK region or nation over the reported time period. In contrast, households in South East
England are the least vulnerable. Blackpool South, Liverpool Walton, and Middlesbrough are the three
most financially vulnerable constituencies in the second quarter (Q2) of 2020. Finally, we describe a
rapid increase in financial distress during the COVID-19 pandemic across all UK nations and regions,
with households in London experiencing the highest relative increase in financial vulnerability.

Our work builds on recent literature that measures UK households’ financial well-being. The
University of Bristol’s UK Financial Wellness Index 1 measured the average financial wellness of the UK
population in 2015 and concluded that although families in the UK were relatively financially well, they
had considerable room for improvement. Researchers at the Financial Conduct Authority found that
borrowers who fall into financial distress tend to be clustered in urban areas, 2 while the Office for
National Statistics reported that, for the first time since 1988, UK households became net borrowers in
2017. 3 Our contribution provides a new household financial vulnerability measure capturing the early
effects of the COVID-19 pandemic at the parliamentary constituency level, as well as the UK as a whole
and national and regional levels. In doing so, we provide new data for local, regional, and national
policymakers to better understand the financial health of UK residents, thereby highlighting the degree
to which people are struggling and where to target resources.

What Is the Index Based On?
The Financial Vulnerability Index (FVI) is based on six components that capture a household’s ability to
manage daily finances and resilience to economic shocks: (1) carrying defaulted debt, (2) using
alternative financial products, (3) claiming social benefits, (4) lacking emergency savings, (5) holding a
high-cost loan, and (6) relying heavily on credit. These components are measured using Lowell’s
research and operational data, the 2017 UK Financial Lives survey, and data from the UK’s Department
for Work and Pensions and Office for National Statistics. We created the index by standardizing each
component, weighting each component using factor analysis, and normalizing the index from 0 to 100.
Details on why we chose these components, how they are defined, data sources, and the index
methodology are available in the appendix. The index score provides relative financial vulnerability
levels that can be used for comparison across geography and time; it does not provide an absolute
measure of financial vulnerability within a geographic area.

How Did Financial Vulnerability Change in the UK?
UK household financial vulnerability, as measured by our index, was relatively stable in the period
after Brexit Article 50 was triggered, increased as Brexit negotiations unfolded, and accelerated
dramatically with the start of the COVID-19 pandemic. The FVI for all UK households was relatively
stable between Q3 2017 and Q3 2018, rising from 33.8 to 35.0 (a 3.5 percent increase; figure 1). This
corresponds to the period after the UK invoked Article 50 of the Treaty on European Union and began
its official withdrawal from the economic block. The index then jumped 10 percent from Q3 2018 (35.0)
to Q4 2019 (38.6), during which numerous meetings were held between UK and EU negotiators to
develop a framework for post-Brexit relations between the two parties.

 The financial vulnerability level accelerated significantly at the onset of the COVID-19 crisis in the UK,
when many people suddenly found themselves out of work. From Q1 to Q2 2020, the FVI increased 16
percent to 46.2, its highest point over the entire period. This sharp increase is consistent with other
economic trends in the United Kingdom during the pandemic: by summer 2020, 444,000 more people

 2 FINANCIAL VULNERABILITY IN THE UK: FROM BREXIT T O THE COVID-19 PANDEMIC
were in poverty (Legatum Institute 2020) because of the COVID-19 pandemic, and from August to
October 2020, 280,000 fewer adults were employed 4 in the UK compared with a year earlier. This result is
also consistent with new evidence from the Financial Lives survey (FCA 2021) that shows the number of
adults with low financial resilience increased by 3.5 million between March and October 2020.

FIGURE 1
UK Financial Vulnerability Increased Steadily during Brexit Negotiations and Accelerated
Dramatically Following the Detection of COVID-19
UK FVI (0–100) over time

 50

 45

 40
 First
 Johnson becomes confirmed
 Prime Minister COVID-19
 35 (July 24, 2019) cases in UK
 Brexit Article 50 (January 31,
 triggered 2020)
 30 (March 29, 2017)

 25

 20
 2017 2017 2018 2018 2018 2018 2019 2019 2019 2019 2020 2020
 Q3 Q4 Q1 Q2 Q3 Q4 Q1 Q2 Q3 Q4 Q1 Q2

Sources: Authors’ analyses of Lowell research and operational data, Department for Work and Pensions data on Jobseeker’s
Allowance and Universal Credit claims, the Financial Conduct Authority’s 2017 Financial Lives survey, and Office for National
Statistics population estimates.
Notes: The FVI is based on the following components: share of adults who are Lowell consumers in default, share of adults using
alternative financial products, share of adults claiming social benefits, share of adults without emergency savings, share of Lowell
consumers with high-cost loans, and average credit use among Lowell consumers. To combine the index components, we use
factor analysis and normalize the index so that scores fall between 0 and 100.

 All time-varying components of the FVI increased from Q3 2017 to Q2 2020, with the largest
increase occurring from Q4 2018 to Q2 2020 (figure 2). The share of adults claiming social benefits
showed the largest gain, increasing slightly from 4.5 to 5.3 percent between Q3 2017 and Q4 2018 and
then more than doubling to 13.5 percent by Q2 2020. This reflects the massive increase in Universal
Credit and Jobseeker’s Allowance claims made during the pandemic (up about 115 percent between
March and November 2020). 5 As discussed in the data section (see appendix), this increase is explained

 FINANCIAL VULNERABILITY IN THE UK: FROM BREXIT T O THE COVID-19 PANDEMIC 3
by both changes in the number of people who were out of work and workers who were furloughed or
had their hours cut because of the pandemic.

 Credit use among Lowell consumers increased substantially after the onset of COVID-19: from 43.6
percent in Q4 2018 to 52.3 percent in Q2 2020. This suggests that while households with higher
incomes spent less, increased savings, and paid off existing debt 6 during the pandemic, people in
financial distress (e.g., many Lowell consumers) likely relied on credit cards to buffer against negative
economic shocks. In contrast with the other index components, the shares of adults who are Lowell
consumers in default and have high-cost loans showed much smaller increases over the three years.

FIGURE 2
Each FVI Time-Varying Component Increased from 2017 to 2020
Time-varying components of the FVI (percent)

 Q3 2017 Q4 2018 Q2 2020

 52.3

 43.6
 39.4

 16.9 17.0 17.4
 12.5 13.5
 11.4 11.8

 4.5 5.3

 Share of adults who are Share of adults claiming Share of Lowell consumers Average credit use among
 Lowell consumers in default social benefits with high-cost loans Lowell consumers

Sources: Authors’ analyses of Lowell research and operational data, Department for Work and Pensions data on Jobseeker’s
Allowance and Universal Credit claims, and Office for National Statistics population estimates.
Notes: Share of adults who are Lowell consumers in default is the number of Lowell consumers with at least one debt in default as
a share of the adult population. Share of adults claiming social benefits is the number of Universal Credit claimants who are
required to seek work plus Jobseeker’s Allowance claimants as a share of the adult population. Share of Lowell consumers with
high-cost loans is the share of Lowell consumers with a subprime loan. Average credit card use among Lowell consumers is the
average ratio of credit usage and total available credit for Lowell consumers.

Regional Variation in Financial Vulnerability
Households in North East England were the most financially vulnerable during the full period of
analysis (table 1). This result is not surprising because North East England is the region with the highest

 4 FINANCIAL VULNERABILITY IN THE UK: FROM BREXIT T O THE COVID-19 PANDEMIC
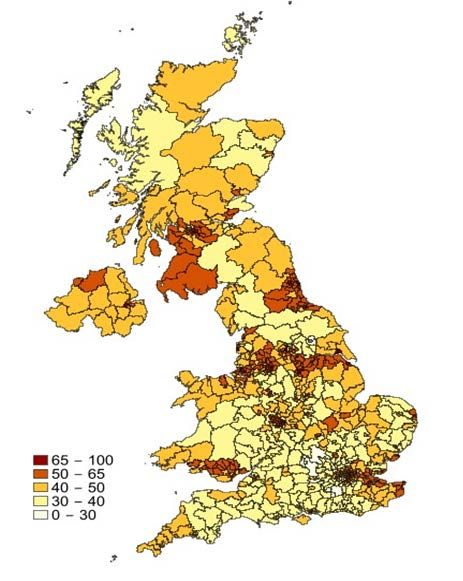
unemployment rate 7 and one of the regions with the highest share of people with low incomes 8 (after
considering housing expenses). Families in South East England were the least financially vulnerable
during this time period, enjoying the UK’s second highest disposable household incomes 9 (after London)
and a lower likelihood of poverty (Francis-Devine 2020).

 The FVI reveals a small increase in household financial vulnerability for all regions and nations from
2017 to 2018 and a much larger increase from 2018 to 2020, which includes the onset of COVID-19
(table 1). London experienced the largest increase in household financial vulnerability following the
onset of COVID-19, with an overall 41 percent increase in its FVI score from Q4 2018 to Q2 2020.
London’s economy is highly dependent on the service sector (an estimated 92 percent 10 of London jobs
are in the service sector), which deteriorated badly as a result of COVID-19. 11 Moreover, recent results
from the Financial Lives survey (FCA 2021) reveal that adults in London are most likely to say their
financial situation has worsened during the COVID-19 pandemic.

TABLE 1
Significant Increases in Financial Vulnerability for All Nations and Regions after 2018
FVI (0–100) by nation and region over time

 Nation/region Q3 2017 Q4 2018 Q2 2020
 North East 45.4 47.5 57.5
 North West 38.3 40.3 51.5
 Yorkshire and the Humber 38.7 40.6 51.2
 Northern Ireland 40.6 41.8 50.9
 Wales 37.3 38.9 48.6
 West Midlands 35.1 37.4 48.5
 Scotland 37.8 38.7 47.7
 London 30.6 32.8 46.1
 East Midlands 32.3 34.1 44.1
 East of England 29.7 31.7 41.6
 South West 29.0 31.0 40.3
 South East 27.4 29.4 39.1
Sources: Authors’ analyses of Lowell research and operational data, Department for Work and Pensions data on Jobseeker’s
Allowance and Universal Credit claims, the Financial Conduct Authority’s 2017 Financial Lives survey, and Office for National
Statistics population estimates.
Note: See figure 1 notes for how the FVI is calculated.

Measuring Financial Vulnerability in UK Parliamentary
Constituencies
Household financial vulnerability varied significantly across the UK’s 650 parliamentary constituencies
(figure 3). Households in Blackpool South, Liverpool Walton, and Middlesbrough were the most
financially vulnerable in Q2 2020, with index scores 65 percent (76.1), 55 percent (70.3), and 52
percent (71.6) higher than the national average (46.2), respectively. Zooming in on index components
for these three parliamentary constituencies, roughly one in four adults were Lowell consumers in

 FINANCIAL VULNERABILITY IN THE UK: FROM BREXIT T O THE COVID-19 PANDEMIC 5
default (28 percent, 28 percent, and 27 percent, respectively) or held high-cost loans (24 percent in
Blackpool South, 23 percent in Middlesbrough, and 21 percent in Liverpool Walton), and more than one
in four adults claimed social benefits (30 percent in Blackpool South, 27 percent in Middlesbrough, and
28 percent in Liverpool Walton). These results are consistent with other economic hardship measures,
as Blackpool, Middlesbrough, and Liverpool carried high levels of financial deprivation, 12 with
Middlesbrough and Blackpool ranking as the most deprived districts as measured by income
deprivation affecting children.

 In contrast, families in York Outer, Mole Valley, and Richmond Park were the least financially
vulnerable in Q2 2020, with index scores of 29.1, 29.2, and 29.4, respectively. These parliamentary
constituencies contained a low share of adults who are Lowell consumers in default (5 percent in York
Outer, 5 percent in Mole Valley, and 7 percent in Richmond Park) or with high-cost loans (13 percent,
12 percent, and 7 percent, respectively), as well as a small number of adults claiming social benefits (6
percent, 7 percent, and 9 percent, respectively).

FIGURE 3
Significant Variation in Financial Vulnerability across the United Kingdom
FVI (0–100) by Parliamentary Constituency in Q2 2020

Sources: Authors’ analyses of Lowell research and operational data, Department for Work and Pensions data on Jobseeker’s
Allowance and Universal Credit claims, the Financial Conduct Authority’s 2017 Financial Lives survey, and Office for National
Statistics population estimates.
Note: See figure 1 notes for how the FVI is calculated.

 6 FINANCIAL VULNERABILITY IN THE UK: FROM BREXIT T O THE COVID-19 PANDEMIC
Four of the five parliamentary constituencies that experienced the largest financial vulnerability
increases between Q4 2019 and Q2 2020 were in London: Tottenham, Walthamstow, East Ham, and
Brent Central (figure 4). This result is consistent with our global finding that London was the region with
the greatest increase in household financial vulnerability and is mainly explained by an increase in the
share of adults claiming social benefits. For example, in Tottenham, fewer than one in ten adults (11.3
percent) applied for social benefits during Q4 2019. By Q2 2020, more than one in four adults
submitted applications (27.5 percent). Similarly, East Ham saw a jump in social benefit claims (from 7.9
percent to 21.4 percent). Credit card use also increased slightly over this time period from 45.8 percent
to 47.8 percent in Walthamstow and from 46.6 percent to 47.1 percent in Brent Central.

FIGURE 4
Parliamentary Constituencies in London Experienced the Highest Increase in Financial Vulnerability
during COVID-19
FVI (0–100)—top-five increases between Q4 2019 and Q2 2020

 Q4 2019 Q1 2020 Q2 2020
 76.1

 63.7 64.5
 61.1 60.2
 56.6 57.0

 47.2 48.1 47.1
 46.2
 42.3 43.2 43.9
 41.6

 Tottenham Walthamstow Blackpool South East Ham Brent Central

Sources: Authors’ analyses of Lowell research and operational data, Department for Work and Pensions data on Jobseeker’s
Allowance and Universal Credit claims, the Financial Conduct Authority’s 2017 Financial Lives survey, and Office for National
Statistics population estimates.
Note: See figure 1 notes for how the FVI is calculated.

Comparisons with Other Indicators
How does our FVI contrast with other indicators of economic distress? To answer this question, we
compare our index with the UK unemployment rate, the share of UK adults reporting low financial
satisfaction, and the English index of deprivation. 13 We find that both the unemployment rate and share

 FINANCIAL VULNERABILITY IN THE UK: FROM BREXIT T O THE COVID-19 PANDEMIC 7
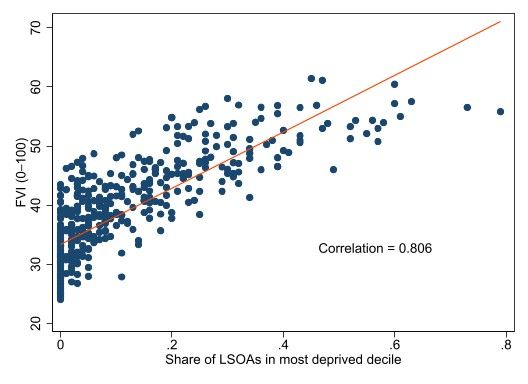
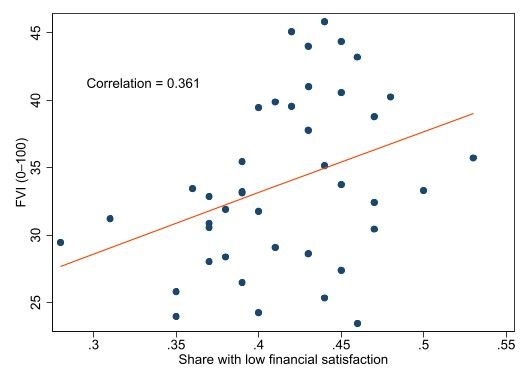
of adults reporting low financial satisfaction are moderately positively correlated with our FVI
(correlations of 0.41 and 0.36, respectively). The moderate relationship between these measures (i.e.,
less than 0.5) indicates that household financial vulnerability cannot be solely measured by
employment status or level of satisfaction with one’s finances. By contrast, we find a strong positive
correlation between the English index of deprivation and our FVI (correlation of 0.81). Given that
deprivation is defined as the general absence of resources (including, but not limited to, income and
employment), it stands to reason that the FVI is trending in similar ways. Overall, these results highlight
the importance of a multifaceted approach to measuring household financial well-being.

FIGURE 5
The FVI Is Positively Correlated with Unemployment, Share of Adults with Low Financial Satisfaction,
and the English Deprivation Index
(a) FVI (0–100) correlated with the unemployment rate: parliamentary constituency level in Q4 2019

 8 FINANCIAL VULNERABILITY IN THE UK: FROM BREXIT T O THE COVID-19 PANDEMIC
(b) FVI (0–100) correlated with the share of adults with low financial satisfaction: NUTS2 level in Q4 2017

(c) FVI (0–100) correlated with the English deprivation index: parliamentary constituency level in Q4 2019

Sources: The Labor Force Survey and authors’ analyses of Lowell research and operational data, Department for Work and
Pensions data on Jobseeker’s Allowance and Universal Credit claims, the Financial Conduct Authority’s 2017 Financial Lives
survey, and Office for National Statistics population estimates.
Notes: See figure 1 notes for how the FVI is calculated. (a) Each dot represents a parliamentary constituency in Q4 2019. (b) Each
dot represents a NUTS2 region in Q4 2017. (c) Each dot represents an English parliamentary constituency in Q4 2019. The English
deprivation index indicates the share of Lower Layer Super Output Areas (LSOAs) in a parliamentary constituency classified as
highly deprived, defined as the top decile of deprivation in England.

 FINANCIAL VULNERABILITY IN THE UK: FROM BREXIT T O THE COVID-19 PANDEMIC 9
What Do These Findings Mean?
A household’s ability to manage daily finances and effectively respond to economic shocks is crucial to
both household financial well-being and the economic health of communities (McKernan et al. 2016).
During economic crises, financially healthy households can better weather the storm and contribute to
economic recovery. But financial health, like economic recovery, is unevenly distributed. The FVI is
designed to help national and local leaders assess the state of their constituents’ financial health and
target resources to advance an inclusive recovery.

 Financial vulnerability varies significantly across the United Kingdom. Many areas that have
historically relied on heavy industrial manufacturing (such as North East England and Middlesbrough)
and some coastal towns (such as Blackpool South) showed consistently greater financial vulnerability
than other parts of the UK from Q3 2017 through Q2 2020. We measure a rapid increase in financial
hardship in areas of London (such as Tottenham, Walthamstow, and East Ham) during the onset of the
COVID-19 pandemic. The increase in household financial vulnerability in these areas might reflect
changes in the labor market during the pandemic, as workers in London rely heavily on service jobs.

 The FVI reveals that UK household financial vulnerability was relatively stable in the period after
Brexit Article 50 triggered, increased as Brexit negotiations and press coverage continued, and
accelerated dramatically when the COVID-19 pandemic started. Future research could disentangle the
causes of the increase in financial distress among households in the UK. For example, the descriptive
results presented in this brief cannot tell us whether financial vulnerability caused Brexit, vice versa, or
if other underlying trends or UK policies are driving the changes we observe.

Appendix. Index Construction
Here we describe the construction of the Financial Vulnerability Index and provide additional detail on
the index components, data sources, and analytic methods.

Index Components
The components used in the FVI are selected to capture different aspects of financial vulnerability, with
a focus on two financial well-being concepts: people’s ability to manage their daily finances and their
resilience to economic shocks. The selection of specific financial or economic measures corresponding
to those concepts depended, in part, on data quality and availability (see discussion of Data Sources
below). Starting with a list of 12 consumer financial indicators, the resulting index components are (1)
carrying defaulted debt, (2) using alternative financial products, (3) claiming social benefits, (4) lacking
emergency savings, (5) holding a high-cost loan, and (6) relying heavily on credit (table A.1).

 The first three components capture an individual’s ability to manage daily finances. Having debt in
default indicates that people could not (or would not) pay certain bills. Using alternative financial
products, such as payday loans, suggests that people’s needs are not met by their current income

 10 FINANCIAL VULNERABILITY IN THE UK: FROM BREXIT T O THE COVID-19 PANDEMIC
sources or the traditional financial sector; it can also signal that people are having trouble managing
their daily finances and have less access to safe, affordable loan products to help them weather
unexpected financial needs. Applying for government assistance through Universal Credit or
Jobseeker’s Allowance is often triggered by job loss or a negative income shock. It also indicates that a
household cannot sustain itself without government help.

 The remaining three components principally capture people’s resilience to economic shocks. People
without emergency savings are less likely able to weather negative economic shocks. Having a high-cost
loan signals low economic resilience and the need to use high-cost credit, while high average credit use
reflects borrowing approaching, or at, the limit of the credit available to the consumer (indicating a lack
of credit buffer).

TABLE A.1
Components of the Financial Distress Index

 Time
 Component Definition Type variation
 Share of adults who Number of Lowell consumers with defaulted Ability to manage Variant
 are Lowell consumers debt divided by the adult population of the daily finances
 in default area
 Share of adults using Share of adults with one or more of the Ability to manage Invariant
 alternative financial following: hire purchase, rent-to-own (other daily finances and
 products than for a motor vehicle), payday loans, short- resilience
 term installment loans, home collected loans,
 pawnbroking, or logbook loans
 Share of adults Number of Universal Credit claimants who are Ability to manage Variant
 claiming social required to seek work plus the number of daily finances
 benefits Jobseeker’s Allowance claimants divided by
 the adult population of the area
 Share of adults Share of adults who have less than £5,000 in Resilience Invariant
 without emergency savings
 savings
 Share of Lowell Number of Lowell consumers with a subprime Resilience Variant
 consumers with high- loan divided by the number of Lowell
 cost loans consumers in the area
 Average credit use Average ratio of credit usage to credit limit for Ability to manage Variant
 among Lowell Lowell consumers in the area daily finances and
 consumers resilience

Data Sources
Data and measures for index components are from several sources, including Lowell’s research and
operational data as well as publicly available data (table A.2). Lowell is one of the UK’s largest firms
engaged in the purchase and collection of defaulted consumer debt. The FVI relies principally on Lowell
data for our measures of credit health, including the number of consumers in default, share of Lowell
consumers with high-cost loans (loans with interest rates that are higher than the prime rate), and
average credit use. These data include information on approximately nine million consumers
(approximately 17.6 percent of all UK adults) and span both active accounts (as of July 2020) and

 FINANCIAL VULNERABILITY IN THE UK: FROM BREXIT T O THE COVID-19 PANDEMIC 11
accounts closed after June 2018. These data also include residential postcodes, which we use to
construct index values for different geographic regions. Lowell consumers are typically in financial
distress, having defaulted on at least one unsecured credit account (and often more than one). Lowell
has detailed credit records for each consumer from two major credit reference agencies, including data
on the balances of all debt types, credit use, and default indicators from Q3 2017 to Q2 2020.

 One potential concern with Lowell’s data is whether they are representative of the overall UK
population. Although Lowell does not search for a specific consumer type, its consumers are typically in
financial distress. As a result, Lowell’s consumer-level data are less likely to reflect the financial well-
being of financially secure people. However, for the purposes of the index, the geographic distribution
of Lowell consumers may well reflect the distribution of financially vulnerable consumers in the UK. To
answer this question, we compare the location of Lowell consumers with other consumers in default
using May 2020 credit record data grouped up to the NUTS3-level 14 from one of the UK’s major credit
reference agencies. 15 We find that Lowell consumers are located in the same local areas as other
consumers in default and calculate a very strong (0.97) correlation between the share of adults who
are Lowell consumers in default in a NUTS3 area and the share of consumers whose credit file
contains a defaulted debt in the same area.

 We complement the Lowell data with publicly available data. The Office for National Statistics
(ONS) releases national and subnational midyear adult population estimates for the UK. 16 Estimates are
produced using the cohort component method, which updates the population base from census
estimates based on population change. We linearly interpolate midyear population estimates to obtain a
quarterly measure of the adult population at the parliamentary constituency level. These population
estimates provide the denominator for our index components that are measured as adult population
shares.

 For data on alternative financial products and emergency savings, we draw on the 2017 Financial
Lives survey conducted by the Financial Conduct Authority. 17 This survey was administered in the first
half of 2017 and asked approximately 13,000 UK adults about their financial situation and experiences
with financial products using a random probability sample design based on respondents’ addresses.
From this survey, we obtain the share of adults who report using alternative financial products and the
share without emergency savings at the NUTS2 level. 18 Note two complicating features of these data
for the purpose of building our index: first, because these data are not available at the parliamentary
constituency level, we assign values from the NUTS2 level to all parliamentary constituencies within
that area. Second, because at the analysis stage of this brief we only observe a single observation for
these measures, the two components of the FVI based on this source do not vary over time in our
tracking period (as described in table A.1). Despite these limitations, we include these two components
for two reasons: (1) they measure important aspects of people’s financial well-being from a nationally
representative sample of adults that includes adults who are underbanked or credit invisible, which are
missing from the Lowell data; (2) a second wave of the Financial Lives survey was released in 2021, 19
which will allow us to explore the time variation of these measures in future updates of the index.

 12 FINANCIAL VULNERABILITY IN THE UK: FROM BREXIT T O THE COVID-19 PANDEMIC
Finally, we use data from the Department of Work and Pensions (accessed via Nomis) 20 on the
number of people who have submitted a claim for Universal Credit who are required to seek work and
the number of Jobseeker’s Allowance claimants, both at the parliamentary constituency level. We
combine these figures, expressed as a share of adults, to calculate our component measure: share
claiming social benefits. This statistic seeks to measure the number of people claiming social benefits
principally for unemployment, although those claiming unemployment-related benefits (either
Universal Credit or the Jobseeker’s Allowance) may be fully unemployed and seeking work or may be
employed but eligible for unemployment-related benefit support because of low income or low work
hours. 21 Consequently, while most movement in the claimant count reflects changes in the number of
people who are out of work, to a lesser extent it also reflects workers who were furloughed or had their
hours reduced. 22

TABLE A.2
Data Sources

 Data source Component Geographic unit Time coverage Frequency
 Lowell research Lowell consumers in default, Parliament Past three years Monthly
 and operational Lowell consumers with high-cost constituencies
 data loans, average credit use
 ONS population Adult population Parliament 2017–18 Annually
 estimates constituencies
 2017 Financial Share using alternative financial NUTS2 2017 Single
 Lives survey products and share without observation
 emergency savings
 Nomis/ Universal Credit claimants who Parliament 2017–20 Quarterly
 Department for are required to seek work plus constituencies
 Work and Jobseeker’s Allowance claimants
 Pensions

Index Methodology
To create the FVI using observations for all parliamentary constituencies from Q3 2017 to Q2 2020, we
first standardize each component of the index to create z-scores. This standardization process assures
that we can aggregate components measured in different units.

 Next, we select a suitable weighting and aggregation method. We use factor analysis 23 to derive the
weights for each component. The idea behind factor analysis is to account for the highest possible
variation in the set of indicators using the smallest possible number of factors, which we define below.
This statistical procedure identifies the common variance among a set of observed variables (i.e., the
index components) and creates a factor composed of that common variance. The factor scores are
calculated with a linear equation that incorporates a weighted contribution of each variable included in
the analysis. The weight of each variable is relative to the amount of variance it shares in common with
the other variables. To perform the factor analysis, we use parliamentary constituency level
observations from Q3 2017 to Q2 2020.

 FINANCIAL VULNERABILITY IN THE UK: FROM BREXIT T O THE COVID-19 PANDEMIC 13
Finally, we normalize the index to range from zero to 100. To do that, we implement the following
steps:

 1. Identify the lowest and highest values of each index component observed across all
 parliamentary constituencies during the period of analysis.

 2. Set the value of the index when each component is 1.1 times its highest observed value as equal
 to 100.

 3. Set the value of the index when each component is 0.4 times its lowest observed value as equal
 to zero.

 4. Normalize the index to all parliamentary constituencies during the period of analysis as the
 distance between these lowest and highest reference points.

 By making these adjustments, we ensure that index values calculated during the analysis are
between zero and 100 and allow room for future index values, calculated during planned periodic
updates, to be within the same range.

 The index was created at the lowest geographical level (parliamentary constituency) for each
quarter between Q3 2017 and Q2 2020. To obtain indices consistent across geographic levels, we
constructed the index at broader geographic areas using a simple weighted average of smaller
geographies’ indices. For example, the FVI for Region and Nation in period is

 = �
 ∈

where is the FVI of parliamentary constituency in region R in period , and is the share of
the population of region residing in constituency . In the same way, the FVI for the United Kingdom
is a population-weighted average of the index for all parliamentary constituencies:

 = �
 ∈

 is the share of United Kingdom population in constituency .

Notes
1 “The Momentum Household Financial Wellness Index,” University of Bristol, 2016,
 http://www.bristol.ac.uk/geography/research/pfrc/themes/fincap/momentum-uk-index/.
2 Adiya Belgibayeva, Karen Croxson, Zanna Iscenko, Jesse Leary, and Jonathan Shaw, “Journey into Distress Part
 2—The Profile of Debtors in Difficulty,” Insight, January 8, 2020, https://www.fca.org.uk/insight/journey-
 distress-part-2-profile-debtors-difficulty.
3 “Making Ends Meet: Are Households Living Beyond Their Means?,” Office for National Statistics, July 26, 2018,
 https://www.ons.gov.uk/economy/nationalaccounts/uksectoraccounts/articles/makingendsmeetarehouseholds
 livingbeyondtheirmeans/2018-07-26.

 14 FINANCIAL VULNERABILITY IN THE UK: FROM BREXIT T O THE COVID-19 PANDEMIC
4 “Employment in the UK: December 2020,” Office for National Statistics, accessed February 19, 2021,
 https://www.ons.gov.uk/employmentandlabourmarket/peopleinwork/employmentandemployeetypes/bulletins
 /employmentintheuk/december2020.
5 “Employment in the UK: February 2021,” Office for National Statistics, accessed February 19, 2021,
 https://www.ons.gov.uk/employmentandlabourmarket/peopleinwork/employmentandemployeetypes/bulletins
 /employmentintheuk/latest.
6 Mia Gray, “Covid Has Exacerbated Soaring Problem Debt Levels in the UK,” The Guardian, December 2, 2020,
 https://www.theguardian.com/society/2020/dec/02/covid-has-exacerbated-soaring-problem-debt-levels-in-
 the-uk?CMP=Share_AndroidApp_Other.
7 “Labour Market in the Regions of the UK: September 2020,” Office of National Statistics, accessed February 19,
 2021,
 https://www.ons.gov.uk/employmentandlabourmarket/peopleinwork/employmentandemployeetypes/bulletins
 /regionallabourmarket/september2020#:~:text=The%20UK%20region%20with%20the%20highest%20unempl
 oyment%20rate%20estimate%20for,followed%20by%20London%20at%205.0%25.&text=This%20was%20foll
 owed%20by%20Wales,unemployment%20rate%20for%20the%20region.
8 “Poverty in the UK: Statistics,” House of Commons Library, June 18, 2020,
 https://commonslibrary.parliament.uk/research-
 briefings/sn07096/#:~:text=How%20many%20people%20are%20in,level%20to%20the%20year%20before.
9 “Regional Gross Disposable Household Income, UK: 1997 to 2017,” Office for National Statistics, accessed
 February 19, 2021,
 https://www.ons.gov.uk/economy/regionalaccounts/grossdisposablehouseholdincome/bulletins/regionalgrossd
 isposablehouseholdincomegdhi/1997to2017.
10 “Labour Market in the Regions of the UK: September 2020,” Office of National Statistics, accessed February 19,
 2021,
 https://www.ons.gov.uk/employmentandlabourmarket/peopleinwork/employmentandemployeetypes/bulletins
 /regionallabourmarket/september2020#:~:text=The%20UK%20region%20with%20the%20highest%20unempl
 oyment%20rate%20estimate%20for,followed%20by%20London%20at%205.0%25.&text=This%20was%20foll
 owed%20by%20Wales,unemployment%20rate%20for%20the%20region.
11 “Coronavirus and the Impact on Output in the UK Economy: August 2020,” Office for National Statistics,
 accessed February 19, 2021,
 https://www.ons.gov.uk/economy/grossdomesticproductgdp/articles/coronavirusandtheimpactonoutputintheu
 keconomy/august2020.
12 “English Indices of Deprivation 2019,” Gov.uk, September 26, 2019,
 https://www.gov.uk/government/statistics/english-indices-of-deprivation-2019.
13
 Unemployment rate data come from the Labor Force Survey, which the team accessed via Nomis: “Dataset
 Selection,” Nomis: official labour market statistics, accessed February 19, 2021,
 https://www.nomisweb.co.uk/query/select/getdatasetbytheme.asp?theme=35. The most recent unemployment
 rate measured at the parliamentary constituency level is from 2019. Financial satisfaction data come from the
 “2017 Financial Lives Survey” conducted by the Financial Conduct Authority (updated February 11, 2021,
 https://www.fca.org.uk/publications/research/financial-lives) and are only measured in 2017 and at the NUTS2
 geographic level (see appendix). The social deprivation index is from the House of Commons Library using data
 published by the Ministry of Housing, Communities and Local Government (MHCLG): “Deprivation in English
 Constituencies, 2019,” House of Commons Library, October 1, 2019,
 https://commonslibrary.parliament.uk/research-briefings/cbp-7327/. Deprivation index measures are only
 created for parliamentary constituencies in England in 2019 and are produced by combining a wide range of data
 for small areas on various aspects of deprivation, including income, employment, health, education, crime,
 barriers to housing, and the living environment. The statistics indicate the share of Lower Layer Super Output
 Areas (LSOAs) in a parliamentary constituency is classified as highly deprived (defined as England’s top decile of
 deprivation).

 FINANCIAL VULNERABILITY IN THE UK: FROM BREXIT T O THE COVID-19 PANDEMIC 15
14 “Your Key to European Statistics,” Eurostat, accessed February 19, 2021,
 https://ec.europa.eu/eurostat/web/nuts/background.
15 The lowest level of geography available in the credit bureau data was NUTS3.
16 “Estimates of the Population for the UK, England and Wales, Scotland and Northern Ireland,” Office for National
 Statistics, accessed February 19, 2021,
 https://www.ons.gov.uk/peoplepopulationandcommunity/populationandmigration/populationestimates/datase
 ts/populationestimatesforukenglandandwalesscotlandandnorthernireland.
17 “Overview of the Financial Lives Survey,” Financial Conduct Authority, updated February 11, 2021,
 https://www.fca.org.uk/publications/research/understanding-financial-lives-uk-adults.
18 “Your Key to European Statistics,” Eurostat, accessed February 19, 2021,
 https://ec.europa.eu/eurostat/web/nuts/background.
19 “Overview of the Financial Lives Survey,” Financial Conduct Authority, updated February 11, 2021,
 https://www.fca.org.uk/publications/research/understanding-financial-lives-uk-adults.
20 “Dataset Selection,” Nomis, accessed February 19, 2021,
 https://www.nomisweb.co.uk/query/select/getdatasetbytheme.asp?theme=35.
21
 Under Universal Credit a broader span of claimants became eligible for unemployment-related benefits than
 under the previous benefit regime. During the rollout of the Universal Credit program, movements in the
 claimant counts might have been significantly affected by this expanded eligibility. This impact has led to the
 claimant count being reclassified as an Experimental Statistic: “Guide to Experimental Statistics,” Office for
 National Statistics, accessed February 19, 2021,
 https://www.ons.gov.uk/methodology/methodologytopicsandstatisticalconcepts/guidetoexperimentalstatistics.
22 “Employment in the UK: February 2021,” Office for National Statistics, accessed February 19, 2021,
 https://www.ons.gov.uk/employmentandlabourmarket/peopleinwork/employmentandemployeetypes/bulletins
 /employmentintheuk/latest.
23 “Concept: Factor Analysis,” University of Manitoba, October 19, 2016, http://mchp-
 appserv.cpe.umanitoba.ca/viewConcept.php?printer=Y&conceptID=1485.

References
FCA (Financial Conduct Authority). 2021. Financial Lives 2020 Survey: The Impact of Coronavirus. London: FCA.
Francis-Devine, Brigid. 2020. “Poverty in the UK: Statistics.” Briefing paper 7096. London: House of Commons
 Library.
Legatum Institute. 2020. Poverty during the COVID-19 Crisis. London: Legatum Institute.
McKernan, Signe-Mary, Caroline Ratcliffe, Breno Braga, and Emma Cancian Kalish. 2016. “Thriving Residents,
 Thriving Cities: Family Financial Security Matters for Cities.” Washington, DC: Urban Institute.

About the Authors
Breno Braga is a labor economist and principal research associate in the Center on Labor, Human
Services, and Population at the Urban Institute. His research has covered topics such as the effects of
high-skilled immigration on labor markets, the role of local conditions in asset accumulation, and the
local factors associated with debt in collections. His articles have been published in academic journals
including the Journal of Labor Economics. Braga received his MA in economics from the Pontifical
Catholic University of Rio de Janeiro and his PhD in economics from the University of Michigan.

 16 FINANCIAL VULNERABILITY IN THE UK: FROM BREXIT T O THE COVID-19 PANDEMIC
Signe-Mary McKernan, a wealth-building expert, is vice president for Labor, Human Services, and
Population and director of the Opportunity and Ownership initiative at the Urban Institute. She has two
decades of experience researching access to assets and credit and the impact of safety net programs.
She coedited Asset Building and Low-Income Families, coauthored a chapter in the Oxford Handbook of the
Economics of Poverty, and advised the US Consumer Financial Protection Bureau in setting up its
research unit. Her research has been published in books, policy briefs, reports, and refereed journals,
including the American Economic Review Papers and Proceedings, Demography, and Review of Economics
and Statistics. She has testified before Congress, appeared on NBC4 and Al Jazeera, and been cited in
the New York Times, Washington Post, Forbes, and Time. She has a PhD in economics from Brown
University.

William J. Congdon is a principal research associate in the Center on Labor, Human Services, and
Population at the Urban Institute. His research focuses on issues in labor market policy and social
insurance, and his recent work emphasizes the perspective of behavioral economics and the role of
experimental methods for understanding economic outcomes and developing public policy.

Elizabeth Mandiville is a senior statistical analyst at Lowell where she is responsible for developing and
implementing predictive models to enhance operational performance, accurately value assets, and
better understand consumer payment behavior. Mandiville graduated with a BSc (first class honours) in
mathematics and statistics and is currently completing an MSc in data science and analytics.

Mark Hayward is Lowell’s UK head of data strategy. His work is focused on maximizing the use of
commercial data to improve business performance and customer experience (especially for statistical
modeling and operational process improvement), identifying new data sources, and safeguarding data
quality. Hayward has 18 years’ experience within financial services and debt collection and has led
teams in credit risk, predictive modeling, and operations. Hayward holds a BSc in mathematics,
statistics, and computing.

Christopher Trepel is chief data scientist and strategic advisor at Lowell and leads the company’s
European Consumer Research Laboratory dedicated to understanding financial decision making,
especially within low- and moderate-income and subprime credit score populations. Formerly Lowell’s
group chief science officer, he led the multidisciplinary decision science department responsible for asset
valuation, statistical modeling, and consumer science R&D and was executive director of Lowell Labs
Amsterdam, an analytics center of excellence focused on advanced statistics and machine learning
methods. Trepel is also an operating partner at Fenway Summer Ventures, contributing technical
expertise in the areas of analytics, credit, data science, and consumer behavior. Previously, he held
leadership roles at Encore Capital Group, Wells Fargo Bank, and McKinsey and Company. Trepel earned a
PhD in experimental psychology (neuroscience), is a fellow of the British Psychological Society, and is lead
or coauthor of more than 70 academic and professional publications across five research areas.

 FINANCIAL VULNERABILITY IN THE UK: FROM BREXIT T O THE COVID-19 PANDEMIC 17
Acknowledgments
This brief is a joint project of the Urban Institute and Lowell. Urban and Lowell researchers are
collaborating on all stages of the research. In addition, Lowell provides funds and operational and
research data used to create the index. The Urban Institute is grateful to all its funders, who make it
possible for Urban to advance its mission.

 The views expressed are those of the authors and should not be attributed to the Urban Institute,
its trustees, or its funders. Funders do not determine research findings or the insights and
recommendations of our experts. Further information on the Urban Institute’s funding principles is
available at urban.org/fundingprinciples.

 At the Urban Institute, we thank Caleb Quakenbush for managing this complicated project,
Kassandra Martinchek and Alex Carther for excellent assistance with processing and analyzing publicly
available data, Cary Lou for code checking, Doug Wissoker for technical review, and Liza Hagerman for
an excellent edit. We also thank seminar participants and reviewers from the Urban Institute, Lowell,
and the Financial Conduct Authority for their helpful comments.

 18 FINANCIAL VULNERABILITY IN THE UK: FROM BREXIT T O THE COVID-19 PANDEMIC
You can also read