Flood and drought risk assessment for agricultural areas (Tagus Estuary, Portugal)
←
→
Page content transcription
If your browser does not render page correctly, please read the page content below
Nat. Hazards Earth Syst. Sci., 21, 2503–2521, 2021
https://doi.org/10.5194/nhess-21-2503-2021
© Author(s) 2021. This work is distributed under
the Creative Commons Attribution 4.0 License.

Flood and drought risk assessment for agricultural
areas (Tagus Estuary, Portugal)
Paula Freire1 , Marta Rodrigues1 , André B. Fortunato1 , and Alberto Freitas2
1 Laboratório   Nacional de Engenharia Civil, Lisboa, 1700-066, Portugal
2 Direção-Geral   de Agricultura e Desenvolvimento Rural, Lisboa, 1949-002, Portugal

Correspondence: Paula Freire (pfreire@lnec.pt)

Received: 22 December 2020 – Discussion started: 5 February 2021
Revised: 25 June 2021 – Accepted: 14 July 2021 – Published: 23 August 2021

Abstract. Estuaries are coastal systems particularly vulner-       southern European countries (Calzadilla et al., 2013; IPCC,
able to climate change. Within these systems, agriculture          2014; Kovats et al., 2014; European Environment Agency,
is one of the most potentially affected sectors. This pa-          2019). In coastal areas, agriculture is experiencing negative
per proposes a risk assessment approach for helping the            impacts mostly associated with the increase in submersion
decision-making process at a local level, addressing two risks     frequency by salt water (IPCC, 2014). Under the influence
that affect agricultural areas located in estuarine margins:       of both marine and freshwater environments, estuaries are
the unavailability of freshwater for irrigation resulting from     particularly affected by changes in climate through mean sea
the upstream propagation of estuarine brackish water dur-          level (MSL) rise, increasing storminess, global warming and
ing droughts and land inundation by high water levels as-          dwindling precipitation (Wong et al., 2014). The develop-
sociated with high tides and storm surges. For each risk,          ment of mitigation and adaptation measures to reduce the im-
quantitative consequence descriptors are proposed to support       pacts of climate change on the agricultural sector is one of the
risk level determination and evaluation through a continuous       EU Common Agricultural Policy priorities (European Union,
consequence–probability diagram. The approach applicabil-          2019). Risk management approaches are increasingly used
ity is discussed through its application to the Lezíria Grande     to help stakeholders in decision-making (Plate, 2002; Ale
de Vila Franca de Xira, located in the Tagus Estuary (Por-         et al., 2015; Aven, 2016). Risk management aims at antici-
tugal). Results indicate that the approach is appropriate to       pating and preventing or mitigating harm that can be avoided
support risk owners in taking actions to mitigate the risk. Ex-    by ensuring that significant risks are identified and reduced
amples of risk control measures for the risks addressed are        through appropriate measures (Simonovic, 2012). The risk
presented. The main strengths of the proposed approach are         management process should incorporate evidence-based in-
its flexibility to be adapted to local conditions and updated      formation in supporting the definition of mitigation and adap-
through time, as well as the ease of its application by the risk   tation measures (ISO, 2009c). UNISDR (2017) argues that an
owner.                                                             effective risk management should be based on an understand-
                                                                   ing of risk from all sources and of the links between haz-
                                                                   ards and vulnerabilities. Recognizing the complexity of the
                                                                   risk management process, different national and international
1   Introduction                                                   guidelines have been produced (e.g. AS/NZS, 2004; IRM,
                                                                   2002). Among them, the ISO 31000 (ISO, 2009a) provides
Agriculture is one of the economic sectors most vulnerable to      generic guidance for the adoption of a consistent process
climate change effects (Gornall et al., 2010; Burke and Em-        to ensure effective risk management. This standard presents
erick, 2016; Thornton et al., 2018). Extreme weather events,       a comprehensive framework which structures the risk man-
such as floods and droughts, coupled with changing rainfall        agement process through five main steps: establishing the
patterns, increasing temperatures and rising water demand          context, risk assessment, risk treatment, communication, and
can reduce crop productivity, as already observed in some

Published by Copernicus Publications on behalf of the European Geosciences Union.
2504                  P. Freire et al.: Flood and drought risk assessment for agricultural areas (Tagus Estuary, Portugal)

monitoring and review. Risk assessment outcomes support             crop irrigation and presenting low topography. These hazards
the design of risk mitigation measures, their implementation        are (i) water salinity increase due to droughts and (ii) estuar-
and their effectiveness assessment. While this framework is         ine high water levels that can promote inland inundation. In
useful to guide the applications throughout the risk manage-        order to support stakeholders and decision-makers in the def-
ment process, it remains very generic. Hence, its operational       inition of mitigation and adaptation strategies, the approach
implementation needs to be detailed for each specific appli-        should be easy to perceive by the stakeholders and suitable
cation. A wide range of approaches for assessing risk have          to be updated according to local conditions. The approach is
been developed, including qualitative, semi-quantitative and        summarized in Fig. 1 and is based on the generic risk man-
quantitative techniques (ISO, 2009c; Marhavilas et al., 2011;       agement framework of ISO 3100 (ISO, 2009a). The defini-
Sun et al., 2020). Chemweno et al. (2018) discuss the ex-           tions used herein are adapted from ISO (2009b).
tent of application of several approaches dependent on failure         The risk assessment has to be preceded by the establish-
dependencies and on the uncertainty often associated with           ment of the risk context, which defines the risk management
the lack of reliability data. A comparative review of risk as-      objectives, the consequence descriptors and the criteria to
sessment and management methodologies addressing hydro-             grade consequences, likelihood and risk (ISO, 2009c). The
meteorological natural hazards emphasizes the wide range            risk context depends on the site-specific characteristics and
of approaches followed, as well as their development level          must be supported by historical information and stakehold-
and complexity, mostly depending on the location and tar-           ers’ and the risk owners’ judgement. The risk owner is the
get subjects (Cirela et al., 2014). Nevertheless, approaches        person or entity responsible for the risk management (ISO,
addressing challenges that climate change will bring to the         2009b).
agricultural areas located in estuarine margins and suitable           As discussed above, several approaches are available to
to support local decision-makers to manage risk remain to be        operationalize risk analysis and evaluation. Risk matrices,
developed. Agricultural estuarine areas without water storage       combining qualitative or semi-quantitative information on
capacity and located in low-elevation terrains are particularly     consequence and probability, are used in several risk man-
vulnerable to changes in water availability for irrigation and      agement standards and guidelines to rank and prioritize risk
inland inundation.                                                  (ISO, 2009c). Despite several disadvantages pointed out in
   The present study aims at developing a risk assessment ap-       the literature (e.g. Cox, 2008; Duijm, 2015), risk matrices are
proach considering two natural risks that affect agricultural       widely used in risk acceptance discussion and risk communi-
estuarine lowlands: the scarcity of freshwater for irrigation       cation to broader audiences, supporting decision-making, as
and the marine submersion. Both phenomena are not new,              they present complex concepts in a simple way (Woodruff,
but they are exacerbated by climate change through more             2005; Ale et al., 2015). As an adequate tool to deal with
frequent and intense droughts, increasing storminess, and sea       risk level uncertainty, in both consequence and expected fre-
level rise. The new approach is applied to an agricultural area     quency, a continuous consequence–probability diagram is
(Lezíria Grande Public Irritation Perimeter) located in the         chosen in the present study as the suitable technique to as-
Tagus Estuary (Portugal). The approach addresses two main           sess risk.
challenges: (1) to assess two risks that affect estuarine agri-        The consequence is defined as an event outcome that af-
cultural areas with different temporal scales of consequences       fects the risk management objectives (ISO, 2009b). The pro-
(the scarcity of freshwater for irrigation and estuarine inun-      posed approach defines quantitative consequence descriptors
dation of agricultural terrains); and (2) to consider hazard un-    of the two hazards through indicators of the potential eco-
certainty in the risk evaluation. The final goal is to contribute   nomic impact on the risk owner.
with a tool that can support the decision-making process at a          For the water salinity increase during droughts, the conse-
local level in order to manage risk.                                quence descriptor was defined as the water unavailability for
   The paper is structured in five sections besides this in-        irrigation during the most critical period for the crops to be
troduction. Section 2 presents the risk assessment approach         watered. The water unavailability for irrigation (Wu) is given
proposed, and Sect. 3 characterizes the study area where the        by Eq. (1):
approach is applied. Results of the approach application are
                                                                                   volume of water available with salinity < 1 psu
described in Sect. 4 (Risk context) and Sect. 5 (Risk assess-       Wu = 1 −                                                         . (1)
                                                                                             volume of water needed
ment). Results are discussed and the main conclusions sum-
marized in Sect. 6.                                                    Concerning estuarine high water level, several elements
                                                                    are exposed to hazards such as the land, people or infras-
                                                                    tructures, including dykes that prevent lowland inundation
2   Risk assessment approach                                        during high spring tides. When dykes are present, inundation
                                                                    normally occurs when the water level is above the dyke crest
A risk assessment approach is developed to address two nat-         or when the dyke is breached. This exposed element can pro-
ural hazards that often affect agricultural areas located near      vide a direct quantification of the hazard economic impact
estuaries, particularly those dependent on surface water for        on the risk owner. Thus, the high water level consequence is

Nat. Hazards Earth Syst. Sci., 21, 2503–2521, 2021                                     https://doi.org/10.5194/nhess-21-2503-2021
P. Freire et al.: Flood and drought risk assessment for agricultural areas (Tagus Estuary, Portugal)                                  2505

Figure 1. Risk assessment approach followed in the present study.

based on the dyke overflowing, and the chosen descriptor is                  the defined scenarios, and risk levels are determined, com-
the relative cost of dyke damage repair, considering that the                pared and evaluated against risk criteria and tolerance limits
risk owner is the organization responsible for repairing the                 previously defined. Results provide scientifically supported
dykes. The relative cost of dyke damage (RCDD) is given by                   information to help stakeholders and risk owners to discuss
Eq. (2):                                                                     the acceptability of the risk magnitude. The consequence de-
         length of the affected dyke × repair cost per unit length           scriptors can be evaluated through the analysis of model re-
RCDD =                                                             .   (2)   sults and historical and monitoring data.
                         risk owner annual income
   Criteria to grade the consequence severity should rely on
past event information from the area where this approach is
applied with the stakeholder’s involvement. The same must                    3     Study area
be followed when selecting classes of likelihood, defined as
the chance of something happening, and can be presented as                   3.1    The Tagus Estuary
a probability of an event.
   In the present approach, the definition of risk levels con-               The Tagus Estuary, located at the mouth of the Tagus River
siders the ISO (2009b) criteria and the tolerable risk con-                  basin (Fig. 2a), is framed by the largest metropolitan area of
cept that is normally used to assist decision-makers (Marszal,               Portugal, hosting along its margins 1.6 million inhabitants
2001). Tolerable risk was defined by ICOLD (International                    (Tavares et al., 2015). With a surface area of about 32 000 ha,
Commission on Large Dams) in 2002 as “a risk within a                        the estuary presents a marked contrast of occupation between
range that society can live with so as to secure certain net                 both margins: extensive artificial areas are present along the
benefits”. It is a range of risk that cannot be neglected or                 northern margin and agricultural and semi-natural areas in-
ignored and should rather be kept under surveillance and re-                 cluding a nature reserve (one of the most important sanctu-
duced if possible (Bowles, 2003). Below tolerable risk, the                  aries for birds in Europe with a size of about 14 000 ha) in
risk is acceptable, i.e. risk is considered insignificant or ad-             the eastern area. Agriculture is the most relevant economic
equately controlled, and above risk is unacceptable (HSE,                    activity in the Tagus Estuary upper region, in particular irri-
2001). For the hazards considered, risk is divided in three                  gated agriculture. Two different types of water resource man-
levels in the consequence–probability diagram correspond-                    agement are present: the collective management existing in
ing to different bands: (a) high risk (red band), in which the               the irrigation perimeters of a state and/or public initiative,
level of risk is considered intolerable and risk treatment is                either through distribution from reservoirs (Vale do Sorraia)
essential whatever its cost; (b) medium risk (yellow band),                  or through direct extraction from the Tagus River (Lezíria
in which the risk is considered tolerable; (c) low risk (green               Grande de Vila Franca de Xira), and individual management
band), in which the level of risk is considered negligible, so               carried out by farmers outside these perimeters.
no risk treatment measures are needed. Risk tolerance limits                    The main source of freshwater discharging into the estu-
depend on the study area characteristics and should be de-                   ary is the Tagus River, with average, maximum and mini-
fined based on information from past events and risk owner’s                 mum annual flows of 336, 828 and 102 m3 s−1 , respectively
judgement.                                                                   (APA, 2012). The Sorraia and the Trancão rivers also con-
   After establishing the risk context for the area where the                tribute to the freshwater inflow into the estuary. The Tagus
approach is applied, hazard scenarios based on historical data               is the longest river of the Iberian Peninsula with a water-
and stakeholder’s information have to be defined to support                  shed of 80 100 km2 distributed between Portugal (30 %) and
risk assessment. Consequence descriptors are evaluated for                   Spain (70 %). The hydrological regime has been highly mod-

https://doi.org/10.5194/nhess-21-2503-2021                                           Nat. Hazards Earth Syst. Sci., 21, 2503–2521, 2021
2506                   P. Freire et al.: Flood and drought risk assessment for agricultural areas (Tagus Estuary, Portugal)

Figure 2. Location and place names of the study area: bathymetry of the Tagus Estuary and location of the Tagus watershed in the Iberian
Peninsula (inset) (left panel); irrigation network in the Lezíria Grande Public Irrigation Perimeter (right panel) (ESRI Basemap).

ified by several reservoirs constructed since the 1950s in both       reaching the estuary and consequently increase the saltwater
countries along the Tagus River and its tributaries. Although         intrusion, as observed in 2005 and 2012 (Rodrigues et al.,
a convention was signed between the two countries in 2001             2019). The vulnerability of the water for human consump-
to agree on annual water releases in the Tagus River at the           tion, in terms of quantity and quality, was assessed for the
international border, particularly during droughts, these re-         EPAL (public water supply company) water intake located
leases are irregular and difficult to account for (Henriques,         in the Tagus Estuary upper sector (Valada do Tejo) for dif-
2018). Therefore, the water availability downstream strongly          ferent climatic scenarios (Rodrigues et al., 2012). Both the
depends on the water resource management practices in the             results of that study and those of Rodrigues et al. (2019) sug-
basin.                                                                gest that only very low river flows would lead to a signifi-
   The hydrodynamics of the Tagus Estuary is primarily                cant increase in the salinity in the area. Historical data show
driven by tides. The tidal range varies between 0.55 and              that the Tagus estuarine margins are also vulnerable to floods
3.86 m at the coast (Guerreiro et al., 2015), and it increases        from two different origins that can widely affect the agricul-
inside the estuary due to resonance (Fortunato et al., 1999).         tural lands due to their low elevation (Freire et al., 2016; Rilo
During extreme conditions, other forcings may also be im-             et al., 2017): extreme water discharges in the Tagus and Sor-
portant. High river flows can increase water levels in the            raia rivers (riverine flood), and strong winds and low atmo-
riverine stretch of the estuary (Vargas et al., 2008) and stratify    spheric pressure conditions combined with high spring tides
the water column (Rodrigues and Fortunato, 2017). During              (Fortunato et al., 2017).
storms, wind, atmospheric pressure and surface waves can
also increase the water levels significantly (Fortunato et al.,       3.2   Lezíria Grande Public Irritation Perimeter
2017).
   The upper part of the estuary is affected by natural hazards       The Lezíria Grande de Vila Franca de Xira Public Irrigation
with different meteorological and oceanographic origins, of-          Perimeter (Lezíria Grande) is an important economic agri-
ten with relevant socio-economic impacts. Droughts can re-            cultural area located on the Tagus estuarine eastern margin,
sult from extremely dry periods aggravated by the impact of           about 40 km from the estuarine mouth (Fig. 2b). This very
the water management practices on the Tagus River basin.              productive area with 13 420 ha of alluvial soils of both fluvial
These water scarcity events significantly reduce the river flow       and estuarine origins belongs to the metropolitan area of Lis-
                                                                      bon and is part of the municipalities of Vila Franca de Xira

Nat. Hazards Earth Syst. Sci., 21, 2503–2521, 2021                                    https://doi.org/10.5194/nhess-21-2503-2021
P. Freire et al.: Flood and drought risk assessment for agricultural areas (Tagus Estuary, Portugal)                       2507

and Azambuja. The Lezíria Grande occupies low-elevation           About 2000 people were reported to have been affected due
terrains between mean sea level (MSL) and 2 m a.m.s.l.            to dyke failures in the surrounding area (Loureiro, 2009).
(above mean sea level), reclaimed from the estuarine bed             Estuarine high water levels caused by spring tides and se-
and protected from flooding by a 62 km long system of dykes       vere storm surges can also overflow and damage the Lezíria
along the margins of the Tagus, Sorraia and Risco rivers. The     Grande dykes, promoting extensive inland inundation. The
dykes are made of soil covered by vegetation, and in some         most dramatic estuarine flood event that affected this area,
places their outer flanks are protected with riprap. Available    destroying all the channels and dykes, occurred on 15 Febru-
topographic data indicate that the dykes’ crests reach heights    ary 1941 (Madaleno, 2006). This event affected several loca-
between 2.4 and 7.2 m a.m.s.l. The southern area of the           tions along the Portuguese coast with devastating human and
Lezíria is part of the Tagus Estuary Natural Reserve. The         physical impacts (Muir-Wood, 2011; Freitas and Dias, 2013)
Lezíria Grande has a relevant impact on the local and             and is considered the major calamity that affected the Iberian
regional economies, with an annual investment in crops            Peninsula in the last 200 years. Besides the severe damage to
of about EUR 40 million and involving about 6000 direct           infrastructures, the impacts in the upper estuary include hu-
jobs (https://www.publico.pt/2005/08/26/jornal/fecho-do-          man losses and drowned cattle (Muir-Wood, 2011). The most
rio-sorraia-salva-culturas-da-leziria-grande-de-vila-franca-      recent estuarine flood event that affected the Lezíria Grande
36092, last access: May 2020) during the spring–summer            occurred on 27 February 2010 resulting from the passage of
agricultural season and some additional indirect jobs related     the storm Xynthia in the Portuguese territory (André et al.,
to services and equipment. The main crops are rice, culti-        2013; Fortunato et al., 2017). The dykes in the southern area
vated in the downstream area due to its higher tolerance to       of the Lezíria Grande were overflowed and damaged and the
salty water, tomato and corn, which jointly represented 91 %      farmland flooded. As the event occurred outside of the active
of the cultivated area in 2017.                                   farm season, witnesses report that only up to five families and
   The Lezíria Grande presents a complex irrigation and           some cattle had to be evacuated. After the event the dykes
drainage system network of channels 720 km long that are          were repaired and elevated in some places.
connected to the adjacent rivers (Tagus, Sorraia and Risco)
by water intakes and drainage gates. The main water in-
take that supplies the freshwater for the farmland irrigation     4     Risk context
is located in the Tagus River, at Conchoso, and includes a
pumping station (Fig. 2b). The total irrigated area is about      4.1    Risk management objectives
10 000 ha, 60 % of which is irrigated by surface irrigation and
40 % under pressure.                                              The Associação de Beneficiários da Lezíria Grande de Vila
   As the Conchoso water intake is located close to the up-       Franca de Xira (ABLGVFX), a collective organization re-
stream limit of the salinity propagation, the availability of     sponsible for the management of public infrastructures, un-
water with quality for irrigation strongly depends on the         der the supervision of the General Directorate-General for
freshwater input from the Tagus River into the estuary. Be-       Agriculture and Rural Development (DGADR), acted as risk
cause the effect of droughts in the freshwater input usually      owner as they are the most representative stakeholder. The
starts in July, the critical month for irrigation, crops can be   overall risk management objective of the Lezíria Grande is
lost with relevant economical losses. During the most recent      the management and exploitation of a public irrigation in-
severe droughts, in 2005 and 2012, several emergency mea-         frastructure during extreme weather conditions. These con-
sures were undertaken in the Lezíria Grande to minimize the       ditions can be aggravated by climate change effects, namely
negative impacts, such as the water supply being exclusively      more extreme droughts and floods. For the present applica-
from the Risco River water intake and the construction of a       tion and considering the saltwater intrusion hazard, the risk
temporary weir at the Sorraia River. The installation of the      management objective is to ensure water with good quality at
pumping system at the Conchoso water intake, allowing the         the Conchoso intake, i.e. water with salinity below 1 psu, dur-
extraction of water from the Tagus River during low tide, and     ing the agricultural irrigation campaigns. Despite the natural
the construction of a removable weir in the Risco River are       conditions that contribute to the droughts, the water resource
recent improvements to increase the resilience to droughts.       management practices at regional and local levels affect this
   Due to its low-elevation terrains, the Lezíria Grande is       objective. At the regional level, the volumes discharged from
vulnerable to flooding episodes of both riverine and estuar-      Spain during exceptional meteorological conditions and the
ine origins. High water discharges of the Tagus and Sorraia       Energias de Portugal (EDP) hydropower production regime
rivers can promote dyke breaching and extensive agricultural      are the main conditioning factors for the water availability
land inundation as occurred in February 1979 (Rebelo et al.,      downstream. The adaptive capacities of the farmers, such
2018). During this event, the Lezíria Grande dyke was rup-        as improving the adequacy and efficiency of the irrigation
tured both in the north and south sides, resulting in either      practices, changing the type of cultures, and increasing emer-
displaced or evacuated people and relevant economic losses.       gency planning and response capability, are examples of lo-
                                                                  cal water resource management factors. Concerning the high

https://doi.org/10.5194/nhess-21-2503-2021                                Nat. Hazards Earth Syst. Sci., 21, 2503–2521, 2021
2508 P. Freire et al.: Flood and drought risk assessment for agricultural areas (Tagus Estuary, Portugal)
water level hazard, during estuarine floods, the specific risk Table 1. Grade of consequences for water salinity and water level.
management objective considered is to avoid the dykes being
overflowed and damage, preventing inland inundation. Due Severity Unavailable Relative
to the Lezíria Grande’s low topography, the dyke integrity water for cost of
is crucial to protect the farmland and support facilities and irrigation dyke
infrastructures from being inundated and damaged not only damage
during extreme events but also daily during high tide. This Low – L ≤ 0.05 ≤ 0.01
objective can be reached by flood adaptation measures, in- Medium – M 0.05–0.25 0.01–0.1
cluding raising the dykes’ height, as decided after the 2010 High – H 0.25–0.5 0.1–0.3
flood event, increasing the area of salt-tolerant crops, and in- Very high – VH > 0.5 > 0.3
creasing emergency planning and response capability.
4.2 Consequence and likelihood criteria Table 2. Criteria for the likelihood.
Likelihood Probability of Return
For the water salinity at Conchoso during droughts, which
occurrence per period
results from the upstream saltwater propagation, the conse-
year (year)
quence is evaluated using the consequence descriptor pre-
sented in Eq. (1), considering the water unavailability for ir- Very low – VL 0–0.01 > 100
rigation during the month of July as it is the most critical Low – L 0.01–0.1 10–100
for irrigation. Water unavailability is computed on a weekly Medium low – ML 0.1–0.2 5–10
Medium – M 0.2–0.5 2–5
basis, and the minimum weekly water need is considered as
High – H 0.5–1 1–2
1029 × 103 m3 , which corresponds to the worst case scenario
based on historical needs (Aqualogus and Campo d’Água,
2016a). The usable volume of water is estimated by multi-
plying the time during which water with salinity below 1 psu income is averaged over 2014–2018 to reduce the sensitiv-
is available at the Conchoso intake per week by the maximum ity to inter-annual variations. All values were provided by
pumping capacity at the Conchoso station. The Conchoso the ABLGVFX and updated to 2019. The criterion to grade
pumping rate capacity considered was 4.5 m3 s−1 , which cor- the consequences affecting the risk management objective is
responds to the pumping rate capacity with low water level to avoid the dykes being overflowed and damaged. This cri-
(Aqualogus and Campo d’Água, 2016b). This criterion is jus- terion was defined based on the impact of the dyke repair
tified by the absence of reservoirs in the Lezíria, and it is cost on the risk owner’s annual income (Table 1). Severity
assumed that the water is used as soon as it is abstracted. is considered low when the dyke repair cost is less than 1 %
The severity grade criteria of this consequence were defined of the annual income, which corresponds to twice the dyke’s
based on the past occurrences and their consequences (Ta- annual maintenance cost. Considering that the impact of the
ble 1). February 2010 storm event, which was about 4 % of the an-
During the most recent droughts, the consequences were nual income, has a medium-low severity, the upper limit of
more severe in 2005 than in 2012 as less water was available. this class is defined as 10 %. Very high severity consequence
In 2005, freshwater was unavailable at the Conchoso water is considered when the dyke repair cost exceeds 30 % of the
intake from mid-July onwards. The water was therefore sup- annual income. The likelihood criteria for both hazards are
plied to the Lezíria exclusively from the Risco River water presented in Table 2.
intake, and the consequences were very severe with signifi-
cant losses of crops (Rodrigues et al., 2016). Thus, severity is 4.3 Risk criteria
considered low when less than 1 % of the water needed is un-
available for irrigation, leading to negligible losses of crops. For the water salinity, risk tolerance limits are defined based
The severity is considered medium when 1 %–25 % of water on the water availability and the possibility to fulfil the needs
is unavailable, while high severity corresponds to 25 %–50 % from alternative water sources (Table 3). Risk is consid-
of water being unavailable for irrigation. Very high sever- ered low when the water available at the Conchoso water
ity corresponds to over 50 % of the water being unavailable, intake is sufficient to meet the irrigation needs. Thus, the
which can lead to very significant losses of crops and, conse- criterion followed to define the upper limit of the low risk
quently, economical losses. is that the water unavailable for irrigation is less than 1 %
For the high water level, the consequence is evaluated for high likelihood events (i.e. events with a return period
based on the descriptor presented in Eq. (2), in which the RP = 1 year). Medium risk level, which corresponds to the
repair cost per unit length is estimated based on the values of tolerable risk, corresponds to events during which the water
the dyke repair cost and affected length during the event of available at Conchoso cannot meet the irrigation demands,
February 2010 described in Sect. 2. The ABLGVFX annual but the Risco River can be used as an alternative source to
Nat. Hazards Earth Syst. Sci., 21, 2503–2521, 2021 https://doi.org/10.5194/nhess-21-2503-2021P. Freire et al.: Flood and drought risk assessment for agricultural areas (Tagus Estuary, Portugal) 2509
Table 3. Risk level criteria for water salinity. Colour code refers to Fig. 4.
Risk level/colour code Risk criteria
Low/green Water available in Conchoso is sufficient for the irrigation needs.
Medium/yellow Water available in Conchoso is not sufficient for the irrigation needs, and the water from the Risco River is used as an alternative source.
High/red Water available in Conchoso and Risco River is not sufficient for the irrigation needs.
Table 4. Risk level criteria for high water level. Colour code refers to Fig. 6. RP signifies return period.
Risk level/colour code Upper limit criteria Criteria
Likelihood Consequence
(RP in years) (dyke repair
cost/risk
owner’s
annual
income)
Low/green RP = 1 0.005 Dyke repair cost impact on risk owner’s annual income is
negligible.
RP = 10 0.01
Medium/yellow RP = 1 0.04 Dyke repair cost impact on risk owner’s annual income is
tolerable.
RP = 100 0.16
High/red Dyke repair cost impact on risk owner’s annual income is
unacceptable.
fulfil the needs. The upper and lower limits of the tolerable to the annual income. Thus, the upper limit of the low risk
risk band were defined based on estimates of the minimum band is defined as follows: the cost of the dyke repair does
and maximum volumes of water available in the Risco River. not exceed the dyke’s annual maintenance cost, which rep-
The minimum volume of water available in the Risco River resents about 0.5 % of the annual income for high likelihood
was defined based on Rodrigues et al. (2019), which esti- events with RP = 1 year and double for events with low to
mates that the volume of water available in the Risco River medium-low likelihood (RP = 10 years) (Table 4). Medium
ranges from 1–4 × 10⁶ m3 . Considering that the Risco River risk level corresponds to the tolerable risk, i.e. the impact of
should provide an alternative water source during 1 month, the dyke damage repair cost on the annual income is tolera-
the minimum weekly volume available in the Risco River is ble for the risk owner. The lower limit of the tolerable risk
0.25 × 10⁶ m3 , which corresponds to 24 % of the total water band corresponds to the upper limit of the low risk. The up-
needs for irrigation per week. The maximum water volume per limit of the tolerable risk is defined by considering that
available is determined by the water abstraction capacity. the dyke repair cost should not endanger the financial viabil-
The average abstraction capacity was taken as 0.97 m3 s−1 ity of the risk owner. The impact of the February 2010 event,
(Aqualogus and Campo d’Água, 2016a), which corresponds already presented, is used to help define this limit: for high
to a weekly volume of 584 558 m3 (57 % of the irrigation likelihood events (RP = 1 year), the risk is considered tol-
needs). Thus, the risk is considered tolerable if the water un- erable if the repair cost does not exceed 4 % of the annual
available in Conchoso is less than 24 % (for high likelihood income, and 4 times more in the case of events with low to
events, i.e. RP = 1 year) or 57 % (for low likelihood events, very low likelihood (RP = 100 years) (Table 4). Above the
i.e. RP = 100 years). The risk is considered high when the tolerable risk upper limit, risk is considered high and unac-
water available from both Conchoso and the Risco River is ceptable, and in this case risk treatment is required whatever
insufficient to fulfil the irrigation needs and risk treatment is its cost to reduce the risk level.
required.
For the high water level, risk tolerance limits are defined
based on the potential impact of the dyke damage cost on the
risk owner’s annual profit, measured by the ratio between the
repair cost and the risk owner’s annual income. Risk is con-
sidered low when the damage repair cost is negligible relative
https://doi.org/10.5194/nhess-21-2503-2021 Nat. Hazards Earth Syst. Sci., 21, 2503–2521, 20212510 P. Freire et al.: Flood and drought risk assessment for agricultural areas (Tagus Estuary, Portugal)
Figure 3. Consequence–probability diagrams for water unavailability for irrigation during weeks 1 to 4. The river flow is constant during
all weeks. The river flows considered in each scenario are as follows: SD1 – 132 m3 s−1 ; SD2 – 44 m3 s−1 ; SD3 – 22 m3 s−1 ; SD4 –
16.5 m3 s−1 ; SD5 – 8 m3 s−1 ; SD6 – 22 m3 s−1 and mean sea level rise of 0.5 m. Error bars represent the uncertainty in the likelihood and in
the consequence.
5 Risk assessment events and on probability estimates, and it follows the criteria
already presented in Table 2. Further discussions about the
5.1 Water salinity scenarios can be found in Rodrigues et al. (2019). The quan-
titative consequence descriptor defined previously is assessed
As stated above, the salinity at the Conchoso intake de- for the different scenarios through numerical modelling. Nu-
pends mostly on the Tagus River discharge and on the wa- merical models implemented and validated for the study area
ter management practices in the Tagus watershed. The size are described in Appendix A.
and strong artificialization of the watershed, shared between Figure 3 presents the different scenarios projected in the
two countries, make the hydrologic modelling a complex and consequence–probability diagram for the water unavailabil-
time-consuming task far beyond the scope of this work. The ity; the horizontal and vertical bars represent the expected un-
capacity of flow regularization in the Spanish part of the certainty for consequence and likelihood, respectively. The
basin reduces the average flow at the Spanish–Portuguese uncertainty of the consequence was estimated considering
border by 27 % (Aus Der Beek et al., 2016). Therefore, haz- that the model overestimates the measured salinity by up to
ard scenarios were constructed based on available data and 2 psu. Hence, for each scenario the uncertainty was calcu-
on past event information. July is the critical month for crop lated assuming the maximum tolerable salinity in the water
irrigation, and the upper salinity limit for irrigation is 1 psu. for irrigation to be 3 psu (i.e. the maximum tolerable salin-
Considering these conditions and to provide a wide range of ity, taken as 1 psu, plus the maximum error). Consequence
events for the risk assessment, five scenarios of Tagus River is low for all the scenarios in the first week since the wa-
discharge were established (Table 5). A scenario combining ter available fulfils all the needs for irrigation. As time pro-
the worst recent drought (SD2) with the possible sea level gresses (and the river flow remains constant) the consequence
rise of 0.5 m was also considered. This value is representative increases for all the scenarios with the exception of sce-
of the prediction for the end of the 21st century considering nario SD1 (climatological, mean river flow of 132 m3 s−1 ),
the Representative Concentration Pathway (RCP) scenarios in which freshwater is always available for irrigation. For
RCP2.6 and RCP8.5 (Rodrigues et al., 2019). For all scenar- scenario SD2 (river flow of 44 m3 s−1 ) the consequence is
ios the likelihood was estimated based on relevant historical
Nat. Hazards Earth Syst. Sci., 21, 2503–2521, 2021 https://doi.org/10.5194/nhess-21-2503-2021P. Freire et al.: Flood and drought risk assessment for agricultural areas (Tagus Estuary, Portugal) 2511
Table 5. Scenarios for water salinity and corresponding likelihood considering the Tagus River flow (Q) and sea level rise (SLR) conditions.
Scenario Q (m3 s−1 ) Description Likelihood
SLR (m)
SD1 climatological 132 Mean daily discharge at the Almourol station (https://snirh.apambiente.pt/, Medium
scenario 0 last access: 17 August 2021) between 1990 and 2017 during the month of
July
SD2 44 River flow representative of one of the recent droughts that occurred in 2012, Medium low
recent drought 0 estimated based on data measured at Almourol (https://snirh.apambiente.pt/,
last access: 17 August 2021)
SD3 22 River flow representative of one of the worst recent droughts using data Low
worst recent drought 0 from Matrena and Tramagal stations (https://snirh.apambiente.pt/, last access:
17 August 2021) during July 2005
SD4 16.5 Minimum mean weekly river flow that must be guaranteed between 1 July and Very low
minimum river flow 0 30 September near the upstream boundary of the Tagus Estuary (Muge) by the
revised Spanish–Portuguese Albufeira Convention and Additional Protocol
(Portuguese Parliament Resolution no. 62/2008, 14 November)
SD5 8 Minimum river flow that guarantees the operation of the main thermoelectric Very low
worst case scenario 0 power plant in the Tagus River (Pego power plant)
SD6 22 Combination of the worst recent drought with a sea level rise of 0.5 m Low
sea level rise 0.5
moderate in week 3, and about 90 % of the water needed
for irrigation is available. In week 4 the water available for
irrigation decreases to about 20 % of the needs in this sce-
nario (Fig. 3). The consequences are also more severe when
the river flow is lower, as expected. For scenarios SD3 (river
flow of 22 m3 s−1 ), SD4 (river flow of 16.5 m3 s−1 ) and SD5
(river flow of 8 m3 s−1 ), freshwater is unavailable for irriga-
tion in week 3 (Fig. 3). However, the very low river flow
scenarios (SD4, SD5) have low likelihoods. The estimated
consequences for the scenarios agree with the observed oc-
currences during recent droughts (2005, 2012), as described
by the risk owner. During July and August of both 2012 and
2005, droughts represented by scenarios SD2 and SD3, re-
Figure 4. Risk for water unavailability. Colours of the sym-
spectively, salinity reached concentrations at the Conchoso bols represent the weeks (darker to lighter means week 1 to
water intake that were inadequate for irrigation. In 2012, week 4). The river flows considered in each scenario are as follows:
in particular, water with salinity of about 1.1–1.2 was used SD1 – 132 m3 s−1 ; SD2 – 44 m3 s−1 ; SD3 – 22 m3 s−1 ; SD4 –
for irrigation, which reduced the production. However, the 16.5 m3 s−1 ; SD5 – 8 m3 s−1 ; SD6 – 22 m3 s−1 and mean sea level
adverse impacts of the 2005 drought were more severe for rise of 0.5 m. The following events are not represented in the risk
the farmers in the Lezíria since the drought itself was more diagram because all the water needed for irrigation is available and
severe and the ABLGVFX had fewer resources and was the consequence is 0: scenario SD1 – all weeks; scenario SD2 –
less prepared to deal with these events. More severe con- weeks 1 and 2; scenarios SD3, SD4, SD5 and SD6 – week 1.
sequences are also estimated for scenario SD3 comparable
to scenario SD2 (Fig. 3). The comparison between scenar-
ios SD3 (river flow of 22 m3 s−1 ) and SD6 (river flow of is higher for low river flow scenarios. In some cases, conse-
22 m3 s−1 and mean sea level rise of 0.5 m) indicates that, quences can range from “very high” to “low”. However, this
for the same river flow, sea level rise increases the conse- larger variability is explained by the criterion used to define
quences (Fig.3). Since the consequence of all the scenarios the uncertainty (the maximum peak difference).
is estimated based on numerical simulations, there is an as- Regarding the risk diagram, results indicate that for all the
sociated uncertainty. Results suggest that the uncertainty as- scenarios with the exception of the climatological scenario
sociated with the numerical simulations on the consequence (SD1) the risk is intolerable in the last week (Fig. 4). Risk
https://doi.org/10.5194/nhess-21-2503-2021 Nat. Hazards Earth Syst. Sci., 21, 2503–2521, 20212512 P. Freire et al.: Flood and drought risk assessment for agricultural areas (Tagus Estuary, Portugal)
Table 6. Scenarios for maximum water levels considering different storm surge, tide and sea level rise (SLR) conditions. Wm is the maximum
water level at Cascais tide gauge, and Q is the Tagus River flow.
Scenario Wm Q Description Likelihood
(m, (m3 s−1 )
above
CD) SLR
(m)
SF1 Storm 2.24 3917 Storm surge and tide conditions observed during the Xynthia Medium low
Xynthia 2010 0 storm
SF2 2.34 4517 Storm surge and tide conditions observed during 1941 cyclone Low
1941 cyclone 0
SF3 2.54 4517 Storm surge conditions observed during 1941 cyclone and con- Very low
1941 cyclone and 0 sidering an equinoxial spring tide
spring tide
SF4 2.84 4517 Combination of the storm surge and tide conditions of 1941 Low
1941 cyclone and 0.5 cyclone with a possible sea level rise for the end of the century
sea level rise
also grows with the duration of the droughts: for instance, scenario for the end of the century used for the salinity was
for scenarios SD2 (river flow of 44 m3 s−1 ; return period of considered here (SF4), combined with the storm surge and
5–10 years) and SD3 (river flow of 22 m3 s−1 ; return period tide conditions of the 1941 cyclone (SF2). The scenarios
of 10–100 years) risk can be medium until the third and sec- were assessed through numerical models, implemented and
ond weeks, respectively, and intolerable if the drought lasts validated for the study area, described in Appendix A. The
for longer periods (Fig. 4). In these cases, when the river flow model estimates of the extent of the dyke being overflowed
remains low for several consecutive weeks, even using the entails uncertainties associated with several error sources.
Risco River as an alternative source of freshwater is not suf- The tidal levels predicted by the model have errors of the
ficient to meet the irrigation needs. For the remaining river order of 15 cm in the upper estuary, while errors associated
flow alone scenarios (scenarios SD4 and SD5) the risk is in- with the storm surge can reach about 10 cm (Fortunato et al.,
tolerable as early as the second week (Fig. 4); however the 2017). Topographic errors, in particular in the dykes’ crest
return period of these events is estimated to be longer than height, were taken as 10 cm. Taking the overall error as the
100 years, and their likelihood is, consequently, low. For square root of the sum of the squares of the individual errors
events similar to scenarios SD2 and SD3, risk treatment is leads to a vertical uncertainty of 20 cm. To determine the un-
mandatory to reduce risk level and may include the use of al- certainty in the estimate of the overflowed dyke length, we
ternative water sources, the selection of alternative crops, the considered that a difference of 50 cm in water level between
reduction of the irrigated area and/or the construction of wa- two simulations (scenarios S2 and S4 described below) leads
ter storage facilities. Mean sea level rise may constitute an to a discrepancy of 130 % in the overflowed extent of the
additional source of risk (scenario SD6, Fig. 4) and should dyke. Assuming a linear relationship between the horizontal
also be taken into account in the establishment of risk man- and vertical dimensions, the uncertainty in the estimate of the
agement and climate change adaptation plans for this agri- length of the dyke overflowed is 50 %.
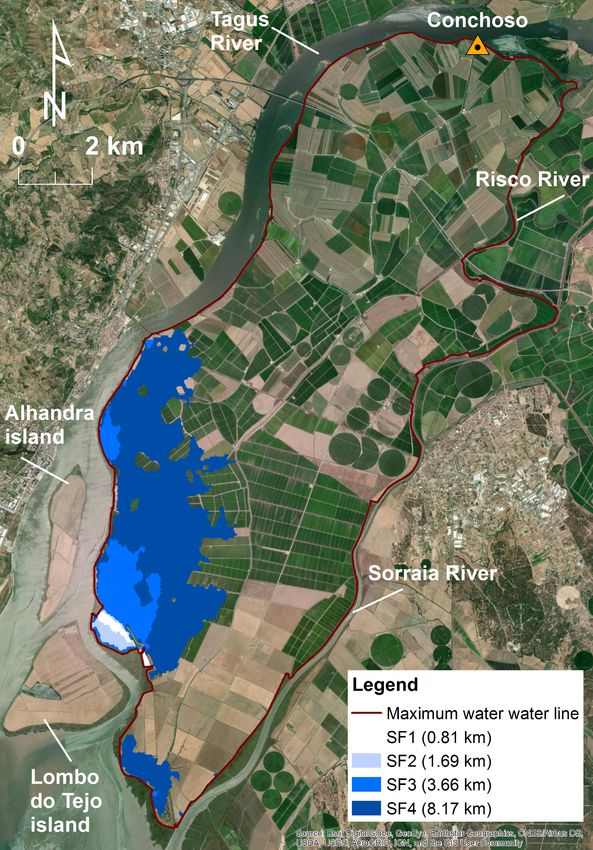
cultural area. For all high water level scenarios, the area where the dyke
is potentially affected is located in the southern half of the
5.2 High water level Lezíria (Fig. 5). In scenario S1, about 1 km of dyke near the
Lombo do Tejo island is affected. In scenario SF2, the dyke
Estuarine high water levels are forced by spring tides and is affected in the same zone, but the length doubles. When a
severe storm surges, which are associated with very low at- spring tide is considered (scenario SF3), the length of the af-
mospheric pressure conditions. Based on the past extreme fected dyke increases up to 4 km, extending the affected area
events of 1941 and 2010, described in Sect. 3.2, that caused to north of the Alhandra island and to the southern extreme
the overtopping of the Lezíria Grande dykes and inundation of the Lezíria. The length of the potentially affected dyke in-
of agricultural lands, four scenarios of extreme water lev- creases to 8 km if sea level rise is considered (SF4).
els were defined (Table 6). Extreme water level conditions Figure 6a presents the different scenarios projected in
of the scenarios result from the oceanographic and meteo- the consequence–probability diagram for the relative cost of
rological conditions of the events. The same sea level rise dyke damage (RCDD). Again, the expected uncertainty for
Nat. Hazards Earth Syst. Sci., 21, 2503–2521, 2021 https://doi.org/10.5194/nhess-21-2503-2021P. Freire et al.: Flood and drought risk assessment for agricultural areas (Tagus Estuary, Portugal) 2513
Table 7. Examples of risk control measures concerning water salinity and high water level risks.
Risk Measure Responsible for decision-making/ When the implementation should
implementation take place
Water salinity Extract freshwater from an Risk owner/risk owner and local When the level of risk is tolerable but
alternative source stakeholders rising
Reuse irrigation water Risk owner/risk owner and local When the level of risk is tolerable but
stakeholders rising
Adapt crops (higher salt tolerance, Risk owner/risk owner and local When the level of risk is intolerable
less water demanding, shorter stakeholders
growth period)
Construct reservoir Risk owner and national When the level of risk is intolerable
authorities/risk owner and national
authorities
High water level Implement flood monitoring and Risk owner and national authorities/ Immediately, to support risk manage-
early warning systems risk owner and national authorities ment
Raise dyke level Risk owner/risk owner When the level of risk is tolerable but
rising
Reinforce dyke Risk owner/risk owner and When the level of risk is tolerable but
environment and agricultural author- rising
ities
Transfer valuable goods and Risk owner/risk owner When the level of risk is tolerable but
infrastructures to other areas rising
Implement a water retention basin Risk owner and environment and When the level of risk is intolerable
along the dyke agricultural authorities/risk owner
and environment and agricultural
authorities
Create new artificial wetlands Risk owner and environment and When the level of risk is intolerable
agricultural authorities/risk owner
and environment and agricultural
authorities
both consequence and likelihood is represented by horizon- dykes’ erodibility. In reality, events of this type can erode and
tal and vertical bars. The consequence severity of the scenar- breach the dykes at several locations, as actually occurred in
ios with low (SF1) and medium severity (SF2) is consistent February 2010, increasing the potential dyke length affected.
with the known impacts of the 1941 and 2010 events, which Because the 1941 scenario is more energetic (in terms of
were much higher in 1941, as described in Sect. 3.2. Medium wind speed, water currents and waves), the breaching should
severity, corresponding to a dyke repair cost of 1 % to 10 % of also be more severe. Hence, the length affected during this
the ABLGVFX annual income, can be reached for low like- scenario is probably more underpredicted by the model than
lihood scenarios with an RP between 10 and 100 years. The for the 2010 scenario. None of the scenarios considered have
consequence severity is “high” (repair cost is up to 30 % of an associated low risk (Fig. 6b), i.e. the dyke is not over-
the ABLGVFX annual income) for the very low likelihood flowed. This is explained by this risk not being associated
scenario (scenario 3, RP > 100 years). In this case, besides with average oceanographic and meteorological conditions.
the 1941 storm surge conditions, an extreme tidal range is In all scenarios without sea level rise, the risk conditions are
considered (equinoxial spring tide). Very high consequence moderate (tolerable level), indicating that risk has to be mon-
severity, expressed by the dyke repair cost being over 30 % itored regularly to decide if adaptation measures have to be
of the ABLGVFX annual income, is reached if sea level rise taken to reduce the risk level. However, as sea level rises, risk
is considered (SF4). Limitations of the model can underpre- will become unacceptable. Hence, risk treatment will be re-
dict the severity level. The model was run with a fixed ge- quired in the future to bring the risk down to an acceptable
ometry, i.e. the bathymetry and topography were assumed level.
to remain unchanged during the simulations not considering
https://doi.org/10.5194/nhess-21-2503-2021 Nat. Hazards Earth Syst. Sci., 21, 2503–2521, 20212514 P. Freire et al.: Flood and drought risk assessment for agricultural areas (Tagus Estuary, Portugal)
ter availability is thus essential to support decision-making
both before and during the agricultural campaign. An adap-
tive risk assessment in a temporal scale of weeks during the
most critical period for crop irrigation is suitable to help man-
age freshwater scarcity.
For estuarine extreme water levels associated with tides
and storm surges, the elements at risk are mainly the agri-
cultural land itself and infrastructures such as dykes, support
facilities, roads and access infrastructures. Damage in those
assets and ultimately the loss of agricultural land due to in-
undation have a direct economic impact on the risk owner. In
agricultural lands located in low-lying estuarine areas, dykes
or other protection structures are often present to prevent fre-
quent land inundation during high spring tides. Using the rel-
ative cost of dyke damage as a consequence descriptor pro-
vides a direct quantification of the hazard economic impact
on the risk owner and is easily estimated through information
normally available to the risk owner.
Due to the uncertainty of the factors that control both risks,
a continuous consequence–probability diagram was found to
be the most adequate technique for risk level estimation and
evaluation as it integrates the uncertainty in the process. In
addition, this tool is suitable for communicating the risk in
a simple way to the risk owner. The applicability of the de-
veloped approach was explored through the application in
Figure 5. The Lezíria inundation areas for the hazard scenarios the Lezíria Grande agricultural area, known to be affected
showing the locations where the dyke is potentially affected, as well by those two hazards. Results show that concerning fresh-
as affected dyke length (ESRI Basemap).
water scarcity, the risk increases with the duration of the
droughts, and when low river flows occur for several con-
secutive weeks, even using the Risco River as an alternative
6 Discussion and conclusions source of water for irrigation is not sufficient to meet the wa-
ter needs. The total dependence of irrigation on the Tagus and
The risk assessment approach proposed in this study is in- Sorraia fluvial discharges, with other users upstream, sug-
tended to integrate the hazard dimensions that most affect gests that previous knowledge of the water availability re-
agricultural areas located in estuarine margins. Highly de- served in Spain and Portugal and the consumption expected
pendent on water resources, agriculture is one of the eco- for the different sectors upstream is essential in assessing
nomic sectors most vulnerable to climate change effects the risk of freshwater unavailability for irrigation. Real-time
(Aleksandrova et al., 2016). Its vulnerability is highest for knowledge of the upstream discharges, existing consump-
agricultural areas located in estuaries where changes in hy- tions and possible runoff from the rice crops, particularly
drological regimes and sea level rise can have an impact those located along Sorraia River, will definitely contribute
on both salt water landward intrusion and low-lying-area to decision-making regarding the best periods for estuarine
inundation (Kimmerer and Weaver, 2013). The main chal- water intake.
lenge of the approach developed herein was to find suitable Considering the estuarine inundation, the results presented
consequence descriptors of the two hazards that incorporate above show that presently the risk in the Lezíria Grande is
scientific-based data but can easily be applied by the risk moderate. The hazard can be significant but only for very ex-
owner and be updated in time. For this purpose, the differ- treme events with a high return period. However, sea level
ence in elements at risk, coverage and temporal scale of im- rise will increase the risk. Hence, the risk owner should con-
pacts for the two hazards were considered in the definition of sider risk reduction measures as they will become neces-
consequence descriptors for risk assessment. sary in the future. Furthermore, the sea level rise considered
For saltwater landward intrusion due to droughts, the wa- herein was based on the fifth IPCC assessment report (IPCC,
ter resources availability is the element at risk. The scarcity 2014). Since that report was published, several studies in-
of suitable water for irrigation has an economic impact on the dicate that sea level may rise faster than anticipated (Shep-
risk owner, mainly due to crop losses resulting from lack of herd et al., 2012; Khan et al., 2014; Scambos and Shuman,
water and/or salinization of land if salty water is used. Pro- 2016; Seo et al., 2015; Martín-Español et al., 2016; Kopp
viding risk owners with tools that anticipate the expected wa- et al., 2017). Hence, the possibility that the 0.5 m rise in sea
Nat. Hazards Earth Syst. Sci., 21, 2503–2521, 2021 https://doi.org/10.5194/nhess-21-2503-2021P. Freire et al.: Flood and drought risk assessment for agricultural areas (Tagus Estuary, Portugal) 2515 Figure 6. Consequence–probability diagram for relative cost of dyke damage (a). Horizontal and vertical bars indicate the uncertainty of the hazard in both consequences and likelihood, respectively. Risk diagram for water level relative cost of dyke damage (b). level used in scenario SF4 is reached long before the end 2014), but their resolution is inappropriate for local-scale of the century should be considered. Finally, the uncertain- analyses. Regional and local databases are scarcer (e.g. Rilo ties in both the probability and the consequence are large. et al., 2017) but should be used and their development en- Further studies and data collection should therefore be con- couraged. The choice of events for the scenario definitions ducted to reduce these uncertainties. Examples include con- should cover a wide range of consequences and probability sidering dyke breaching and simulating the combined effect to provide a suitable risk spectrum. Whenever possible sce- of river floods and storm surges (Zhang et al., 2020). nario construction should consider the main controlling fac- Differences in the temporal scales of both risks have an tors of the hazard severity (e.g. river discharge, maximum impact on the time horizon of risk assessment and conse- water level and sea level rise). quently on the selection of possible actions to be taken to re- As directed to support decision-making, the risk assess- duce risk. Results highlight the differences between the haz- ment approach presented here should be applied together ard consequences of the two risks for the risk owner, with with a risk treatment plan (ISO, 2009a). The plan will iden- different extent and impact level depending on the hazard tify appropriate measures to be taken, in particular to reduce severity. The freshwater scarcity can have economic and even risk when the level of risk approaches or exceeds an unac- social consequences at other risk management levels, like for ceptability threshold. For each specific site, this plan is built farmers, agro-industry and local communities, particularly if upon the knowledge acquired and supported by monitoring the quantity and quality of production are severely affected, and early warning systems. Risk control measures should be thus having an impact on related trade and services. Besides identified, evaluated and accepted by stakeholders before be- the economic impact on the risk owner, inundation can have ing applied (Simonovic, 2012). Examples of control mea- consequences for farmers if the agricultural land loss is high. sures to cope with water salinity and high water level risks Considering the context of the study area, a broader impact are presented in Table 7. The responsibility for the decision- of the consequences in agro-industry and local communities making and measure implementation will depend on the risk can be considered negligible. level. Some measures can be implemented by the risk owner The risk assessment approach application in the study and local stakeholders (e.g. farmers); others may require the area raised some challenges. The definition of both conse- involvement of decision-makers and authorities at the na- quence and risk criteria have to be based on in situ knowl- tional level (e.g. water, agricultural, environment and civil edge and historical information. Even if the risk owner has protection authorities). The risk level determines when each most of the information required, other relevant data are of- measure should be implemented. An adaptive strategic ap- ten dispersed in different institutions requiring their aggrega- proach (Mearns, 2010) will be adopted to better deal with tion and a prior informed analysis. The definition of hazard uncertainty in the decision-making process. Periodic moni- scenarios is another important point to be considered when toring and review of the risk assessment and treatment pro- this approach is applied. As stated before, hazard scenarios cesses, including the communication and consultation of all have to be anchored on past event information. Valuable in- involved parts, will held. This approach will contribute to formation about historical events can be found in a variety reduce the uncertainty of the process by updating the risk of sources, including databases where systematized data are criteria and risk control measures. The improvement of the suitable for supporting risk assessment (Santos, et al., 2014). knowledge about the system, based on more data and better Several global and national disaster databases are available predictive tools, may also contribute to better characterize, (e.g. EM-DAT, 2013; DISASTER database, Zêzere et al., quantify and reduce the uncertainty over time. https://doi.org/10.5194/nhess-21-2503-2021 Nat. Hazards Earth Syst. Sci., 21, 2503–2521, 2021
You can also read