Formulation and optimization of gastroretentive bilayer tablets of calcium carbonate using D-optimal mixture design
←
→
Page content transcription
If your browser does not render page correctly, please read the page content below
e-Polymers 2021; 21: 57–71
Research Article
Manasa Moganti* and Shivakumar H. Nanjappa*
Formulation and optimization of gastroretentive
bilayer tablets of calcium carbonate using
D-optimal mixture design
https://doi.org/10.1515/epoly-2021-0008
received July 21, 2020; accepted December 05, 2020
1 Introduction
Abstract: Gastroretentive bilayer tablets of calcium car- Calcium is the major component of the skeletal system
bonate (CC) were developed using D-optimal mixture which accounts for about 1–2% of the adult body weight
design. The effect of formulation factors such as levels (1). The recommended dietary allowance (RDA) of cal-
of HPMC K100 M (X1), sodium bicarbonate (X2), and cium varies from 800 to 1,300 mg/day for adolescents,
HPMC E15 LV (X3) on responses like floating lag time 1,000 mg/day for adults, and 1,200 mg/day for elderly.
(R1) and release of CC at 1 h (R2) and 6 h (R3) was eluci- Globally, more than 800 million people are undernour-
dated. The optimized formulations developed by numer- ished and about 3.5 billion people are at risk of calcium
ical optimization technique were found to have short deficiency due to inadequate dietary supply (1). It has
floating lag time (2.85 ± 0.98 min), minimum burst been estimated that more than 6% of global mortality
release (27.02 ± 1.18%), and controlled yet near complete and morbidity burdens are associated with undernour-
release (88.98 ± 2.75%) at 6 h. In vivo radiographic studies
ishment and micronutrient deficiencies. Approximately,
in rabbits indicated that optimized batch displayed a
90% of those at risk of calcium deficiency were found to
mean gastric retention time (GRT) of 5.5 ± 1 h which
reside in Africa and Asia and nearly 75–100% of Indians
was significantly prolonged (P < 0.05) compared to the
are found to be calcium-deficient. Sensitive population
conventional tablets that displayed a GRT of less than 1 h.
include children, elderly pregnant patients, and post-
The studies proved that the gastroretentive tablets can be
menopausal syndrome (PMS) women. Calcium deficiency
a promising platform to improve bioavailability of nutri-
can retard growth and cognitive development, impair
ents having absorption window in upper gastrointestinal
immunological functioning, and increase the risks of
tract.
noncommunicable diseases including skeletal, cardio-
Keywords: calcium carbonate, floating tablets, gastro- vascular, and metabolic disorders (2). Calcium deficiency
retentive tablets, mixture design, optimization may lead to brittle or weak bones, bone fractures, delays
in children’s growth and development, problems with
proper blood clotting, weakness and fatigue, heart pro-
blems involving blood pressure and heart rhythms,
osteoporosis (3), etc.
Oral calcium is considered to be the first line therapy
for calcium deficiency (4,5). Calcium supplementation (6)
is currently done by conventional tablets containing cal-
* Corresponding author: Manasa Moganti, Department of
cium salts such as CC or calcium citrate (7). Calcium car-
Pharmaceutics, KLE College of Pharmacy, Bengaluru 560 010,
Karnataka, India; Basic Science Research Center (Off Campus), KLE bonate is the least expensive and most widely used salt of
College of Pharmacy, Bengaluru 560 010, Karnataka, India, calcium. Nearly 85% of all calcium supplements sold in
e-mail: manasamoganti37@gmail.com, tel: +91-8884774249 the US contain CC. However, only about 30% of the avail-
* Corresponding author: Shivakumar H. Nanjappa, Department of able elemental calcium is actually absorbed and bioavail-
Pharmaceutics, KLE College of Pharmacy, Bengaluru 560 010,
able following oral administration (8). The likely reason
Karnataka, India; Institute for Drug Delivery and Biomedical
Research, Bengaluru 560086, India, e-mail: shivakumarhn@gmail.
for the poor bioavailability is that calcium absorption is
com, tel: +91-9448241420 pH-dependent, site-specific, and limited by the carrier-
ORCID: Shivakumar H. Nanjappa 0000-0003-1596-9941 mediated transport (7). The soluble calcium normally is
Open Access. © 2021 Manasa Moganti and Shivakumar H. Nanjappa, published by De Gruyter. This work is licensed under the Creative
Commons Attribution 4.0 International License.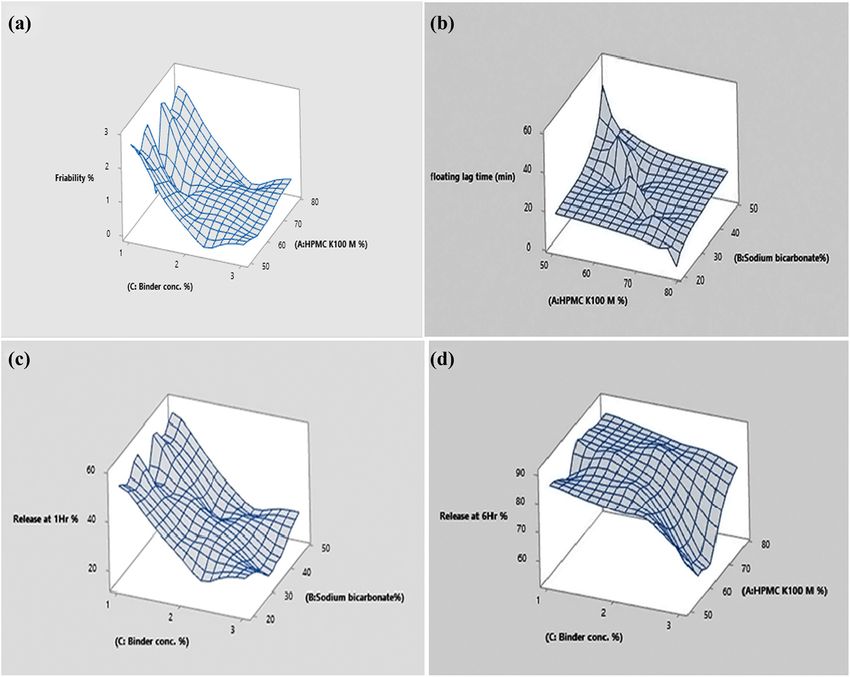
58 Manasa Moganti and Shivakumar H. Nanjappa
well-absorbed from the duodenum due to the presence of 2 Materials and methods
carrier protein ‘calbindin’ at active absorption sites (9).
However, conventional calcium tablets exhibit poor bio-
2.1 Materials
availability as they may quickly cross the absorption sites
allowing a fraction of the dose to be absorbed. Moreover,
Calcium carbonate (confirming to IP) and barium sulfate
the conventional tablets are likely to saturate the carrier
(X-ray grade) were purchased from Loba Chemie Pvt. Ltd,
proteins located in the duodenum and therefore hamper
Mumbai. Sodium bicarbonate, potassium dihydrogen
the complete absorption of the whole dose of calcium
orthophosphate, sodium hydroxide pellets, hydrochloric
resulting in poor oral bioavailability. In this context, there
acid, and talc were supplied from S.D. Fine Chemicals,
is a need to develop a gastroretentive drug delivery system
Mumbai. Magnesium stearate was supplied by Central
(GRDDS) for CC that has the potential to overcome the
Drug House Pvt. Ltd, New Delhi. Hydroxypropyl methyl
above-mentioned limitation of the conventional tablets
cellulose K100 M and hydroxypropyl methyl cellulose E15
as no such product is available in the Indian as well as
LV were supplied by Colorcon Asia Pvt. Ltd, Goa.
the global market. The GRDDS, by virtue of its buoyancy, is
likely to be retained proximal to the absorption site and
stays afloat in the gastric fluid in which CC is known to
possess a good solubility. Various technologies have been 2.2 Methodology
developed for gastroretention of the drug delivery systems
which include low density or floating systems (1 g/cm3) that are retained at the antrum of Infrared spectrophotometry is a useful analytical tech-
the stomach, bioadhesive systems that adhere to the gas- nique utilized to check the chemical interaction between
tric mucosa, and expandable systems that swell or unfold the formulations. The sample was powdered and inti-
to a large size to prevent the passage of the dosage form mately mixed with 10 mg of powdered potassium bro-
through the pyloric sphincter, magnetic, and superporous mide (KBr). The powdered mixture was taken in a diffuse
systems (10,11). reflectance sampler and the spectrum was recorded by
The development of GRDDS tablet for CC seemed scanning in the wavelength region of 4,000–400 cm−1
quite challenging considering its high dose (200 mg) in an FTIR spectrophotometer (Jasco 460 plus, Japan).
and high density (∼2.71 g/cm3). To meet the challenge, The IR spectrum of the CC was compared with that of
we aim to develop a gastroretentive system for CC using the physical mixture of check for any interaction of CC
a D-optimal design. The GRDDS tablets are first of its with any of the excipients used.
kind that have both floating and bioadhesive properties
for site-specific delivery of calcium in the upper part of
the gastrointestinal tract. In this context, the objective 2.2.2 Preparation of gastroretentive floating bilayer
of the work was to model the effect of the composition tablets of CC: design of experiment (DoE)
of the bilayer tablets, namely, the proportion of binder
(Hydroxypropyl methyl cellulose E15 LV), matrix mate- A 3-factor 3-level D-optimal mixture design generated in
rial (Hydroxypropyl methylcellulose K100 M), and Design Expert Software (version 10.0.6.0) was employed
effervescent agent (sodium bicarbonate) on dissolution to study the effect of critical formulation on the product
and floating lag time. In addition, we plan to validate attributes of the floating bilayer tablets. The experimental
the polynomial models by preparing the optimized design contained three factors or components, namely,
formulation with the most desirable attributes using the amounts of HPMC K100 M (X1), sodium bicarbonate
regression analysis and analysis of variance (ANOVA). (X2), and HPMC E 15 LV (X3). The sum of three compo-
Finally, image analysis of the optimized bilayer tablet nents would be 100 where the proportions of X1, X2, and
formulation in rabbits to assess the in vivo gastroreten- X3 were found to range from 50.00% to 79.00%, 20.00%
tion would be the integral part of the investigation. to 49.00%, and 1.00% to 3.00%, respectively. The effect
The present work would be the ‘first of its kind’ as, of formulation variables on responses like friability (R1),
to the best of our knowledge, no extensive work has floatation time (R2), percent release at the end of 1 h (R3),
been undertaken to develop a bilayer GRDDS for and at the end of 6 h (R4) was systematically investigated.
calcium. The compositions of formulations as per D-optimal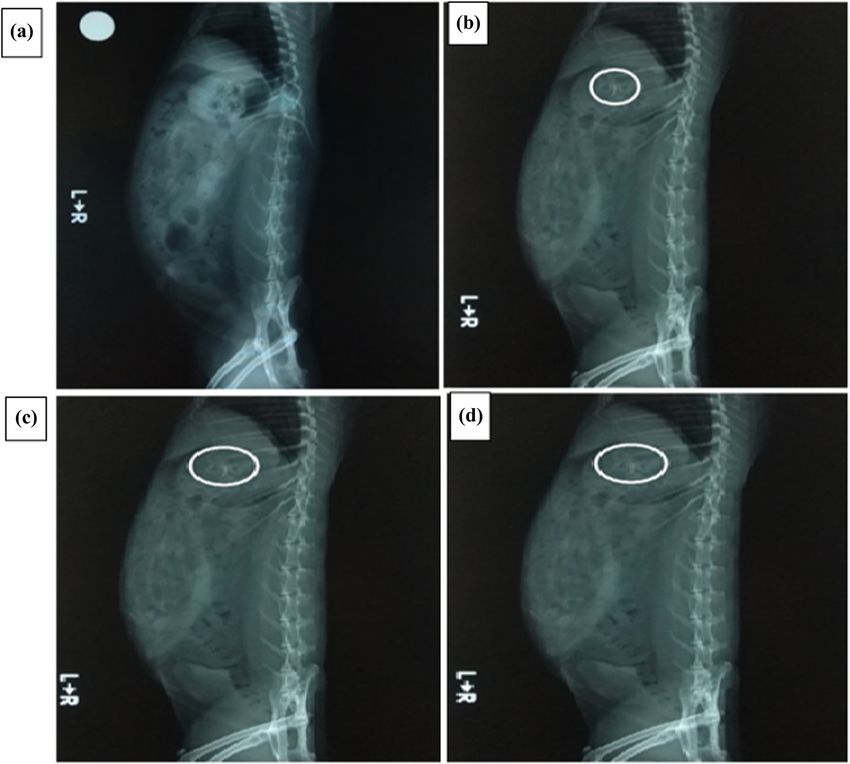
Gastroretentive bilayer tablets of calcium carbonate using D-optimal design 59
mixture and the constraints set on each component are 220A XB, Precisa, Switzerland). The weights were recorded
shown in Table 1. in mg; the mean and standard deviation values were com-
The bilayer tablets contained two layers, i.e., an effer- puted. The average weight of the bilayer tablets and the
vescent floating layer and CC layer. All the ingredients acceptable limit were deduced.
were passed through a 250 µm sieve. The floating layer
was prepared by direct compression of the blend of
HPMC K100 M and sodium bicarbonate. Calcium carbo- 2.3.2 Thickness and diameter
nate layer was produced by wet granulation method. In
brief, CC was blended with a solution of HPMC E15 LV in Tablet thickness and diameter of ten randomly selected
water. The quantity of HPMC E15 LV to be incorporated bilayer from each batch were determined (13). The values
was predetermined by the experimental design. The wet were recorded in mm using a digital caliper (Mitutoyo
mass was passed through a 12 mesh sieve of aperture size digimatic caliper, Mitutoyo Corporation, Kawasaki, Japan).
1.67 mm and the wet granules produced were dried The mean and standard deviation of the thickness and
at 60°C for 30 min in a hot air oven. The dried granules diameter were calculated.
were passed through the same sieve to break the lumps.
The blend of the floating layer and dried granules of
CC were separately lubricated with magnesium stearate 2.3.3 Hardness
(1.5% w/w) and talc (2.5% w/w) for 2–3 min. The lubri-
cated blends were finally compressed to bilayer tablets The resistance of tablets to shipping or breakage under
weighing 420 mg on a bilayer tablet rotary press conditions of storage, transportation, and handling before
(Cronimach, Ahmedabad, Gujarat) using a 9 mm dia- usage depends on their hardness. Hardness of ten ran-
meter die to a hardness of 5–7 kg/cm2. The formulation domly selected bilayer tablets from each batch was mea-
variables employed to produce 16 batches of bilayer sured using a Stokes Monsato hardness tester (M/s Cambell
tablets as per the experimental design are portrayed in Electronics, India) (14). The hardness was measured in
Table 2. terms of kg/cm2. The mean and standard deviation values
were computed.
2.3 Evaluation of floating bilayer tablets: 2.3.4 Friability
2.3.1 Weight variation The friability of bilayer tablets was determined by fol-
lowing the official procedure (15). Friability was deter-
Weight variation of the bilayer tablets from each batch was mined by subjecting twenty randomly selected tablets
determined as per official method (12). Twenty tablets were of each batch to abrasion in automated USP friabilator
selected at random and individual weight of the bilayer (Electrolab, Mumbai, India) for 100 rotations. The de-dusted
tablets was determined in an analytical balance (Model tablets were weighed and % friability was calculated using
Table 1: Independent variables showing experimental ranges of the D-optimal mixture design
Independent variables Low value (%) High value (%)
A: Fraction of HPMC K100 M (% w/w) 50 79
B: Fraction of sodium bicarbonate (% w/w) 20 49
C: Fraction of HPMC E15 LV (% w/v) 1 3
Dependent variables Constraints
Y1: Friability (%) Minimize
Y2: Floating lag time (min) Minimize
Y3: Drug release at 1 h (%) Minimize
Y4: Drug release at the end of 6 h (%) Maximize60 Manasa Moganti and Shivakumar H. Nanjappa
Table 2: Composition of the model formulations (in mg) as per D-optimal mixture design
UN Actual wt. of X1a Actual wt. of X2a Actual wt. of X3a CaCO3 Mg stearate Talc Total wt.
F1 77 73.41 3.59 250 6 10 420
F2 98.95 52.75 2.33 250 6 10 420
F3 119.61 30.8 3.61 250 6 10 420
F4 121.66 30.8 1.55 250 6 10 420
F5 97.79 51.59 4.65 250 6 10 420
F6 77 75.46 1.55 250 6 10 420
F7 97.79 51.59 4.65 250 6 10 420
F8 98.95 52.75 2.33 250 6 10 420
F9 91.89 60.57 1.55 250 6 10 420
F10 90.86 58.52 4.65 250 6 10 420
F11 109.34 41.58 3.1 250 6 10 420
F12 119.61 30.8 3.61 250 6 10 420
F13 98.95 52.75 2.33 250 6 10 420
F14 106.77 45.69 1.55 250 6 10 420
F15 87.78 63.14 3.1 250 6 10 420
F16 77 73.41 3.61 250 6 10 420
a
X1, X2, and X3 represent the amounts of HPMC K100 M, sodium bicarbonate, and HPMC E15 LV, respectively. X3 was used as 8% w/v and as
binding solution in the bilayer tablets.
equation (1) for each batch of bilayer tablets and expressed 2.3.7 In vitro release studies
as mean of 3 determinations. The tablets which tend to lose
less than 1% of their weight are generally considered The dissolution studies of the bilayer floating tablets were
acceptable. performed for a period of 6 h in USP dissolution apparatus-2
(Electrolab, Mumbai, India) at a paddle speed of 50 rpm in
900 mL of pH 1.2 buffer maintained at 37 ± 0.5°C (18). About
2.3.5 Content uniformity 5 mL of samples were withdrawn at 1, 2, 3, 4, 5, and 6 h and
immediately replaced with same amount of fresh dissolu-
Content uniformity test was performed as per USP proce- tion medium maintained at the same temperature in order
dure by random sampling ten tablets from each batch to maintain the sink condition. The aliquots sampled were
(16). The tablets were crushed and allowed to equilibrate filtered through 0.45 µ filters and analyzed using a flame
with pH 1.2 buffer for 24 h. Subsequently, the solutions photometer to determine the amount of CC released at dif-
were filtered through (0.45 μm, Millipore) and suitably ferent time points. The dissolution data recorded in tripli-
diluted to determine the content of CC using a flame photo- cate was analyzed to calculate percentage cumulative cal-
meter (Systronics, Flame photometer 128, Ahmedabad, cium released at different time intervals.
Gujarat).
2.3.8 In vitro release kinetics
2.3.6 Floating lag time
In order to investigate the kinetics and mechanism of
The time required for the tablet to rise to the surface release of calcium from prepared tablets, the release
and remain afloat was considered as floating lag time data were examined using zero-order kinetic (19), first-
(17). To record the floating lag time, the bilayer tablets order kinetic (20), and Higuchi kinetic (21).
were transferred to the dissolution medium taken in For the zero-order kinetic, data obtained were plotted
USP Type II dissolution apparatus in 900 mL of pH as cumulative amount of calcium released versus time
1.2 buffer kept at 50 rpm and 37 ± 0.5°C. The floating whereas for the first-order kinetic, the obtained data were
lag time and floating lag time of bilayer tablets were plotted as log cumulative calcium remaining versus time.
recorded in triplicate for each batch of bilayer tablets For Higuchi kinetic, the obtained data were plotted as cumu-
produced. lative percentage calcium release versus square root of time.Gastroretentive bilayer tablets of calcium carbonate using D-optimal design 61
2.3.9 Stability study and at the same time ensure complete dose of the CC in
the stipulated floating time of 6 h. Considering this, initi-
The optimized formulation was covered in aluminium ally, we developed an effervescent floating matrix tablet
foil and subjected to Real time stability condition for of CC using HPMC K4M as a matrix material, sodium
6 months at 25 ± 2°C/60 ± 5% RH. The samples were bicarbonate as effervescent agent, and HPMC E15LV as
analyzed at 1, 3, and 6 months against the tablets on a binder. Even though the effervescent matrix tablets of
day “0” for physical characteristics, floating lag time, CC were found to float for the period of 6 h, the release of
and Dissolution till 6 months. calcium was substantially hampered even in sink condi-
tions at pH 1.2, allowing a fraction of the calcium dose to
be released in the stipulated time span of 6 h. Considering
2.3.10 In vivo X-ray imaging studies this, we planned to separate the floating layer from the CC
layer in order to ensure a floating time of 6 h and at the
In vivo animal studies were performed in normal rabbits same time ascertain a near complete release of calcium in
using X-ray imaging technique for evaluating the gastro- a controlled fashion in pH 1.2 in the stipulated floating
retentive potential of the optimized tablet formula- time. In order to systematically accomplish our goals,
tion as per the protocol approved by the Institutional we planned to develop and optimize the formula or the
Ethical Committee (IE-52, dated 12/10/2019) at in vivo composition of the bilayer floating effervescent floating
Biosciences, Magadi Road, Bengaluru, India. Unisex rab- tablet of CC using a D-optimal design. Mixture experi-
bits of New Zealand white strain weighing 2–2.5 kg were mental designs are generally used to analyze the impact
housed under standard laboratory conditions at 25 ± 2°C of formulation variables on the responses. D-optimal
and 55 ± 5% RH with standard diet and tap water ad design is a mixture design that is used to evaluate the
libitum (two groups of animals with four animals in effect of changes in the composition on the responses and
each group were used for the studies). Prior to initiation allows statistical optimization of the formulation with
of the studies, the animals were kept overnight under least number of experiments. The design comprises of a
fasting condition in order to avoid difficulties during ima- total of 16 points including 6 points for the modelling, 5
ging. The first group of animals were orally administered points to estimate lack of fit, and 5 points to estimate the
with optimized batch of bilayer tablet formulation con- pure experimental error (22). The buoyant layer was pro-
taining barium sulfate as a marker, while the control group duced by direct compression of the blend of HPMC K100 M
of animals were orally treated with conventional tablets and sodium bicarbonate. On the contrary, CC layer was
containing the same marker. The animals were held in the produced by wet granulation method using an aqueous
upright position for imaging to locate the position of both solution of HPMC E15 LV as binder.
control and floating tablets in the GI tract under X-ray
machine (Skanray Model: Microskan DR) at predetermined
time intervals like 0, 2, 4, and 6 h, respectively.
3.1 Drug-excipient compatibility studies
2.3.11 Statistical analysis 3.1.1 Fourier transform infrared spectroscopy
The data generated during the in vitro and in vivo studies The FTIR spectrum of CC, the physical mixture of the CC
were statistically analyzed by ANOVA in GraphPad 5.0 with the other excipients used, and the bilayer tablet are
Instat demo version software (GraphPad Inc. CA, USA). portrayed in Figure 4a–c, respectively. The IR spectrum
The probability value (P) of less than 0.05 was considered of CC displayed the characteristic absorption peak at
to be significant. 1,796 cm−1 that can be assigned to –C═O stretching. In
addition, an intense band owing to the OH stretching
was probably due to the moisture content in the com-
pound. Similarly, the IR spectrum of the physical mixture
3 Results and discussion depicted the broad band that can be assigned to OH
stretching along with the characteristic absorption peak
The aim of the investigation was to produce bilayer at the same position, though the peak intensity differed
tablets that were able to float at least for a period of 6 h indicating the absence of any interaction between CC and62 Manasa Moganti and Shivakumar H. Nanjappa other excipients in the physical admixture. Likewise, the included p value of the model (must be
Gastroretentive bilayer tablets of calcium carbonate using D-optimal design 63
Table 3: Response parameters of the model formulations of floating bilayer tablets of CC prepared as per D-optimal mixture design
RUN X1 (% w/w)a X2 (% w/w)a X3 (% w/w)a Friability FLT (min) % Rel1h % Rel6h
F1 50 47.67 2.33 0.02 ± 0.01 38.47 ± 2.16 22.74 ± 0.57 81.85 ± 2.17
F2 64.25 34.25 1.5 0.25 ± 0.03 6.12 ± 0.40 38.75 ± 0.63 87.48 ± 2.41
F3 77.67 20 2.33 0.03 ± 0.01 12.47 ± 0.15 22.47 ± 0.35 82.41 ± 1.28
F4 79 20 1 2.53 ± 0.31 3.59 ± 0.21 53.85 ± 2.58 86.33 ± 2.57
F5 63.5 33.5 3 0.13 ± 0.02 37.88 ± 0.74 15.87 ± 2.54 54.20 ± 0.58
F6 50 49 1 2.64 ± 0.28 4.14 ± 0.08 54.82 ± 2.13 86.56 ± 1.55
F7 63.5 33.5 3 0.15 ± 0.02 37.54 ± 0.42 16.49 ± 0.31 54.08 ± 0.63
F8 64.25 34.25 1.5 0.25 ± 0.03 6.57 ± 0.26 36.07 ± 2.65 87.22 ± 1.19
F9 59.67 39.33 1 2.68 ± 0.18 2.85 ± 0.18 56.60 ± 1.59 82.29 ± 0.88
F10 59 38 3 0.10 ± 0.01 6.55 ± 0.57 15.01 ± 0.45 56.12 ± 2.03
F11 71 27 2 0.44 ± 0.10 17.31 ± 0.09 31.95 ± 2.89 86.31 ± 1.75
F12 77.67 20 2.33 0.02 ± 0.01 12.76 ± 0.60 21.70 ± 1.26 81.24 ± 0.27
F13 64.25 34.25 1.5 0.25 ± 0.03 4.74 ± 0.81 37.28 ± 1.87 88.72 ± 0.92
F14 69.33 29.67 1 2.77 ± 0.64 4.99 ± 0.96 55.61 ± 1.28 88.57 ± 2.80
F15 57 41 2 0.40 ± 0.10 36.55 ± 0.47 26.19 ± 1.54 85.19 ± 1.29
F16 50 47.67 2.33 0.03 ± 0.01 36.42 ± 3.59 24.85 ± 1.42 82.08 ± 1.45
Each data point represents mean ± S.D (n = 3).
a
X1, X2, and X3 represent the amounts of HPMC K100 M, sodium bicarbonate, and HPMC E15 LV, respectively. X3 was used as 8% w/v and as
binding solution in the bilayer tablets.
Table 4: Summary of ANOVA for the response parameters of the friability. It is a common consensus that the hardness of
model formulations of bilayer tablets prepared as per D-optimal the tablets was found to increase as the binder amounts
mixture design increased (24). It could be concluded that the friability
could be minimized merely using moderate to high levels
Response F-value p-value R2 Adj R2 % C.V. of HPMC E15 LV. The negative impact of the binder on the
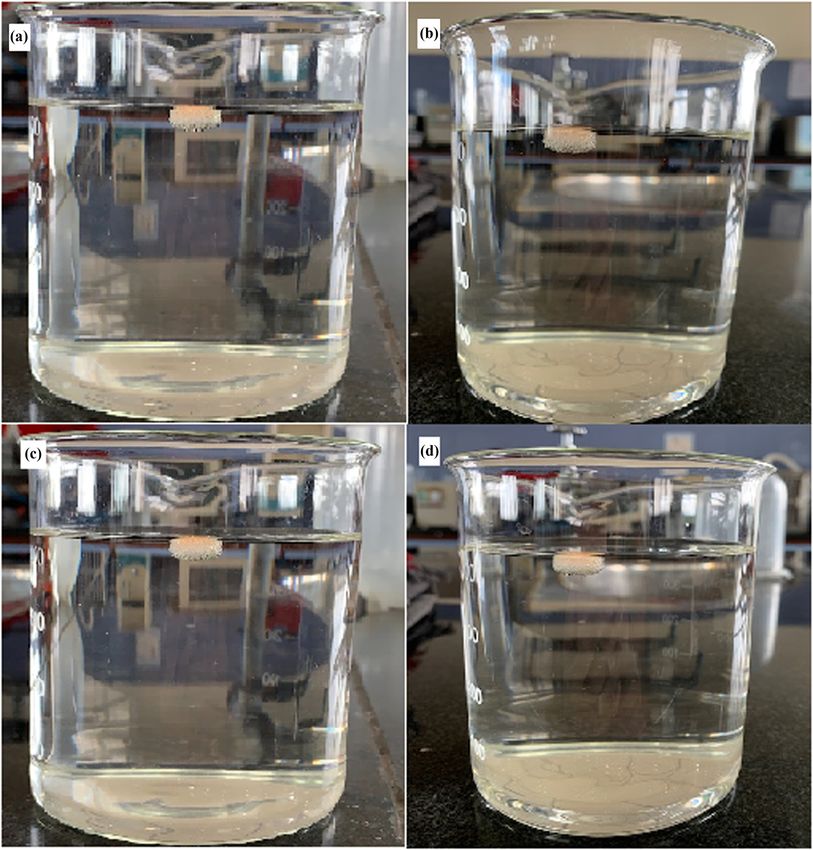
Y1 1544.4364 Manasa Moganti and Shivakumar H. Nanjappa Figure 1: Response surface plots depicting the interaction effects of dependent factors on a Y: friability (a), FLT (b), % release at 1 h (c), and % release at 6 h (d). prolonged lag time could eventually lead to system may be required to initiate floatation (25). It could be failure due to unanticipated or accidental rapid gastric summarized that the FLT could be minimized merely clearance by the peristaltic action of the stomach and using moderate levels of HPMC E15 LV. The negative forcible gastric housekeeping waves. Generally, batches impact of the binder on the friability is clearly visible in with high FLT contained higher levels (≥2%) of binder the 3D Plots captured in Figure 1b. In contrast, the HPMC E15 LV. Mathematical modelling of the experi- amounts of sodium bicarbonate with a positive coeffi- mental data suggested that the three factors investigated cient value of 1.19 were found to display a mild impact were found to have a substantial influence on FLT. on the FLTs. The positive effect of bicarbonate can likely Among the three factors explored, the effect of X3 was be attributed to the ability to generate carbon dioxide the most, followed by X2, while the effect of X1 was found by a reaction of sodium bicarbonate and gastric fluid to be the least. The amounts of HPMC E15 LV had a that would be efficiently entrapped in the polymeric gel highest negative coefficient value (25289.06), which layers, thereby decreasing FLTs (26). Of the three factors implies that the factor has most significant influence investigated, the amount of HPMC K100 M was found to on floatation lag times. This can be related to the fact have minor effect with a positive coefficient of 0.24. The that higher binder amounts could result in more compact positive effect can be attributed to HPMC K100 M, a high tablets with reduced porosity. The decreased tablet viscosity hydrophilic material that could form a layer of porosity is likely to substantially hinder the penetration strong gel matrix in the gastric fluids (27). The strong gel of dissolution medium into the tablet matrix, which in barrier in turn effectively entraps the carbon dioxide lib- turn would delay the generation of carbon dioxide that erated in situ, thereby reducing the tablet density below
Gastroretentive bilayer tablets of calcium carbonate using D-optimal design 65
Figure 2: Photographs depicting the side view of bilayer tablets of CC in pH 1.2 buffer at 1 h (a), 2 h (b), 4 h (c), and 6 h (d).
unity to confer the tablet buoyant (28). However, the FLT end of 1 h. Among the three factors, the effect of X3 was
in the present study was invariably affected by composi- most significant, followed by X2, while the effect of X1
tion of the carbonate layer rather than the floating layer. was found to be the least. The batches F4, F6, F9, and F14
were deemed to be unsuitable as they were found to
exhibit a burst release of 53.85 ± 2.58%, 54.82 ± 2.13%,
3.3.4 Release at 1 h 56.60 ± 1.59%, and 55.61 ± 1.28%, which coincidentally
corresponded well with the high friability values of
The percentage calcium release at the end of first hour was 2.53 ± 0.31, 2.64 ± 0.28, 2.68 ± 0.18, and 2.77 ± 0.64,
found to range from 15.87 ± 2.54% for F5 to 55.61 ± 1.28% respectively. The binder concentration displayed high
for F14 as per Table 3. The dissolution profiles of the negative coefficient (64542.84) indicating it had most sig-
model formulation were presented in Figure 3. The three nificant effect on the release of calcium at 1 h. On the
formulation factors investigated were found to have a contrary, higher binder levels produced more compact
significant influence on the release of calcium at the tablets that effectively prevented the initial burst release.66 Manasa Moganti and Shivakumar H. Nanjappa
3.3.5 Release at 6 h
The percentage calcium release by 6 h was found to range
from 54.08 ± 0.63% for F7 to 88.72 ± 0.92% for F13 as is
presented in Table 3. The total of 12 batches including
F1–F3, F5, F7, F8, F10–F13, F15, and F16 that were devoid
of initial burst release were found to display a controlled
pattern of calcium release. The batches F4, F6, F9, and
F14 were found to exhibit a burst release exceeding
50% as they displayed low hardness and high friability.
However, the subsequent release of calcium from these
tablets appeared to be retarded. The likely reason for the
retarded release could be that the dissolution media that
has been already saturated with the dissolved CC (>50%
CC in dissolved state) is less likely to create a sink condi-
tion to generate the concentration differential for further
dissolution of CC from the matrix tablet.
The three factors investigated were found to signifi-
cantly influence the release at 6 h. Of the three factors
investigated, the influence of X3 was the most, followed
by X2, whereas the effect of X1 was found to be the least.
The amount of binder HPMC E15 LV (X3) had a high
negative coefficient (−1539.68) that implies the factor
was found to have the considerable influence on the
Figure 3: Comparative cumulative amount of calcium release from release at 6 h. An increase in the concentration of binder
bilayer tablets of batches F1–F8 (a) and F9–F16 (b). effectively controlled the release of calcium from the
matrix tablets. The negative influence of the binder could
Literature citations in the past have indicated that be explained by the fact that higher binder amounts pro-
increase in binder concentrations in the matrix tablets duced compact and denser tablets that displayed con-
substantially reduced the burst release during the first trolled release of calcium during 6 h. The results also
hour (29). In contrast, sodium bicarbonate with a coeffi- imply that the release rate could be modulated by merely
cient of 4.38 was found to display a mild positive effect on varying the concentration of the binder HPMC E15 LV.
the release at 1 h. The tendency of bicarbonate to produce HPMC E15 LV alone is reported to effectively control the
effervescence that renders the tablet porous could be drug release from the matrix tablets (31). To conclude, the
the likely reason for the better calcium release at 1 h. complete release of calcium could be ensured by just
Previous reports have indicated that increase in the bicar- using moderate levels of HPMC E15 LV. The negative
bonate amounts would increase the drug release from influence of the binder on the release at 6 h is clearly
matrix tablets (30). In summary, the burst release could observed in the 3D Plots captured in Figure 1d. On the
be minimized by using moderate to high levels of HPMC contrary, sodium bicarbonate with a coefficient of 0.88
E15 LV. The negative effect of the binder on the burst was found to exert a mild positive influence on the
release is clearly evident in the 3D Plots captured in release at 6 h. The ability of bicarbonate to render the
Figure 1c. tablet porous, especially in those with lower binder levels,
Of the three factors investigated, HPMC K100 M was might be the probable reason for the higher release
found to have a negligible influence on the release at 1 h. observed (32). Of the three factors studied, HPMC K100 M
The likely reason for the same would be that HPMC was found to have a negligible influence on the calcium
K100M was not a part of the matrix in the CC layer. release at 6 h. As described earlier, the poor impact of
The rest of the batches that were devoid of initial burst HPMC K100 M could be due the fact that the high molecular
release can be considered to be more suitable as they weight polymer did not constitute the matrix material in CC
displayed a controlled pattern of calcium release. layer.Gastroretentive bilayer tablets of calcium carbonate using D-optimal design 67
Figure 4: FTIR Spectrum of CC (a), physical mixture (b), and bilayer tablet (c).
At the end of the studies, it could be concluded that 3.4 Optimization
the batches F2, F8, and F13 that contained moderate
amount of binder were found to be most suitable formu- A numerical optimization technique using the desirability
lations as they were found to comply with the official approach was employed to develop two new floating
friability limits, devoid of the initial burst effect, dis- bilayer tablet formulations with the desired responses.
played a short FLT, and resulted in a controlled yet com- The compositions of the optimized batches of floating
plete release of calcium by 6 h. bilayer tablet along with predicted and experimental68 Manasa Moganti and Shivakumar H. Nanjappa
Table 5: Composition of the optimized formulations and comparison of experimental values of the response parameters with the predicted
values
Composition (X1:X2:X3)a Responsesb Predicted value Experimental valuec Prediction error %
77.96:20:2.04 Y1 0.08 0.07 ± 0.81 −14.29
Y2 2.73 2.91 ± 0.57 +6.19
Y3 27.30 28.73 ± 0.85 +4.98
Y4 87.58 87.10 ± 1.69 −0.55
55.43:43.07:1.49 Y1 0.07 0.08 ± 0.49 +12.50
Y2 8.50 9.13 ± 0.24 +6.90
Y3 34.80 36.41 ± 1.12 +4.42
Y4 88.70 88.05 ± 1.96 −0.74
a
X1, X2, and X3 represent the amounts of HPMC K100 M, sodium bicarbonate, and HPMC E15 LV, respectively. X3 was used as 8% w/v and as
binding solution in the bilayer tablets. b Y1, Y2, Y3, and Y4 represent friability, floating lag time (FLT), release at 1 h, and at 6 h, respectively.
c
Each data point represents mean ± S.D (n = 3).
values for the response parameters are portrayed in content uniformity, FLT, burst release, and the amount
Table 5. The prediction error for the response para- released at 6 h proving the stability of the formulation
meters was found to range from −14.29 to +12.50. (Table 6).
The low values of prediction errors prove the validity
of the mathematical models generated by ANOVA
and regression analysis. The in vitro calcium release
3.6 In vivo radiographic studies
from the optimized formulation of bilayer tablets was
found to follow first-order kinetics.
The representative images of the in vivo radiographic stu-
dies (33) with the bilayer floating tablets are captured in
Figure 5. The in vivo studies revealed that the mean gas-
3.5 Stability study tric retention time for the tablets from the optimized
batch correlated well with the in vitro floating time. The
The results of real time stability studies for optimized studies indicated that the bilayer floating tablets from the
formulation batch carried out as per ICH guidelines optimized batch remained in the stomach for a mean
did not show any physical change in the tablets during period of 5.5 ± 1.0 h in rabbits which was significantly
the study period. The characteristic peaks of CC were higher (p < 0.05) than the conventional tablets that dis-
clearly evident in the spectra of the tablets too, proving played a mean gastric retention time of less than 2 h. The
the integrity of CC and at the same time ruling out the bilayer tablets by virtue of the floating properties were
possibility of any chemical interaction between CC and found to be well-retained in the stomach, despite the
other excipients used in the formulation. The represen- action of peristalsis and forcible housekeeping waves
tative spectra of CC and tablet mixture are captured in compared to the conventional tablets. As the tablets are
Figure 4. No significant difference was noted in the well-retained in the stomach proximal to the absorption
Table 6: Responses of the optimized formulation on real time stability studies (25°C, 60% RH)
Condition Time point Content uniformitya (%) Floating lag time (min)a Release at 1 h (%)a Release at 6 h (%)a
25°C/60% RH Initial 94.56 ± 0.81 2.89 ± 1.87 27.28 ± 0.73 88.81 ± 1.54
1M 96.01 ± 0.93 3.02 ± 0.98 25.81 ± 1.85 86.37 ± 2.03
3M 95.41 ± 0.57 2.96 ± 0.31 26.09 ± 1.54 88.41 ± 1.45
6M 94.85 ± 0.62 2.99 ± 2.53 27.44 ± 1.29 88.56 ± 1.30
a
Each data point represents mean ± S.D (n = 3).Gastroretentive bilayer tablets of calcium carbonate using D-optimal design 69
Figure 5: Radiographic images portraying the bilayer floating tablet containing barium sulfate as a radio opaque marker in the stomach of
rabbits at 0 h (a), 2 h (b), 4 h (c), and 6 h (d); the tablet is pointed by a circle.
window and probably release the contents in a controlled complied with the official friability limits, devoid of the
manner, they are less likely to saturate the calcium trans- initial burst effect, displayed a short FLT, and resulted in
porters situated in the duodenal region of the gastro- yet a controlled and complete release of calcium by 6 h.
intestinal tract and therefore may exhibit a superior Numerical optimization technique was successfully
bioavailability compared to the conventional tablets. employed to develop optimized formulations by setting
constraints on the responses. The experimental data for
the optimized formulations were found to agree well with
those predicted by the polynomial models proving the
4 Conclusion validity of the models generated. In vivo radiographic
studies of the optimized bilayer tablet formulations in
Floating bilayer tablets of CC were successfully devel- rabbits revealed that floating tablets were found to be
oped employing D-optimal design. Of the three formula- retained in the stomach for 5.5 ± 1 h. The studies collec-
tion factors investigated, the levels of HPMC E15 LV tively proved that bilayer gastroretentive tablets posses-
used as a binder in the CC layer significantly affected sing floating properties would be highly promising drug
the friability, FLT, and release of calcium. The batches delivery platform for nutrients and therapeutic agents
F2, F8, and F13 that contained moderate to high amount with absorption window in the upper part of the gastro-
of binder were found to be most suitable as they were intestinal tract.70 Manasa Moganti and Shivakumar H. Nanjappa
Acknowledgments: Authors are thankful to KLE College Asian J Pharm Sci. 2016;11(5):575–84. doi: 10.1016/
of Pharmacy, Bengaluru, India, for providing facility to j.ajps.2016.04.007.
do this work in the campus. (12) Indian Pharmacopoeia. The Controller of Publication, Ministry
of Health and Family Welfare. 4th edition; 1996. p. 736.
(13) Lachmann L, Liberman HA. The theory and practice of indus-
Research funding: Authors state no funding involved. trial pharmacy. Special Edition. New Delhi: CBS Publishers and
Distributors Pvt. Ltd; 2009. p. 296.
Author contribution: Manasa Moganti: Writing – original (14) Muralidhar N, Chandra Sekhar Rao G, Prabhakar, Reddy V.
draft; Shivakumar H. Nanjappa: Formal analysis, Formulation and evaluation of gastroretentive dosage forms of
clarithromycin. AAPS Pharm Sci Tech. 2008;9(1):231.
Visualization, Project administration, Final draft.
doi: 10.1208/s12249-008-9038-8.
(15) Dipak DG, Kalpana S, Sadhana RS. Investigation and optimi-
Conflict of interest: Authors state no conflict of interest. zation of the effect of polymers on drug release of norfloxacin
from floating tablets. Polim Med. 2016;46(2):117–27.
doi: 10.17219/pim/68170.
(16) The USP 27-NF 22. United States pharmacopoeial convention.
Rockville, MD. 2004. p. 2621.
References (17) Anil Kumar RA, Chandra Sekhara Rao G, Prabhakar, Reddy V.
Formulation and evaluation of swellable and floating
(1) Gaby K, Maike W, Andreas H. Bioavailability and solubility of gastroretentive ciprofloxacin hydrochloride tablets. AAPS
different calcium-salts as a basis for calcium enrichment of Pharm Sci Tech. 2009;10(1):220–6. doi: 10.1208/s12249-009-
beverages. Food Nutr Sci. 2010;1:53–8. doi: 10.4236/ 9200-y.
fns.2010.12009. (18) Peter D, Sandor N, Szilard P, Tivader P, Bela K, Ferenc B, et al.
(2) Diriba BK, Edward Joy JM, Louise AE, Michael JW, Scott DY, Preformulation studies and optimization of sodium alginate
Sue W, et al. Dietary calcium and zinc deficiency risks are based floating drug delivery system for eradication of
decreasing but remain prevalent. Sci Rep. 2015;5:10974. Helicobacter pylori. Eur J Pharm Biopharm. 2015;96:196–206.
doi: 10.1038/srep10974. doi: 10.1016/j.ejpb.2015.07.020.
(3) Christian M, Kraenzlin ME. Calcium supplementation, osteo- (19) Wagner JG. Interpretation of percent dissolved-time plots
porosis and cardiovascular disease. Swiss Med Wkly. derived from in vitro testing of conventional tablets and cap-
2011;141:w13260. doi: 10.4414/smw.2011.13260. sules. J Pharm Sci. 1969;58(10):1253–7. doi: 10.1002/
(4) Cashman KD. Calcium intake, calcium bioavailability and bone jps.2600581021.
health. Br J Nutr. 2002;87(2):S169–77. doi: 10.1079/BJN/ (20) Gibadi M, Feldman S. Establishment of sink condition in dis-
2002534. solution rate determination: theoretical consideration appli-
(5) Uma NP, Pahuja DN, Samuel AM. Calcium bioavailability: an cation to non-disintegrating dosage forms. J Pharm Sci.
in vivo assessment. Nutr Res. 2001;21:667–75. doi: 10.1016/ 1967;56(10):1238–42. doi: 10.1002/jps.2600561005.
S0271-5317(01)00278-0. (21) Higuchi T. Mechanism of sustained-action medication: theo-
(6) Tsugawa N, Okano T, Higashino R, Kimura T, Oshio Y, retical analysis of rate of release of solid drugs dispersed in
Teraoka Y, et al. Bioavailability of calcium from calcium car- solid matrices. J Pharm Sci. 1963;52:1145–9. doi: 10.1002/
bonate, DL-calcium lactate, L-calcium lactate and powdered jps.2600521210.
oyster shell calcium in vitamin D-deficient or replete rats. Biol (22) Samia MO, Fathy IA, Noha MA. Preparation and optimization of
Pharm Bull. 1995;18(5):677–82. doi: 10.1248/bpb.18.677. fast-disintegrating tablet containing naratriptan hydro-
(7) Anroop BN, Ashish K, Mahesh A, Bandar EA. Enhanced oral chloride using D-optimal mixture design. AAPS Pharm Sci
bioavailability of calcium using bovine serum albumin micro- Tech. 2018;19(6):2472–87. doi: 10.1208/s12249-018-1061-9.
spheres. Drug Deliv. 2012;19(6):277–85. doi: 10.3109/ (23) Tanja V, Djordje M, Edina V, Zorica P, Marko K, Jelena D, et al.
10717544.2012.704094. Development of ternary solid dispersions with hydrophilic
(8) Heaney RP, Dowell MS, Barger MJ. Absorption of calcium as polymer and surface adsorbent for improving dissolution rate
the carbonate and citrate salts, with some observations on of carbamazepine. Saudi Pharm J. 2018;26(5):725–32.
method. Osteoporos Int. 1999;9(1):19–23. doi: 10.1007/ doi: 10.1016/j.jsps.2018.02.017.
s001980050111. (24) Noushin B, Naghmeh H, Seyed MF, Bijan S. Development and
(9) Shoufeng L, Senshang L, Bruce PD, Haresh LM, Yie WC. Effect optimization of a sublingual tablet formulation for physostig-
of HPMC and Carbopol on the release and floating properties mine salicylate. Acta Pharm. 2009;59:301–12. doi: 10.2478/
of Gastric Floating Drug Delivery System using factorial v10007-009-0028-5.
design. Int J Pharm. 2003;25:13–22. doi: 10.1016/S0378- (25) Vamshi Vishnu Y, Chandrasekhar K, Ramesh G,
5173(02)00642-7. Madhusudan, Rao Y. Development of mucoadhesive patches
(10) Shoufeng L, Senshang L, Bruce PD, Haresh LM, Yie WC. for buccal administration carvedilol. Curr Drug Deliv.
Statistical optimization of gastric floating system for oral 2007;4(1):27–39. doi: 10.2174/156720107779314785.
controlled delivery of calcium. AAPS Pharm Sci Tech. (26) Ramesh CN, Devendra NR, Pandit JK. In vitro release kinetics
2001;2(1):11–22. doi: 10.1208/pt020101. and bioavailability of gastroretentive cinnarizine hydro-
(11) Uttam Kumar M, Bappaditya C, Faria GS. Gastro-retentive drug chloride tablet. AAPS Pharm Sci Tech. 2010;11(1):294–303.
delivery systems and their in vivo success: a recent update. doi: 10.1208/s12249-010-9380-5.Gastroretentive bilayer tablets of calcium carbonate using D-optimal design 71
(27) Safwan AR, Paul AC, Amal AE. Design and evaluation of effer- volunteers. Eur J Pharm Biopharm. 2010;74(2):332–9.
vescent floating tablets based on hydroxyethyl cellulose and doi: 10.1016/j.ejpb.2009.11.010.
sodium alginate using pentoxifylline as a model drug. Drug (31) Xiaoqiang X, Minjie S, Feng Z, Yiqiao H. Floating matrix dosage
Des Dev Ther. 2015;9:1843–57. doi: 10.2147/DDDT.S78717. form for phenoporlamine hydrochloride based on gas forming
(28) Brijesh SD, Avani FA, Madhabhai MP. Gastroretentive drug agent: in vitro and in vivo evaluation in healthy volunteers. Int J
delivery system of ranitidine hydrochloride: formulation and Pharm. 2006;310(1–2):139–45. doi: 10.1016/
in vitro evaluation. AAPS Pharm Sci Tech. 2004;5(2):77–82. j.ijpharm.2005.12.003.
doi: 10.1208/pt050234. (32) Vijay SC, Sadhana S, Swapnil C. Development of sustained
(29) Pallavi R, Deshvir S, Kamla P. Bifunctional capsular dosage release gastroretentive tablet formulation of nicardipine
form: novel funicular cylindrical gastroretentive system of hydrochloride using quality by design (QbD) approach. Drug
clarithromycin and immediate release granules of ranitidine Dev Ind Pharm. 2018;44(5):787–99. doi: 10.1080/
HCl for simultaneous delivery. Int J Pharm. 2014;461(1- 03639045.2017.1413111.
2):310–21. doi: 10.1016/j.ijpharm.2013.11.053. (33) Bansal S, Beg S, Garg B, Asthana A, Asthana G, Singh B.
(30) Tadros MI. Controlled-release effervescent floating matrix QbD-oriented development and characterization of effervescent
tablets of ciprofloxacin hydrochloride: development, optimi- floating-bioadhesive tablets of cefuroxime axetil. AAPS Pharm Sci
zation and in vitro–in vivo evaluation in healthy human Tech. 2016;17(5):1086–99. doi: 10.1208/s12249-015-0431-9.You can also read