Fragmentation by major dams and implications for the future viability of platypus populations
←
→
Page content transcription
If your browser does not render page correctly, please read the page content below
Fragmentation by major dams and implications for the future
viability of platypus populations
Jose Mijangos ( luis.mijangos@gmail.com )
University of Canberra https://orcid.org/0000-0001-6121-4860
Gilad Bino
University of New South Wales
Tahneal Hawke
UNSW Sydney
Stephen Kolomyjec
Lake Superior State University https://orcid.org/0000-0002-2041-9875
Richard Kingsford
University of New South Wales
Harvinder Sidhu
UNSW Canberra
Thomas Grant
UNSW Sydney
Jenna Day
The University of Sydney
Kimberly Dias
The University of Sydney
Jaime Gongora
The University of Sydney
William Sherwin
University of New South Wales https://orcid.org/0000-0002-1578-8473
Article
Keywords:
Posted Date: April 14th, 2022
DOI: https://doi.org/10.21203/rs.3.rs-1406456/v1
License: This work is licensed under a Creative Commons Attribution 4.0 International License. Read Full License
Page 1/16
Abstract
Populations of the evolutionarily unique platypus (Ornithorhynchus anatinus) have experienced major declines and local extinctions
from a range of historical and recent interacting threats, including fur trade, land clearing, water resource developments (dams and
extractions), invasive species, fire, pollution, and urbanisation. Although spending most of their time in the water, platypuses can
move over land. Nevertheless, significant uncertainties remain whether major dams across the platypus’ distribution pose barriers to
movement, limiting gene flow and dispersal, which are essential evolutionary and ecological processes. Here we examined disruption
of gene flow between platypus groups below and above major dams (wall height > 10 m). Platypuses were surveyed above and
below five major dams, matched to four adjacent rivers without major dams. Genetic differentiation (FST) across dams was 4- to 20-
fold higher than along similar stretches of adjacent undammed rivers; FST across dams was similar to differentiation between
adjacent river systems. This indicates that major dams represent significant barriers for platypus movements. Furthermore, FST
between populations was significantly correlated with the year in which the dam was built, increasing by 0.011 every generation (7.9
years), reflecting the effects of these barriers on platypus genetics. This study provides evidence of gene flow restriction, which
jeopardises the long-term viability of platypus populations when populations are fragmented by major dams. Alternatives to large
dam construction, such as building of by-pass structures and translocation between upstream and downstream populations, should
be considered in water conservation and management planning.

Introduction
The semi-aquatic platypus (Ornithorhynchus anatinus), along with echidnas, belong to the order Monotremata, the most species-
scarce (n = 5) and most basal branch of the mammalian group, which diverged from marsupials and eutherians 187 Mya (Zhou et
al., 2021). Platypuses have a unique combination of features, including oviparity, venomous spurs in males, electroreception used to
locate freshwater macroinvertebrates, biofluorescent pelage, and multiple sex chromosomes (five pairs instead of one; Veyrunes et
al., 2008; Bino et al., 2019; Anich et al., 2021). The uniqueness and rarity of platypus features (sensu Pavoine et al., 2005) and the
longest evolutionary history in mammals (97.6 million years; Isaac et al., 2007) make it arguably the most irreplaceable mammal
existing today.

There is increasing evidence of larger numbers of platypuses in historical times and ongoing declines and extinctions of local
populations (Grant & Fanning, 2007; Bino et al., 2019; Hawke et al., 2019; Bino et al., 2020). Declines are likely driven by multiple and
synergistic threats, including river regulation, habitat modification, climate change, pollution, by-catch mortality, and predation by
invasive species (Grant & Fanning, 2007; Bino et al., 2019; Hawke et al., 2019; Bino et al., 2020). Continued declines due to current
and future climate change are predicted as a result of increased frequency and severity of droughts (Bino et al., 2019; Bino et al.,
2021; Hawke, Bino, & Kingsford, 2021a), as well as elevated temperature conditions which could lead to the loss of more than 30% of
suitable habitat by 2070 (Klamt et al., 2011; Hawke, Bino, & Kingsford, 2021a).

The platypus is currently listed as ‘Near Threatened’ by the International Union for Conservation of Nature (IUCN; Woinarski &
Burbidge, 2016), ‘Endangered’ in South Australia (National Parks and Wildlife Act 1972), ‘Vulnerable’ in Victoria (Victoria Government
Gazette, 2021). Past threats include hunting for fur, while present threats include extensive habitat degradation by agriculture and
urbanisation, regulation of water flows, by-catch mortality in fishing gear, diseases, and predation by invasive foxes and dogs (Grant
& Temple-Smith, 2003; Bino et al., 2019; Hawke, Bino, & Kingsford, 2021a).

Moreover, all these threats have possibly been intensified by the construction of major dams that have immediate and long-term
effects, being one of the more serious threats for platypus conservation, given their likely broad impact on habitat (Grant & Temple-
Smith, 2003; Bino et al., 2019; Hawke, Bino, & Kingsford, 2021a). Major dams are widespread across much of the platypus
distribution, where as many as 77% (383 out of 495) of the Australian major dams (wall height > 10 m; ancold.org.au) coincide within
the regions where platypuses occur (Fig. 1a; see also Bino et al., 2020). Immediate adverse effects of major dams extend over large
areas both upstream and downstream. Water impoundments behind major dams form wind-exposed, deep, and standing (lentic)
ecosystems. Below major dams, altered natural flow regimes can significantly impact platypus abundances and demographics
(Hawke, Bino, & Kingsford, 2021b). Conditions below and above major dams represent poor foraging and burrowing habitat for
platypuses, given lower productivity of macroinvertebrate prey species (Grant & Llewellyn, 1991; Bethge et al., 2003; Grant, 2004;
Grant & Fanning, 2007; Marchant & Grant, 2015).

                                                               Page 2/16
Long-term effects of major dams include reduction in the ability of platypuses to move between potential habitat areas. This
fragmentation has twofold effects; first, it restricts the ability to recolonise available habitat or migrate to areas with more suitable
conditions (Baguette et al., 2013). Secondly, and importantly, fragmentation also simultaneously reduces both local population size
and gene flow, each of which is expected to lead to increased inbreeding and reduction of the genetic variation necessary for
adaptation to changes including threats (Frankham et al., 2017). One adverse consequence of small population size is lower survival
and lower reproduction output due either to inbreeding depression or to catastrophic stochastic events. Another adverse
consequence is reduced variation between individuals, necessary for adaptation to changes such as the threats listed above
(Frankham, 2015). These genetic changes may be prevented by immigration because gene flow replenishes the gene pool of
populations, but of course, this will only happen if the small population is not a fragmented isolate (Garant et al., 2007; Tigano &
Friesen, 2016).
For platypuses, major dams are predicted to be a barrier for dispersal (Kolomyjec, 2010; Furlan et al., 2013), with potential long-term
ramifications for gene flow, genetic variation, and adaptation to threats as described above. However, both the restriction of dispersal
and the genetic consequences remain largely unquantified. Population viability analyses suggest significant impacts by major dams,
particularly in synergy with lower habitat quality and droughts, which are projected to increase (Bino et al., 2020). However, the extent
to which major dams restrict platypus dispersal remains unclear because landscape connectivity varies due to both the species’ life
history and landscape features (Baguette et al., 2013). Platypuses are known to climb around dams up to 10m high (Jenolan Karst
Conservation Reserve Newsletter, https://sway.office.com/qI6BOrvW8CO5vS8i?ref=email), although their ability to find their way
around higher structures is currently unknown. Their ability to swim across the large deep-water impoundments above the dam is
unclear.
Therefore, our research uses genetic methods to focus on the connectivity of platypus populations above and below major dams.
Genetic-based methods used to infer patterns of dispersal and gene flow (Balkenhol et al., 2015) commonly examine the positive
relationship between the amount of genetic differentiation between populations or individuals and the geographic distance
separating them (Ramachandran et al., 2005). The presence of a dispersal barrier could be inferred by testing whether populations or
individuals, separated by potential barriers, are more genetically differentiated than populations or individuals in landscapes lacking
such barriers but separated by a similar distance. Genetic differentiation can increase due to dispersal barriers within one to 15
generations during simulations (Landguth et al., 2010), but is unlikely to arise if population size is large (> 50 individuals) or if the
species lifespan is long (> 22 years; Hoffman et al., 2017).
To determine whether major dams have reduced dispersal and gene flow between platypus groups, we analysed genetic data from
platypuses sampled in nine rivers; five rivers were regulated by major dams, and four were unregulated (Fig. 1). If major dams
adversely affected gene flow between platypus groups, we predicted the following: a) individuals and groups separated by a major
dam in a river should be more differentiated than in an unregulated river, and; b) genetic differentiation across major dams should
correlate with the time since the dam was built.
Methods
Study areas and fieldwork
Samples from platypuses were collected from nine different rivers (five regulated by major dams and four unregulated) across four
regions in south-east Australia (see Fig. 1 and Table 1), also described in Hawke et al., (2021b) Kolomyjec et al. (2008, 2009). River
flows upstream of major dams were minimally regulated, contrasting with heavily regulated downstream flows. Throughout their
range, the platypus comprises four major geographically defined genetic clusters: North Queensland, central Queensland, New South
Wales and Tasmania (Martin et al., 2018). The samples used in this study belong to the New South Wales cluster.
Page 3/16Table 1
The four study systems and the major dams. See Fig. 1 for details of geography. The letters c, d, e and f refer to panels
in Fig. 1.
Region River/Creek Dam name Year of completion Dam height (m) Dam volume (GL)
Upper Murray Riversc Ovens - - - -
Mitta-Mitta Dartmouth 1979 180 3,856
Snowy Riversd Snowy Jindabyne 1967 72 688
Thredbo - - - -
Eucumbene Eucumbene 1958 116 4,798
Central NSW Riverse Wingecarribee - - - -
Nepean Nepean 1935 85 68
Border Riversf Tenterfield - - - -
Severn Pindari* 1969 85 312
GL - Gigalitres.
* Pindari Dam. The height of the dam wall was doubled from 45m to 85m in 1995.
Platypuses were captured across 81 sites (Fig. 1). In this study, we used two different molecular markers: single nucleotide
polymorphism (SNPs) for all samples except Central NSW, and microsatellites for Central NSW (Kolomyjec et al., 2008; Kolomyjec et
al., 2009). Sampling for microsatellites in Central NSW is described in Kolomyjec et al. (2008, 2009). For SNPs at all other sites, we
aimed to cover a minimum of 40 km of each unregulated river and 20 km of river above and below major dams on regulated rivers.
The procedure of trapping and sampling platypuses, including details of anaesthesia, used in this study have been described
elsewhere (Bino et al., 2018; Hawke, Bino, & Kingsford, 2021b). Briefly, platypuses were captured using fyke nets or unweighted mesh
(gill) nets and implanted with a Passive Integrated Transponder (PIT) tag (Trovan) to identify recaptured individuals. Platypuses were
then weighed, measured, sexed, aged, and blood collected (~2 ml) and stored in Qiagen RNAprotect® animal blood tubes (Qiagen,
Hilden, Germany). For the SNP sampling, our proxy of abundance for each river was the following metric: unique number of
captures/number of sampling nights x length of the river surveyed (see Hawke, Bino, & Kingsford, 2021b).
Laboratory work
For SNPs (single nucleotide polymorphisms), Genomic DNA was extracted from whole blood using a Qiagen DNeasy Blood and
Tissue kit (Qiagen, Hilden, Germany). DNA quality and concentration were visualised using agarose gel electrophoresis and
quantified fluorimetrically with a Qubit 2.0 (Thermo Fisher Scientific). Samples were genotyped using DArTseq™ (DArT Pty Ltd,
Canberra, ACT, Australia). DArT’s procedure uses a combination of genome complexity reduction methods using restriction enzymes,
implicit fragment size selection and next-generation sequencing to produce thousands of SNPs randomly distributed throughout the
genome (Kilian et al., 2012). Read sequences were processed using proprietary DArT analytical pipelines (Kilian et al., 2012) and
mapped to the representative platypus genome (mOrnAna1.p.v1, GenBank assembly accession: GCA_004115215.2; total sequence
length of 1.8 Gbps, 305 scaffolds with an N50 of 83 Mbp). Refer to Georges et al. (2018) for details of DArT sequencing, genotyping
and filtering processes. DArT’s genotyping has various advantages such as limiting the potential for ascertainment bias (Steane et
al., 2011), providing metadata for each locus with various quality and BLAST alignment measures, including the proportion of
replicates for which the marker score is consistent (RepAvg) and the average of the polymorphism information content of the
reference and SNP allele (AvgPIC).
For microsatellites, DNA was extracted from toe-web biopsies (2 x 2 mm specimens stored in 70% ethanol) using a proteinase K/salt
precipitation method (Sunnucks & Hales, 1996). Twelve published microsatellite sites were amplified and scored according to
standard techniques (Kolomyjec et al., 2008; Kolomyjec et al., 2009).
SNP filtering
The criterion for SNP filtering used to analyse variation between populations (e.g., FST) can bias estimates of variation within
populations (e.g., heterozygosity; Schmidt et al., 2020). Therefore, we used different filtering settings for each type of analysis
Page 4/16(Table 2).
Table 2
Filters and their thresholds used for SNPs to remove sites for the analyses based on variation between
groups and variation within groups.
Filter Variation between groups Variation within groups
Reproducibility (RepAvg) > 100% > 100%
Retain only one SNP per read Used Used
Departure from Hardy-Weinberg proportions < 0.05 < 0.05
Mapped to chromosome Used Used
BLAST alignment E-value < 1e-20 < 1e-20
Missing data by site > 90% > 100%
Missing data by individual > 90% > 100%
Minor allele count (MAC) >3 Not used
Linkage disequilibrium (r2) < 0.2 Not used
Remove sites located within coding regions Used Not used
Remove sites located within sex chromosomes Not used Used
Monomorphic sites Used Not used
Total SNPs after filtering 2,252 4,790
We first describe the filters applied to the entire SNP dataset, then those applied for analyses of variation between groups, and finally
the filters applied to analyses of variation within groups. The filtering was performed using the R (R Core Team, 2021) package dartR
(Gruber et al., 2018).
Filters applied to the entire SNP dataset. Because filtering for Hardy-Weinberg proportions requires the delimitation of populations or
groups, we assigned individuals a priori into groups, based on the river that individuals were sampled and whether they were
sampled below or above major dams. To reduce genotyping errors that might have arisen during library preparation and SNP
calling (O'Leary et al., 2018), we discarded sites that had a reproducibility of less than 100% (RepAvg). We also discarded sites if the
read had more than one SNP; or showed a significant departure from Hardy-Weinberg proportions within any one group after
Bonferroni correction with a p-value of less than 0.05; or was not mapped to a chromosome and had a BLAST alignment E-value of
less than 1X10-20.
Filters applied to analyses of genetic variation between groups in the SNP dataset. We discarded sites with more than 10% of
missing data and then discarded individuals with more than 10% of missing data. By discarding sites based on minor allele
frequency (i.e., proportion, MAF), there is the potential to alter subsequent analyses (Linck & Battey, 2019). Therefore, we discarded
sites with a minor allele count (MAC) of less than three. Because physical linkage between sites can affect analyses of genetic
structure (Abdellaoui et al., 2013), we removed one of two sites if they were in linkage disequilibrium (LD). For this, we used a
threshold of the LD statistic r2 (Hill & Robertson, 1968) of > 0.2 and the clumping algorithm using the R package bigsnpr (Privé et al.,
2018). Then the SNP with lower polymorphic information content (AvgPIC) was discarded. Selectively neutral sites are better suited
to infer population dynamics, such as dispersal, than sites under selection because they allow separation from potential
confounding factors arising from natural selection (Holderegger & Wagner, 2008). Consequently, we removed sites located within
coding regions using the GFF (General Feature Format; ref_mOrnAna1.p.v1_top_level.gff3) file retrieved from Ensembl
(www.ensembl.org; Yates et al., 2020). Despite 3rd position SNPs usually being silent (i.e., synonymous mutations), we also filtered
out these SNPs for two reasons. Firstly, recent research suggests that synonymous mutations also affect fitness (Lebeuf-Taylor et
al., 2019). Secondly, natural selection can affect not only genetic variation with direct consequences on fitness but can also affect
Page 5/16adjacent neutral genetic variation due to genetic linkage (Smith & Haigh, 1974). We also discarded sites monomorphic within each
group.
Filters applied to analyses of genetic variation within groups in the SNP dataset. When sites with missing data are not removed,
observed (Ho) and expected heterozygosity (He) estimates diverge (Schmidt et al., 2020); accordingly, we removed sites with missing
data. He is generally lower for SNPs with rare alleles than for SNPs with common alleles (Schmidt et al., 2020). Therefore we did not
filter out sites using minor allele count (MAC). Because filtering out sites based on linkage disequilibrium results in a decrease of rare
and monomorphic alleles and excess of the common alleles and therefore biases estimates of He (Dementieva et al., 2021), we did
not remove sites that were in linkage disequilibrium. Estimates of He should reflect as much as possible genome-wide patterns
(Miller et al., 2014). Therefore we kept sites located outside and inside coding regions. We removed sites in sex chromosomes for
two reasons. Firstly, He in sex chromosomes differs from He in autosomes because sex chromosomes occur in different proportions
in males and females (Schaffner, 2004). Secondly, the platypus has five pairs of sex chromosomes (Veyrunes et al., 2008), which will
bias the overall estimation of He. Including monomorphic sites to estimate He reduces the bias from sample size (Schmidt et al.,
2020); consequently, we retained all monomorphic sites. Finally, relatedness analyses using the R package related (Pew et al., 2015)
were performed to identify any recaptures not identified or mislabelling in the field or the laboratory.
For SNPs, a total of 295 platypuses were captured and blood sampled across four river regions in southeast Australia (Extended
Data Table 2). DNA extraction and DArTTM sequencing were successful in 218 blood samples from individuals. Two samples, each
collected in a different river (V30 in Ovens and V32 in Mitta Mitta), showed contrasting genetic patterns relative to samples collected
in the same river (Extended Data Figure 1). Relatedness analyses performed in the R package related (Pew et al., 2015) revealed
these two samples had closer relatives in the opposite river (Extended Data Table 1). Additionally, the locations of these two samples
were separated by 46 Km, steep mountainous terrain, and a river system. Under these conditions, we considered that dispersal events
were unlikely and concluded that samples were mislabelled and therefore assigned them to the presumed correct river and site.
Relatedness analyses also identified two pairs of samples in which each pair was collected from the same individual (i.e., recaptures;
samples T3-T5 and T28-T42; Extended Data Table 1). Consequently, we removed one sample from each pair. In the unlikely event
that these were pairs of identical twins, it would still be appropriate to remove one of each pair.
For SNPs, sequencing provider DArT™ (Canberra) successfully genotyped 17,631 single nucleotide polymorphism (SNP) sites. After
stringent filtering, our dataset for analysing genetic variation between populations comprised 2,252 SNPs genotyped in 214 platypus
samples (108 females, 106 males). After filtering, our SNP dataset for analysing genetic variation within populations comprised
4,790 SNPs genotyped in 214 platypus samples (108 females, 106 males).
Data analyses
Genetic variation within groups
To measure genetic variation within rivers, we calculated observed heterozygosity (Ho), expected heterozygosity (He) and allelic
richness using the R package Hierfstat (Goudet, 2005). After identifying that the data did not conform to a normal distribution, using
a Shapiro-Wilk test of normality (R function shapiro.test), we tested whether He was significantly different between groups using a
non-parametric Mann-Whitney U test (R function wilcox.test with option paired = FALSE). Additionally, we calculated the inbreeding
coefficient (FIS) of each river group using Hierfstat.
Investigating whether major dams affect connectivity between platypus
groups
We used multiple approaches to investigate whether major dams affect gene flow between platypus groups. Firstly, to test whether
groups separated by major dams are more genetically different than otherwise, we divided the sampling sites of each pair of rivers
into comparable upstream and downstream groups. For regulated rivers (Nepean, Severn and Mitta-Mitta), the dam, ignoring the
reservoir, was used as reference point for the division. For unregulated rivers (Wingecarribee, Tenterfield and Ovens), the division
point was chosen at a comparable position to the dam in the paired regulated river. We then calculated the genetic differentiation
using Weir & Cockerham’s FST estimator (1984) between the two groups within each river. We tested the significance of the difference
of FST values between dammed and unregulated rivers using a Mann-Whitney U test (R function wilcox.test with option paired =
Page 6/16FALSE). Additionally, we used Mutual Information (Sherwin et al., 2017) and Jost’s D (Jost, 2008) two measures that assess
between-group differentiation independently of within-group variation.
Secondly, to test whether the number of platypus generations since the building of the dams can predict the genetic differentiation of
SNPs and microsatellites between populations (FST), we used univariate linear regression models (R function lm). We considered one
platypus generation to be 7.9 years based on Pacifici et al. (2013), who used information on age at first reproduction and
reproductive life span to estimate generation length in platypus.
Thirdly, to visualise the spatial distribution of genetic variation of the sampled individuals, we performed principal component
analysis (PCA) using the R package dartR (Gruber et al., 2018) using our two datasets of SNP’s and microsatellites. PCA is a
statistical method that summarises the variance in the data and projects the top principal components onto a series of orthogonal
axes (McVean, 2009). PCA is a method that does not rely on any genetic model or principle, but spatial patterns revealed by PCA are
mathematically equivalent to coalescent analysis, so that they are representative of evolutionary processes such as genetic
structure, gene flow and founder effects (McVean, 2009).
Results
Genetic variation within groups
Mean SNP genetic variation across all rivers (expected heterozygosity) was He = 0.141. He was significantly different between all
groups within one river system (except for Severn above the dam/Severn below the dam; p-value > 0.05; Table 3). He was also
significantly different between regions (except for Snowy Rivers/Upper Murray Rivers; p-value > 0.05; Table 3). Border Rivers, located
in the north, had the lowest He (range: 0.132–0.138), followed by the Snowy Rivers (0.136–0.143) and the Upper Murray Rivers
(0.143–0.153), river regions in the south (Fig. 1). Estimates of allelic richness follow the same trend as heterozygosity estimates.
Inbreeding estimates (FIS) were close to zero except for the microsatellite dataset (Table 3).
Page 7/16Table 3
Summary genetic statistics across the four rivers regions, the number of samples and a proxy of abundance calculated as (unique
number of captures / number of sampling nights) x (length of the river surveyed) based on Hawke et al., (2021b); Ho - observed
heterozygosity; He - expected Hardy-Weinberg heterozygosity; FIS - inbreeding coefficient.
Region River/Creek Survey Sample Proxy of Allelic Ho SE He SE FIS SE
section size abundance richness
(km)
Upper Ovens 36 19 27 1.295 0.145 0.004 0.146 0.004 0.005 0.006
Murray
Rivers Mitta-Mitta 23 13 19 1.296 0.141 0.005 0.143 0.005 0.011 0.008
above dam
Mitta-Mitta 18 4 4 1.304 0.153 0.007 0.153 0.006 -0.021 0.013
below dam
Snowy Snowy 26 56 46 1.282 0.141 0.004 0.141 0.004 0.007 0.004
Rivers
Thredbo 33 19 37 1.281 0.142 0.004 0.141 0.004 -0.005 0.006
Eucumbene 18 4 36 1.289 0.145 0.006 0.143 0.006 -0.028 0.012
above dam
Eucumbene 20 20 50 1.267 0.137 0.005 0.136 0.005 -0.004 0.007
below dam
Central Wingecarribee* 7 42 ** 4.113 0.703 0.060 0.731 0.044 0.053 0.047
NSW
Rivers Nepean above 0.5 11 ** 3.942 0.549 0.063 0.646 0.064 0.142 0.051
dam*
Nepean below 4 7 ** 4.706 0.589 0.095 0.608 0.059 0.096 0.107
dam*
Border Tenterfield 96 39 207 1.492 0.137 0.005 0.138 0.004 0.011 0.006
Rivers
Severn above 50 23 115 1.453 0.135 0.005 0.134 0.005 -0.008 0.007
dam
Severn below 60 17 83 1.440 0.133 0.005 0.132 0.005 0.000 0.007
dam
* Microsatellite data
SE – standard error
NSW - New South Wales
Note that small sample sizes in Mitta-Mitta below the dam and Eucumbene above the dam (both 4 individuals) are likely to result
in unreliable estimates of diversity.
** Comparable estimates are not available due to different survey techniques see Kolomyjec et al. (2009, 2010 and 2014).
Connectivity between platypus groups – effects of major dams
For unregulated and regulated river comparisons, the river with the dam showed higher genetic differentiation: Mitta-Mitta above
versus below dam had FST = 0.021, whereas Ovens above versus below had FST = 0.001; Nepean below versus above dam had FST =
0.073, whereas Wingecarribee above versus below had FST = 0.016; and Severn below versus above dam had FST = 0.051, whereas
Tenterfield above versus below had FST = 0.009 (Table 4). In each case, the dammed versus undammed FST values differed by more
than two standard errors of the mean; the average FST for the three dammed rivers (0.048) was about five times higher than the
paired undammed rivers (0.0087). The relatively high within-locality variation for microsatellites has the potential to lower FST for
microsatellites relative to SNPs (Meirmans & Hedrick, 2011), however such a trend was not evident – in fact, the opposite trend was
seen. Finally, in the more complex Snowy Rivers system (Fig. 1), this simple paired FST analysis was not easy to interpret, so we relied
upon the other analyses presented below. Using Mutual information and Jost’s D to assess genetic differentiation with and without
major dams gave results that were comparable to those from FST (Extended Data Tables 3–6).
Page 8/16Table 4
Genetic differentiation (FST) between rivers in different connectivity scenarios.
Region River 1 River 2 FST SE Connectivity scenario
Border Rivers Tenterfield Severn above dam 0.059 0.002 Separated by a river system
Tenterfield Severn below dam 0.063 0.002 Separated by a river system
Severn below dam Severn above dam 0.051 0.002 Separated by dam for 47 years (Circa
1969)*
Tenterfield above Tenterfield below 0.009 0.001 No dam
Upper Murray Ovens Mitta-Mitta above 0.045 0.002 Contiguous river systems
Rivers dam
Ovens Mitta-Mitta below 0.035 0.003 Contiguous river systems
dam
Mitta-Mitta above Mitta-Mitta below 0.021 0.003 Separated by dam for 39 years (Circa
dam dam 1979)
Ovens above Ovens below 0.001 0.002 No dam
Snowy Rivers Snowy Thredbo 0.024 0.001 Separated by dam for 50 years (Circa
1967)
Snowy Eucumbene above 0.042 0.003 Separated by dam for 59 years (Circa
dam 1958)
Snowy Eucumbene below 0.040 0.001 Separated by dam for 50 years (Circa
dam 1967)
Thredbo Eucumbene above 0.043 0.003 Separated by dam for 59 years (Circa
dam 1958)
Thredbo Eucumbene below 0.030 0.002 Separated by lake for 50 years (Circa
dam 1967)
Eucumbene above Eucumbene below 0.053 0.003 Separated by dam for 59 years (Circa
dam dam 1958)
Central NSW Wingecarribee** Nepean above dam 0.060 0.023 Contiguous river systems
Rivers
Wingecarribee** Nepean below dam 0.062 0.013 Contiguous river systems
Nepean above Nepean below dam 0.073 0.018 Separated by dam for 74 years (Circa
dam** 1935)
Wingecarribee Wingecarribee below 0.016 0.007 No dam
above**
SE - standard error.
* Pindari Dam. The height of the dam wall was doubled from 45m to 85m in 1995.
** Microsatellite data
Over all four river systems, we observed a positive and significant relationship (R2 = 0.719; p-value = 0.008) between FST and the
number of platypus generations since the building of the dam (Fig. 2). We note again that potential bias towards lower FST values
microsatellites than SNPs, mentioned above, was not evident – the oldest dam was in the river system analysed by microsatellites,
and this system showed the highest FST (Fig. 2). The regression is also significant if this system is excluded (data not shown).
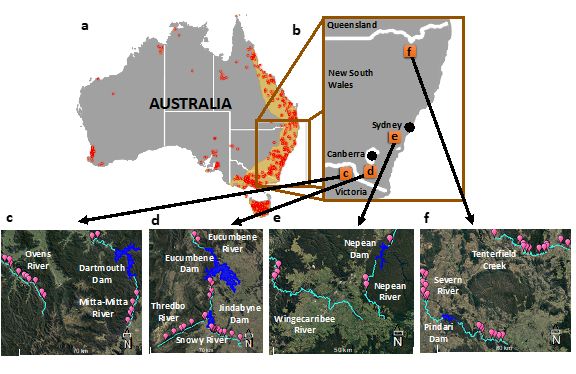
PCA analyses of the Upper Murray Rivers (Mitta Mitta and Ovens Rivers) did not show complete separation of samples for different
locations, but there was noticeable clustering of platypuses into three groups: all Ovens river (unregulated); below the dam in the
Mitta-Mitta River, and above the dam in the Mitta-Mitta River (Fig. 3a). Snowy Rivers (Snowy, Thredbo and Eucumbene Rivers) did
not follow the paired experimental design due to geographic constraints. PCA analyses showed that platypuses from the Snowy
Page 9/16River formed a separated cluster to that of the Thredbo and Eucumbene Rivers (Fig. 3b), whereas platypuses from the two latter
rivers overlapped somewhat on the PCA plot. Notably, platypuses from the Eucumbene River above the dam were closer to
platypuses from Thredbo River than platypuses from the Eucumbene River below the dam. PCA analyses of the central New South
Wales Rivers (Nepean and Wingecarribee Rivers) showed that platypuses from below and above the dam in the regulated Nepean
River formed separated clusters in contrast to platypuses sampled at the unregulated Wingecarribee River, which forms only one
cluster (Fig. 3c). For the Border Rivers (Tenterfield Creek and Severn River), the principal component analysis (PCA) of these rivers
indicated three well-separated clusters (Fig. 3d), with platypuses collected below and above the dam in the Severn River, and
Tenterfield Creek forming different groups.
Discussion
Dispersal and gene flow are essential for the viability of natural populations, critical for ecological and evolutionary processes such
as recolonisation, dispersal to suitable habitats, increased genetic diversity to avoid inbreeding depression and allow adaptation
(Garant et al., 2007; Baguette et al., 2013; Tigano & Friesen, 2016). Our analyses suggest that major dams are barriers to platypus
dispersal and gene flow, because genetic differentiation increased proportionally with time after the building of a dam and was
higher in dammed than undammed rivers.
In relation to whether major dams affect the connectivity between platypus groups, FST values were higher when there was a dam,
and some FST values between groups separated by a dam were as high as FST values between groups in different rivers (Table 4).
Additionally, we found a significant association between FST and the number of platypus generations since dam construction
(Fig. 2), suggesting that FST increases at a rate of 0.011 by generation. Even though the Nepean dam, built in 1935, was analysed
with a different type of molecular marker (microsatellites, not SNPs), recent research indicates that estimates of FST using SNPs and
microsatellites are comparable (Lemopoulos et al., 2019; Sunde et al., 2020). If anything, we would expect the microsatellites used in
this system to have lower FST due to the effect of their high within-population variation (Meirmans & Hedrick, 2011; Sherwin et al.,
2017), but in fact the opposite trend was seen. We noticed that FST values in the Snowy Rivers were higher between groups separated
by the Jindabyne Dam (Eucumbene below dam / Snowy; FST = 0.04) than between groups divided by the Jindabyne reservoir but not
a dam (Eucumbene below dam / Thredbo; FST = 0.03). This observation suggests that some limited gene flow might have occurred
across the Jindabyne reservoir.
Overall, our results are consistent with the notion that major dams and their associated waterbodies may be considerable barriers for
platypuses. Despite platypuses being able to move substantial distances (e.g., male juveniles can move > 40 km; Serena & Williams,
2013; Hawke, Bino, Kingsford, et al., 2021a; Hawke, Bino, Kingsford, et al., 2021b), the effect of major dams on genetic differentiation
was considerable. Contrastingly, major dams did not increase genetic differentiation in the blackfish (Gadopsis marmoratus), a non-
migratory and low-mobility freshwater fish species in eastern Australia, possibly because blackfish population sizes were not small
enough to create this effect during the time since dams were built in the blackfish range (Coleman et al., 2018).
Major dams represent dispersal barriers for most freshwater species (Søndergaard & Jeppesen, 2007; Nislow et al., 2011), requiring
mitigation strategies to offset negative demographic impacts. For instance, human-mediated relocation of individuals between
populations has been implemented successfully to limit the effects of population isolation and small population size (Hoffmann et
al., 2020). A common rule of thumb in conservation suggests that one dispersing individual per generation would minimise the
effects of population isolation (Mills & Allendorf, 1996). Another strategy to improve connectivity between populations, despite some
limitations and caveats, is the construction of dam passages that increase dispersal of freshwater species, including platypuses
(Broadhurst et al., 2013; Brown et al., 2013; Silva et al., 2018), although there are adverse consequences of connectivity, such as
disease risks (Sainsbury & Vaughan-Higgins, 2012). Efforts to maintain flow regimes, riparian revegetation and urban stormwater
management are an essential part in the conservation of the platypus (Coleman et al., 2022).
We have found that platypus population connectivity is adversely affected by major dams, and it is known that reduced connectivity
can lead to the adverse long-term conservation outcomes described above (Garant et al., 2007; Baguette et al., 2013; Tigano &
Friesen, 2016; Frankham, 2015 Frankham et al. 2017). Therefore there will be a need for the management of platypus to consider
ways such as those just described to minimise detrimental effects of river regulation on the platypus (and other species). Some of
the long-term effects of major dams might be reduced by rare natural dispersal events between rivers (Kolomyjec et al., 2014), but
Page 10/16our results indicate that this has not been enough to offset the divisive effect of the major dams, so more active management is
required. Firstly, new dams within the platypus distribution need to be avoided, for example, by pumping from the river into an off-
stream storage without the necessity for a dam on the river itself, as is done in both the Manning and Hastings Rivers. Secondly, for
existing major dams, it might be possible to devise platypus-specific versions of methods that have been used to ameliorate dam
effects in other species, such as human-mediated relocation of individuals or dam passages that increase dispersal.
Conclusion
We compared regulated rivers, with major dams, to adjacent unregulated rivers with no major dams and identified that major dams
were barriers to movement of platypuses within a river system, reflected in genetic variation. Major dams restricted dispersal and
gene flow between groups and therefore increased the possibility of inbreeding depression, loss of adaptive genetic variation, failure
to recolonise areas where local extinctions have occurred and failure to disperse to areas with more suitable conditions. These are all
expected to lower the long-term viability of the platypus (Bino et al., 2020). Our analyses reinforce the growing evidence on the
negative impacts of major dams on platypus populations. These studies are relevant to inform the decision-making process of
conservation managers and could be used in viability analysis and decision analysis (Drechsler & Burgman, 2004) to develop
strategies that ensure the long-term persistence of the unique platypus.
Declarations
AUTHORS CONTRIBUTIONS
Bill Sherwin, Gilad Bino, Richard Kingsford, Jaime Gongora and others conceived the project and acquired the research funds;
Harvinder Sidhu and Bill Sherwin supervised Luis Mijangos; Jenna Day, Kimberly Noel Dias and Jaime Gongora performed DNA
extraction; Gilad Bino, Tahneal Hawke and Tom Grant carried out fieldwork and collected samples; Stephen Kolomyjec performed the
microsatellite analyses; Luis Mijangos analysed the data; Luis Mijangos wrote the manuscript with support from Bill Sherwin. Tom
Grant and Stephen Kolomyjec first pondered on the possible effect major dams may be having on the genetics of the platypus,
carried out the initial research and encouraged others to further investigate this aspect of platypus conservation. All authors
discussed the results and contributed to the final manuscript.
ACKNOWLEDGMENTS
JLM was funded by a University College Postgraduate Research Scholarship from UNSW Canberra. This study was funded by ARC
Linkage LP150100093, the Taronga Conservation Society, and the Australian Government's Environmental Water Holder. Trapping
and handling of platypuses for the SNP samples were carried out in accordance with guidelines and approved by the NSW Office of
Environment and Heritage (SL101655), NSW Department of Primary Industries (P15/0096-1.0 & OUT15/26392), and UNSW's Animal
Care and Ethics Committee (16/14A). Trapping and handling of platypuses for the microsatellite samples from the Nepean and
Wingecarribee Rivers was approved under the [then] NSW Department of Environment and Climate Change Scientific Research
License # S10478, NSW Department of Primary Industries (DPI) Scientific Research Permit #F84.1245 and NSW DPI Animal
Research Authority - Trim File No. 01/1091. Consent to enter Special Metropolitan [catchment] Areas was provided by the [then]
Sydney Catchment Authority (Reference No. 3008/07934; 2009). We are grateful to Dr Clare Holleley, Dr Simon Watt, Jia Zhou and
Alex Sentinella for their valuable comments that significantly improved the manuscript.
References
1. Abdellaoui, A., Hottenga, J.-J., De Knijff, P., Nivard, M.G., Xiao, X., Scheet, P.,.. . Davies, G.E.: (2013). Population structure,
migration, and diversifying selection in the Netherlands. European journal of human genetics, 21(11), 1277–1285.
2. Anich, P.S., Anthony, S., Carlson, M., Gunnelson, A., Kohler, A.M., Martin, J.G., Olson, E.R.: (2021). Biofluorescence in the platypus
(Ornithorhynchus anatinus). Mammalia, 85(2), 179–181.
3. Baguette, M., Blanchet, S., Legrand, D., Stevens, V.M., Turlure, C.: (2013). Individual dispersal, landscape connectivity and
ecological networks. Biological Reviews, 88(2), 310–326.
4. Balkenhol, N., Cushman, S., Storfer, A., Waits, L.: (2015). Landscape genetics: concepts, methods, applications: John Wiley &
Sons
Page 11/165. Bethge, P., Munks, S., Otley, H., Nicol, S.: (2003). Diving behaviour, dive cycles and aerobic dive limit in the platypus
Ornithorhynchus anatinus. Comparative Biochemistry and Physiology Part A: Molecular & Integrative Physiology, 136(4), 799–
809.
6. Bino, G., Hawke, T., Kingsford, R.T.: (2021). Synergistic effects of a severe drought and fire on platypuses. Science of the Total
Environment, 777, 146137
7. Bino, G., Kingsford, R.T., Archer, M., Connolly, J.H., Day, J., Dias, K., Griffiths, J.: (2019). The platypus: evolutionary history, biology,
and an uncertain future. Journal of Mammalogy, 100(2), 308–327.
8. Bino, G., Kingsford, R.T., Grant, T., Taylor, M.D., Vogelnest, L.: (2018). Use of implanted acoustic tags to assess platypus
movement behaviour across spatial and temporal scales. Scientific reports, 8(1), 1–12.
9. Bino, G., Kingsford, R.T., Wintle, B.A.: (2020). A stitch in time–Synergistic impacts to platypus metapopulation extinction risk.
Biological Conservation, 242, 108399
10. Broadhurst, B., Ebner, B., Lintermans, M., Thiem, J., Clear, R.: (2013). Jailbreak: a fishway releases the endangered Macquarie
perch from confinement below an anthropogenic barrier. Marine and Freshwater Research, 64(9), 900–908.
11. Brown, J.J., Limburg, K.E., Waldman, J.R., Stephenson, K., Glenn, E.P., Juanes, F., Jordaan, A.: (2013). Fish and hydropower on the
US Atlantic coast: failed fisheries policies from half-way technologies. Conservation Letters, 6(4), 280–286.
12. Coleman, R., Gauffre, B., Pavlova, A., Beheregaray, L., Kearns, J., Lyon, J.,.. . Sunnucks, P.: (2018). Artificial barriers prevent genetic
recovery of small isolated populations of a low-mobility freshwater fish. Heredity, 120(6), 515–532.
13. Coleman, R.A., Chee, Y.E., Bond, N.R., Weeks, A., Griffiths, J., Serena, M.,.. . Walsh, C.J.: (2022). Understanding and managing the
interactive impacts of growth in urban land use and climate change on freshwater biota: A case study using the platypus
(Ornithorhynchus anatinus). Global Change Biology, 28(4), 1287–1300.
14. Dementieva, N., Mitrofanova, O., Dysin, A., Kudinov, A., Stanishevskaya, O., Larkina, T.,.. . Smaragdov, M.: (2021). Assessing the
effects of rare alleles and linkage disequilibrium on estimates of genetic diversity in the chicken populations. Animal, 15(3),
100171.
15. Drechsler, M., Burgman, M.A.: (2004). Combining population viability analysis with decision analysis. Biodiversity and
Conservation, 13(1), 115–139.
16. Frankham, R.: (2015). Genetic rescue of small inbred populations: meta-analysis reveals large and consistent benefits of gene
flow. Molecular Ecology.
17. Frankham, R., Ballou, J.D., Ralls, K., Eldridge, M., Dudash, M.R., Fenster, C. B.,.. . Sunnucks, P. (2017). Genetic management of
fragmented animal and plant populations: Oxford University Press
18. Furlan, E.M., Griffiths, J., Gust, N., Handasyde, K.A., Grant, T.R., Gruber, B., Weeks, A.R.: (2013). Dispersal patterns and population
structuring among platypuses, Ornithorhynchus anatinus, throughout south-eastern Australia. Conservation Genetics, 14(4),
837–853.
19. Garant, D., Forde, S.E., Hendry, A.P.: (2007). The multifarious effects of dispersal and gene flow on contemporary adaptation.
Functional Ecology, 434–443.
20. Georges, A., Gruber, B., Pauly, G.B., White, D., Adams, M., Young, M. J.,.. . Unmack, P. J. (2018). Genomewide SNP markers breathe
new life into phylogeography and species delimitation for the problematic short-necked turtles (Chelidae: Emydura) of eastern
Australia. Molecular Ecology, 27(24), 5195–5213.
21. Goudet, J.: (2005). Hierfstat, a package for R to compute and test hierarchical F-statistics. Molecular Ecology Notes, 5(1), 184–
186.
22. Grant, T., Llewellyn, L.C.: (1991). The biology and management of the platypus (Ornithorhynchus anatinus) in NSW: NSW
National Parks and Wildlife Service.
23. Grant, T.R.: (2004). Captures, capture mortality, age and sex ratios of platypuses, Ornithorhynchus anatinus, during studies over
30 years in the upper Shoalhaven River in New South Wales
24. Grant, T.R., & Fanning, D. (2007). Platypus: CSIRO PUBLISHING.
25. Grant, T.R., Temple-Smith, P.D.: (2003). Conservation of the platypus, Ornithorhynchus anatinus: threats and challenges. Aquatic
Ecosystem Health & Management, 6(1), 5–18.
Page 12/1626. Gruber, B., Unmack, P.J., Berry, O.F., Georges, A.: (2018). dartr: An r package to facilitate analysis of SNP data generated from
reduced representation genome sequencing. Molecular Ecology Resources, 18(3), 691–699.
27. Hawke, T., Bino, G., Kingsford, R.: (2021a). A national assessment of the conservation status of the platypus. Retrieved from
https://www.bees.unsw.edu.au/sites/default/files/documents/UNSW_ACF_WWF_HSI_Platypus_Report_Final.pdf
28. Hawke, T., Bino, G., Kingsford, R.T.: (2019). A silent demise: Historical insights into population changes of the iconic platypus
(Ornithorhynchus anatinus). Global Ecology and Conservation, 20, e00720
29. Hawke, T., Bino, G., Kingsford, R.T.: (2021b). Damming insights: Variable impacts and implications of river regulation on platypus
populations. Aquatic Conservation: Marine and Freshwater Ecosystems, 31(3), 504–519.
30. Hawke, T., Bino, G., Kingsford, R.T., Iervasi, D., Iervasi, K., Taylor, M.D.: (2021a). Fine-scale movements and interactions of
platypuses, and the impact of an environmental flushing flow. Freshwater Biology, 66(1), 177–188.
31. Hawke, T., Bino, G., Kingsford, R.T., Iervasi, D., Iervasi, K., Taylor, M.D.: (2021b). Long-term movements and activity patterns of
platypus on regulated rivers. Scientific reports, 11(1), 1–11.
32. Hill, W.G., Robertson, A.: (1968). Linkage disequilibrium in finite populations. Theoretical and Applied Genetics, 38(6), 226–231.
33. Hoffman, J.R., Willoughby, J.R., Swanson, B.J., Pangle, K.L., Zanatta, D.T.: (2017). Detection of barriers to dispersal is masked by
long lifespans and large population sizes. Ecology and Evolution, 7(22), 9613–9623.
34. Hoffmann, A.A., Miller, A.D., Weeks, A.: R. (2020). Genetic mixing for population management: From genetic rescue to
provenancing. Evolutionary Applications.
35. Holderegger, R., Wagner, H.H.: (2008). Landscape genetics. Bioscience, 58(3), 199–207.
36. Isaac, N.J.B., Turvey, S.T., Collen, B., Waterman, C., Baillie, J.E.M.: (2007). Mammals on the EDGE: conservation priorities based
on threat and phylogeny. PLoS One, 2(3), e296.
37. Jost, L.: (2008). GST and its relatives do not measure differentiation. Molecular Ecology, 17(18), 4015–4026.
38. Kilian, A., Wenzl, P., Huttner, E., Carling, J., Xia, L., Blois, H.,.. . Hopper, C. (2012). Diversity arrays technology: a generic genome
profiling technology on open platforms. In Data production and analysis in population genomics (pp. 67–89): Springer.
39. Klamt, M., Thompson, R., Davis, J.: (2011). Early response of the platypus to climate warming. Global Change Biology, 17(10),
3011–3018.
40. Kolomyjec, S.H.: (2010). The history and relationships of northern platypus (Ornithorhynchus anatinus) populations: a molecular
approach. James Cook University
41. Kolomyjec, S.H., Chong, J.Y.T., Blair, D., Gongora, J., Grant, T.R., Johnson, C.N., Moran, C.: (2009). Population genetics of the
platypus (Ornithorhynchus anatinus): a fine-scale look at adjacent river systems. Australian Journal of Zoology, 57(4), 225–234.
42. Kolomyjec, S.H., Grant, T.R., Blair, D.: (2008). Ten polymorphic microsatellite DNA markers for the platypus, Ornithorhynchus
anatinus. Molecular Ecology Resources, 8(5), 1133–1135.
43. Kolomyjec, S.H., Grant, T.R., Johnson, C.N., Blair, D.: (2014). Regional population structuring and conservation units in the
platypus (Ornithorhynchus anatinus). Australian Journal of Zoology, 61(5), 378–385.
44. Landguth, E.L., Cushman, S.A., Schwartz, M.K., McKelvey, K.S., Murphy, M., Luikart, G.: (2010). Quantifying the lag time to detect
barriers in landscape genetics. Molecular Ecology, 19(19), 4179–4191. doi:Doi 10.1111/J.1365-294x.2010.04808.X
45. Lebeuf-Taylor, E., McCloskey, N., Bailey, S.F., Hinz, A., Kassen, R.: (2019). The distribution of fitness effects among synonymous
mutations in a gene under directional selection. eLife, 8, e45952
46. Lemopoulos, A., Prokkola, J.M., Uusi-Heikkilä, S., Vasemägi, A., Huusko, A., Hyvärinen, P.,.. . Vainikka, A. (2019). Comparing
RADseq and microsatellites for estimating genetic diversity and relatedness—Implications for brown trout conservation. Ecology
and Evolution, 9(4), 2106–2120.
47. Linck, E., Battey, C.J.: (2019). Minor allele frequency thresholds strongly affect population structure inference with genomic data
sets. Molecular Ecology Resources, 19(3), 639–647.
48. Marchant, R., Grant, T.: (2015). The productivity of the macroinvertebrate prey of the platypus in the upper Shoalhaven River, New
South Wales. Marine and Freshwater Research, 66(12), 1128–1137.
49. Martin, H.C., Batty, E.M., Hussin, J., Westall, P., Daish, T., Kolomyjec, S., Grant, T.: (2018). Insights into platypus population
structure and history from whole-genome sequencing. Molecular Biology and Evolution, 35(5), 1238–1252.
Page 13/1650. McVean, G.: (2009). A genealogical interpretation of principal components analysis. PLoS Genet, 5(10), e1000686
51. Meirmans, P.G., Hedrick, P.W.: (2011). Assessing population structure: F-ST and related measures. Molecular Ecology Resources,
11(1), 5–18. doi:10.1111/j.1755-0998.2010.02927.x
52. Miller, J., Malenfant, R., David, P., Davis, C., Poissant, J., Hogg, J.,.. . Coltman, D. (2014). Estimating genome-wide heterozygosity:
effects of demographic history and marker type. Heredity, 112(3), 240–247.
53. Mills, L.S., Allendorf, F.W.: (1996). The one-migrant-per-generation rule in conservation and management. Conservation Biology,
10(6), 1509–1518. doi:10.1046/j.1523-1739.1996.10061509.x
54. Nislow, K.H., Hudy, M., Letcher, B.H., Smith, E.P.: (2011). Variation in local abundance and species richness of stream fishes in
relation to dispersal barriers: implications for management and conservation. Freshwater Biology, 56(10), 2135–2144.
55. O'Leary, S.J., Puritz, J.B., Willis, S.C., Hollenbeck, C.M., Portnoy, D.S.: (2018). These aren’t the loci you’e looking for: Principles of
effective SNP filtering for molecular ecologists. Molecular Ecology, 27(16), 3193–3206.
56. Pacifici, M., Santini, L., Marco, D., Baisero, M., Francucci, D., Marasini, L., G. G.,.. . Rondinini, C. (2013). Generation length for
mammals. Nature Conservation, 5, 89.
57. Pavoine, S., Ollier, S., Dufour, A.B.: (2005). Is the originality of a species measurable? Ecology Letters, 8(6), 579–586
58. Pew, J., Muir, P.H., Wang, J., Frasier, T.R.: (2015). related: an R package for analysing pairwise relatedness from codominant
molecular markers. Molecular Ecology Resources, 15(3), 557–561.
59. Privé, F., Aschard, H., Ziyatdinov, A., Blum, M.G.B.: (2018). Efficient analysis of large-scale genome-wide data with two R
packages: bigstatsr and bigsnpr. Bioinformatics, 34(16), 2781–2787.
60. R Core Team. (2021). R: A language and environment for statistical computing. R Foundation for Statistical Computing, Vienna,
Austria., URL https://www.R-project.org/
61. Ramachandran, S., Deshpande, O., Roseman, C.C., Rosenberg, N.A., Feldman, M.W., Cavalli-Sforza, L.L.: (2005). Support from the
relationship of genetic and geographic distance in human populations for a serial founder effect originating in Africa.
Proceedings of the National Academy of Sciences, 102(44), 15942–15947.
62. Sainsbury, A.W., Vaughan-Higgins, R.J.: (2012). Analyzing disease risks associated with translocations. Conservation Biology,
26(3), 442–452.
63. Schaffner, S.F.: (2004). The X chromosome in population genetics. Nature Reviews Genetics, 5(1), 43–51.
64. Schmidt, T.L., Jasper, M., Weeks, A.R., Hoffmann, A. A. (2020). Unbiased population heterozygosity estimates from genome-wide
sequence data. Methods in Ecology and Evolution.
65. Serena, M., Williams, G.: (2013). Movements and cumulative range size of the platypus (Ornithorhynchus anatinus) inferred
from mark–recapture studies. Australian Journal of Zoology, 60(5), 352–359.
66. Sherwin, W.B., Chao, A., Jost, L., Smouse, P.E.: (2017). Information theory broadens the spectrum of molecular ecology and
evolution. Trends in Ecology & Evolution, 32(12), 948–963.
67. Silva, A.T., Lucas, M.C., Castro-Santos, T., Katopodis, C., Baumgartner, L.J., Thiem, J.D.,.. . Braun, D. C. (2018). The future of fish
passage science, engineering, and practice. Fish and Fisheries, 19(2), 340–362.
68. Smith, J.M., Haigh, J.: (1974). The hitch-hiking effect of a favourable gene. Genetical Research, 23(01), 23–35.
69. Søndergaard, M., Jeppesen, E.: (2007). Anthropogenic impacts on lake and stream ecosystems, and approaches to restoration.
In: Wiley Online Library.
70. Steane, D.A., Nicolle, D., Sansaloni, C.P., Petroli, C.D., Carling, J., Kilian, A.,.. . Vaillancourt, R.E.: (2011). Population genetic analysis
and phylogeny reconstruction in Eucalyptus (Myrtaceae) using high-throughput, genome-wide genotyping. Molecular
phylogenetics and evolution, 59(1), 206–224.
71. Sunde, J., Yıldırım, Y., Tibblin, P., Forsman, A.: (2020). Comparing the performance of microsatellites and RADseq in population
genetic studies: Analysis of data for pike (Esox lucius) and a synthesis of previous studies. Frontiers in genetics, 11, 218
72. Sunnucks, P., Hales, D.F.: (1996). Numerous transposed sequences of mitochondrial cytochrome oxidase I-II in aphids of the
genus Sitobion (Hemiptera: Aphididae). Molecular Biology and Evolution, 13(3), 510–524.
73. Tigano, A., Friesen, V.L.: (2016). Genomics of local adaptation with gene flow. Molecular Ecology, 25(10), 2144–2164.
Page 14/1674. Veyrunes, F., Waters, P.D., Miethke, P., Rens, W., McMillan, D., Alsop, A.E.,.. . Schatzkamer, K. (2008). Bird-like sex chromosomes of
platypus imply recent origin of mammal sex chromosomes. Genome research, 18(6), 965–973.
75. Victoria Government Gazette. (2021). Authority of Victorian Government Printer.
76. Weir, B.S., Cockerham, C.C.: (1984). Estimating F-statistics for the analysis of population structure. Evolution, 38(6), 1358–1370.
77. Woinarski, J., Burbidge, A.: (2016). Ornithorhynchus anatinus. In The IUCN Red List of Threatened Species 2016: e.
T40488A21964009: IUCN.
78. Yates, A.D., Achuthan, P., Akanni, W., Allen, J., Allen, J., Alvarez-Jarreta, J.,.. . Bennett, R.: (2020). Ensembl 2020. Nucleic Acids
Research, 48(D1), D682-D688.
79. Zhou, Y., Shearwin-Whyatt, L., Li, J., Song, Z., Hayakawa, T., Stevens, D., Pajpach, F.: (2021). Platypus and echidna genomes
reveal mammalian biology and evolution. Nature, 592(7856), 756–762.
Figures
Figure 1
a) Distribution of major dams (> 10 m high; red points) within and outside the IUCN platypus distribution (yellow shade; Woinarski &
Burbidge, 2016), and the focus regions for this study (brown inset). b) Location of rivers in south-east Australia where platypuses
were sampled (orange squares) in rivers that were regulated (with major dams) and unregulated (no major dams). c) Upper Murray
Rivers: Ovens (unregulated) and Mitta-Mitta Rivers (regulated, upstream sections are in the south, confluence with Ovens is out of the
frame, in northwest). d) Snowy Rivers (do not follow the paired experimental design, due to geographic constraints; see methods):
Eucumbene (regulated), Thredbo (unregulated), and Snowy River (regulated, Snowy flows downstream to the southeast). e) Central
NSW Rivers: Wingecarribee River (unregulated) and Nepean River (regulated, downstream sections are in the north, there is no
confluence with Wingecarribee). f) Border Rivers: Tenterfield Creek (unregulated) and Severn River (regulated, upstream sections are
to the east, confluence with Tenterfield is out of the frame, in northwest). Pink balloons represent the 81 sampling sites; rivers are
coloured in light blue, and reservoirs behind major dams are in dark blue.
Page 15/16You can also read