Expert Witness Statement of James Weidmann - In the matter of the Fingerboards Mineral Sand Project EES - Flooding and Hydraulics - Amazon AWS
←
→
Page content transcription
If your browser does not render page correctly, please read the page content below
Expert Witness Statement of
James Weidmann
In the matter of the Fingerboards Mineral
Sand Project EES – Flooding and Hydraulics
Kalbar Operations Pty Ltd

January 2021
1            INTRODUCTION
                                                               I, James Weidmann, was engaged by Kalbar Operations Pty Ltd (Kalbar) to prepare a witness statement and
                                                               give evidence in respect to hydraulics and flooding for the proposed Fingerboards Mineral Sands Mine. l
                                                               conducted a site inspection on the 9th to 10th of December 2020 to visually assess the site and surrounds.

                                                               Statement of Engagement, Qualifications and Experience:
                                                               ◼   I have prepared this Witness Statement at the request of Kalbar.
                                                               ◼   I am a Senior Water Engineer (Flooding and Hydraulics) at Water Technology Pty. Ltd. I hold a bachelor’s
                                                                   degree in Environmental Engineering (University of Queensland), a graduate diploma in Environmental
                                                                   Management (University of Queensland) and I have 8 years’ experience in engineering consultancy.
                                                               ◼   A copy of my curriculum vitae is provided in Appendix A of this report.
                                                               ◼   This statement is prepared as an independent and impartial report.
                                                               ◼   I accept that I have an overriding duty to the Inquiry and Advisory Committee to assist impartially on
                                                                   matters relevant to my area of expertise, that my paramount duty is to the Inquiry and Advisory Committee
                                                                   and not to any party to the proceedings (including the entity retaining me), and that I am not an advocate
                                                                   for any party.
                                                               ◼   I have made all the inquiries that I believe are desirable and appropriate and no matters of significance
                                                                   which I regard as relevant have to my knowledge been withheld from the Committee.

                                                               2            SCOPE
                                                               2.1          Role in Preparation of the EES
                                                               Water Technology has prepared the following reports to support the proposed mine application, which
                                                               considered the hydraulics and flooding aspects of the Fingerboards Project:
                                                               ◼   “Fingerboards Mineral Sands, Surface Water Assessment – Site Study”, dated 30 April, ref: 6319-
                                                                   01_R01V08 (Water Technology 2020a), included in Appendix A006 (Appendix E) of the EES (Site Study
                                                                   Report); and
                                                               ◼    “Fingerboards Mineral Sands, Surface Water Assessment – Regional Study”, dated 30 April, ref: 6319-
21020125_R03v01_Expert_Witness_Statement_James_Weidmann.docx

                                                                   01_R02V09_Regional (Water Technology 2020a), included in Appendix A006 (Appendix F) of the EES
                                                                   (Regional Study Report).

                                                               The above reports were prepared by Water Technology under the direction of Simon Hof. Simon left Water
                                                               Technology in November 2020. Since Simon left Water Technology, I have undertaken a detailed review of
                                                               the flooding and hydraulic modelling aspects of the assessments undertaken and reviewed EES submissions
                                                               that raised hydraulics and flooding matters. I am not qualified to comment on, and my statement does not
                                                               address, the water quality matters addressed in the two Water Technology reports listed above.

                                                               The flood modelling undertaken by Water Technology addresses the ESS scoping requirements. I have
                                                               undertaken additional flood modelling to address numerous submissions relating to flooding, as described in
                                                               Section 3.3 of this statement. This additional flood modelling has informed assessments relating to potential
                                                               erosion, sedimentation and landform stability effects of the project undertaken by my colleague, Dr Michael
                                                               Cheetham.

                                                               Kalbar Operations Pty Ltd | January 2021
                                                               In the matter of the Fingerboards Mineral Sand Project EES – Flooding and Hydraulics                   Page 2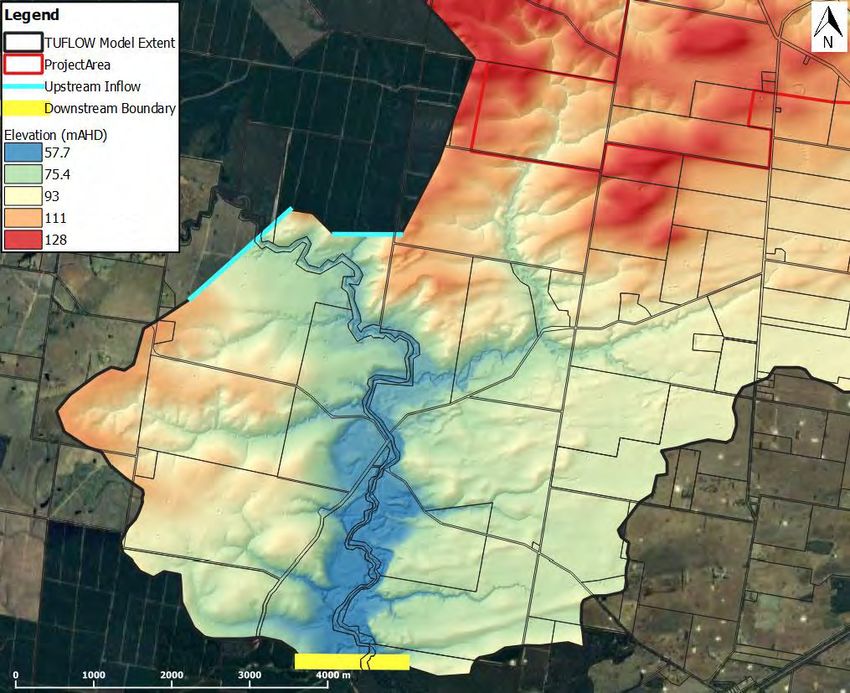
2.2          Other Persons Who Assisted
                                                               The following people assisted me in preparing this statement:

                                                               Simon Hoff, Senior Engineer (BEng): Project Manager and contributor to hydrological and hydraulics
                                                               components of the studies. His work contributed to the Site and Regional Reports noted above. Prior to Simon
                                                               leaving Water Technology in November 2020, Simon helped me during the handover period to understand the
                                                               assessments undertaken and provided advice for addressing some of the submissions.

                                                               Chris Delaney, Engineer (BEng): Chris contributed to the hydrology and hydraulics components of the study
                                                               under the supervision of Simon Hoff. Chris assisted me in my detailed review of the hydraulic modelling.

                                                               2.3          Instructions
                                                               Instructions given to me to prepare this statement are included in Appendix B.

                                                               2.4          Methodology
                                                               The flooding assessment undertaken by Water Technology in the Site Study Report and Regional Study
                                                               Report involved the following:
                                                               ◼   Construction of a detailed hydraulic model (TUFLOW) encompassing the site and surrounding
                                                                   catchments;
                                                               ◼   Application of a rain-on-grid (direct rainfall) modelling approach utilising rainfall data obtained from the
                                                                   Bureau of Meteorology (BoM) and ARR Datahub;
                                                               ◼   Development of a hydrology model (RORB) to represent external catchment inflow for a portion of the
                                                                   Moilun Creek catchment;
                                                               ◼   Hydrology from the Mitchell River Regional Flood Study (DELWP) was used to represent concurrent flow
                                                                   in Mitchell system (10% AEP event);
                                                               ◼   Testing of existing conditions hydrologic regime including:
                                                                   ◼    Additional event durations trialled including 1hr, 1.5hr, 2hr, 6hr, 12hr and 72hr.
                                                                   ◼    All ten temporal patterns were tested (using the 1hr duration) to identify the catchments mean
                                                                        temporal pattern (as recommended in ARR2016).
                                                               ◼   Literature review into appropriate model parameters / arrangements including:
21020125_R03v01_Expert_Witness_Statement_James_Weidmann.docx

                                                                   ◼    Losses (initial loss / continuing loss).
                                                                   ◼    Landform roughness.
                                                                   ◼    Methodologies to represent controlled discharge/ proposed diversions.
                                                               ◼   Empirical flow estimates and other regional comparisons calculated to test/validate model parameters
                                                                   (initial loss / continuing loss), confirming that the hydraulic model produces representative catchment
                                                                   flows.
                                                               ◼   Hydraulic simulation of an extremely rare, worse-case scenario where all water management dams are
                                                                   full (ready to spill) and a 1% AEP 60-minute storm occurs. This was undertaken to examine changes to
                                                                   flows resulting from rare, high-magnitude events and assess the impacts of spillway releases;
                                                               ◼   Hydraulic assessment of three (3) mine operations and one (1) post-mining rehabilitation scenarios, these
                                                                   being:
                                                                   ◼    Year 5 of mining operations.

                                                               Kalbar Operations Pty Ltd | January 2021
                                                               In the matter of the Fingerboards Mineral Sand Project EES – Flooding and Hydraulics                     Page 3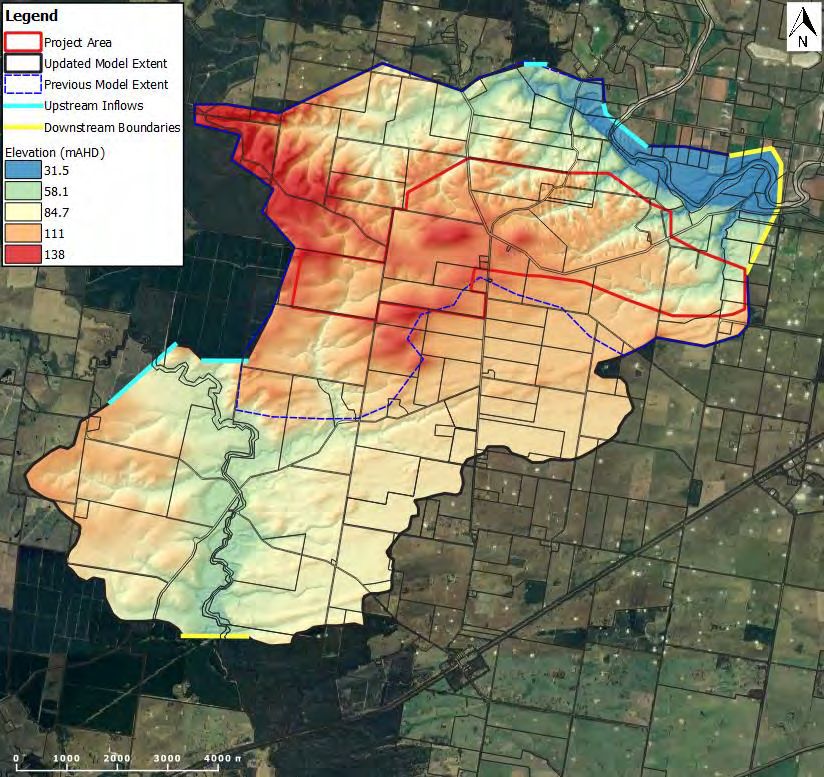
◼    Year 8 of mining operations.
                                                                   ◼    Year 15 of mining operations.
                                                                   ◼    Rehabilitation scenario.

                                                               Additional details of the flood assessment and modelling methodology are contained in the Site Study Report
                                                               and Regional Study Report. I have undertaken additional hydraulic modelling to respond to submissions, the
                                                               details of which are contained in Section 3.3 of this document.

                                                               The key assumptions made in preparing the flooding assessments include:
                                                               ◼   Hydraulic modelling is based on available topographic LiDAR data captured in 2015 and 2018/19 which
                                                                   may vary from current site conditions. This is a typical caveat for all flooding assessments. Differences
                                                                   are likely to be localised and not have any significant effect on the outcomes of the assessment.
                                                               ◼   Hydraulic modelling undertaken as part of the assessment is based on design surfaces provided by others.
                                                               ◼   Water management dams were assumed to be 100% full (“upset operations”) at the start of the hydraulic
                                                                   simulations. This is a highly conservative assumption and actual flooding impacts are likely to be less in
                                                                   reality.
                                                               ◼   Several on-site stormwater diversions have been included in the mine operations scenarios which are
                                                                   conceptual in nature and will be subject to future detailed design assessment.
                                                               ◼   The post-mining landform provided by Kalbar is conceptual and details such as specific watercourse paths
                                                                   and grading will be included in the mine closure planning stage.
                                                               ◼   The assessments undertaken are preliminary in nature and are intended to inform the flooding and
                                                                   stormwater management approaches during operation and rehabilitation. The preliminary nature of the
                                                                   assessment models snapshots in time during the mine life. In reality, mining activities and landform
                                                                   changes will be dynamic, therefore, mitigation strategies will need to be continually implemented and
                                                                   adapted to suit the changing landforms and drainage arrangements. Additional detailed assessment
                                                                   should be undertaken during subsequent stages of the design and operations to ensure that flooding
                                                                   impacts of the mine are effectively managed.
                                                               I note that although the assessment is preliminary in nature, it is very common to undertake this level of
                                                               assessment at this stage of a project. The results of the modelling are broadly representative of the worst-case
                                                               flooding impacts.

                                                               2.5          Limitations
21020125_R03v01_Expert_Witness_Statement_James_Weidmann.docx

                                                               The following limitations apply to the flooding assessment undertaken:
                                                               ◼   Hydrology and hydraulic modelling has been undertaken in the absence of appropriate stream gauge
                                                                   records. Flows have been validated using alternate industry accepted methods.
                                                               ◼   The results of the assessment are contingent on the accuracy of the LiDAR data provided.
                                                               ◼   Hydraulic modelling undertaken as part of the assessment is based on design surfaces provided by others.
                                                                   ◼    The design surfaces provided were adequate for the purpose of my assessment, however, I note that
                                                                        they contained some triangulation errors which I corrected in the model, and are inconsequential to
                                                                        the overall assessment and outcomes.
                                                               ◼   All flooding assessments undertaken have not specifically included allowance for changes in climate as
                                                                   is often required for resources/infrastructure projects. I have addressed this aspect as part of my response
                                                                   to submissions in Section 3.13.3. Overall, the risk of climate change is small given the relatively short
                                                                   timeframe on the project.

                                                               Kalbar Operations Pty Ltd | January 2021
                                                               In the matter of the Fingerboards Mineral Sand Project EES – Flooding and Hydraulics                     Page 4
3             FINDINGS
                                                               The following section summarises the outcomes of my detailed review of the Site and Regional Reports and
                                                               flooding assessments undertaken. I also provide a summary of the overall outcomes of all work undertaken to
                                                               address submission items relating to flooding, including the additional modelling that has been undertaken
                                                               since EES exhibition.

                                                               3.1           Corrections and Clarifications
                                                               I adopt the hydraulic and flooding aspects of the two Water Technology reports listed in Section 2.1 of my
                                                               statement as the basis of my evidence before the Inquiry and Advisory Committee, subject to the following
                                                               specific corrections and clarifications:
                                                               ◼   Typo in Table 2-1 of the Site Study Report (page 30 of Appendix E/0006) in the Post-Mining (bottom) row.
                                                                   The corrected values are presented below (highlighted in red) and are essentially identical to the
                                                                   previously reported figures. The minor error has no bearing on the conclusions of the assessment.

                                                               TABLE 3-1     WATER BALANCE RESULTS REVIEW RESULTS (OUTLET J – TRIBUTARY OF THE HONEYSUCKLE
                                                                             CREEK)

                                                                Scenario      Peak flow     Number         % of time      Total          Difference   %           Average
                                                                              (ML/d)        of flow        flowing        Volume         Volume       increase    daily flow
                                                                                            days*                         (ML)           (ML)         in volume   (ML/d)

                                                                Pre mining    187.8         11176          26%            32851                                   0.76

                                                                Yr 5          129.6         12463          29%            32843          -8           0%          0.76

                                                                Yr 8          129.6         12642          29%            37279          4428         13%         0.86

                                                                Yr 15         59.41         12436          29%            30067          -2783        -8%         0.70

                                                                Post          187.8         11176          26%            32851          0            0%          0.76
                                                                Mining        188.0         11126                         32853          +2

                                                               * based on a low flow threshold of 0.001ML/d
                                                               ◼   Hydraulic model flow validation clarification (Section 4.1.6 of the Site Study Report)
21020125_R03v01_Expert_Witness_Statement_James_Weidmann.docx

                                                                   ◼     Several checks were previously undertaken to validate the hydraulic model peak flow at Honeysuckle
                                                                         Creek, however, the 1% AEP (1 in 100-year ARI) median peak flow extracted from the model
                                                                         (37.7 m3/s) was inadvertently taken from a different tributary with a very similar label (Perry Gully
                                                                         instead of Perry). The “correct” flow would have been 55.0 m3/s, which is higher than the previous
                                                                         validation flow. This flow estimate is still within acceptable bounds and does not have any bearing on
                                                                         the modelling outcomes. The updated models were validated again as discussed in Section 3.3.2
                                                                         below.
                                                               ◼   Section 5.5.4 of the Site Study Report in respect to downstream impacts identified in the “rehabilitation”
                                                                   scenario states that “the increase in flow to this region [the Honeysuckle Creek tributary downstream of
                                                                   the site] is assumed to be due to changes in catchment boundaries”. It is my opinion that the total
                                                                   catchment area is fundamentally identical to the existing case, and that impacts are instead largely
                                                                   attributable to the change in landform and land use.

                                                               Kalbar Operations Pty Ltd | January 2021
                                                               In the matter of the Fingerboards Mineral Sand Project EES – Flooding and Hydraulics                      Page 5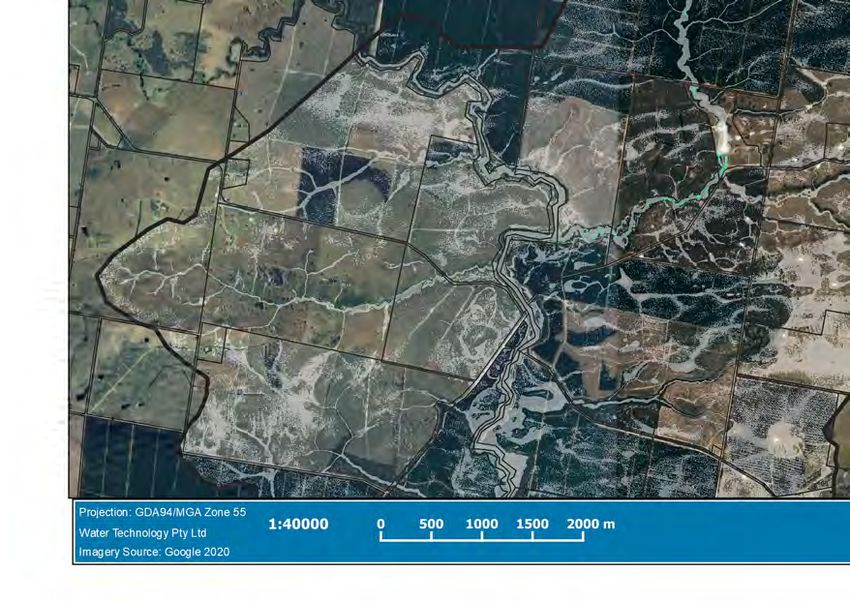
3.2 Summary of Opinions
Conclusions in respect to the hydraulic assessment are presented in Section 7 of the Site Study Report. In my
opinion, the key findings of the assessment as detailed in the report are:
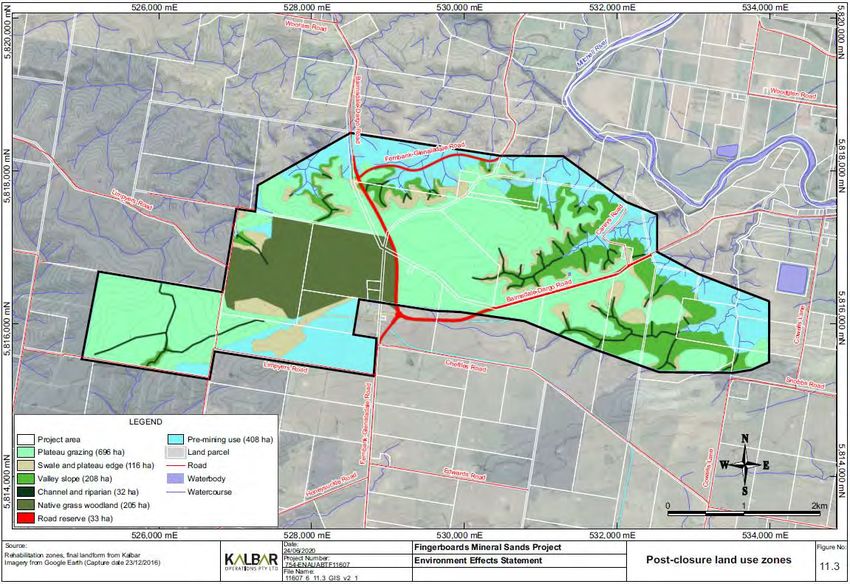
◼ The hydraulic modelling outcomes as summarised in Table 3-2 below. Note that Table 3-2 is adapted and
updated from Table 7-1 of the Site Study Report based on the outcomes of the additional assessment
discussed herein. I’ve included the percentage change based on the maximum flood depth. The location
of the waterways is shown in Figure 3-1 below.
◼ In respect to the “Year 5” scenario, downstream impacts are noted in Lucas Creek and the Unnamed Gully
to the north of the site up to approximately 100mm and 260mm respectively. Associated velocity impacts
are up to approximately 0.3m/s and 0.6m/s.
◼ In respect to the “Year 8” scenario, downstream impacts are noted in the Unnamed Gully to the north of
the site up to approximately 220mm. Associated velocity impacts are up to approximately 0.5m/s. Minor
localised impacts are noted in upper reaches of Lucas Creek.
◼ In respect to the “Year 15” scenario, downstream impacts are noted in Lucas Creek, Simpson Gully and
the Unnamed Gully to the north of the site up to approximately 400mm, 360mm and 210mm respectively.
Associated velocity impacts are up to approximately 0.2m/s, 0.4m/s and 0.5m/s.
◼ In respect to the “Rehabilitation” scenario, downstream impacts are noted in Lucas Creek, Simpson Gully
and the Unnamed Gully to the north of the site up to approximately 170mm, 140mm and 220mm
respectively. Associated velocity impacts are up to approximately 0.2m/s, 0.2m/s and 0.5m/s. Impacts up
to approximately 200mm are also noted in Honeysuckle Creek downstream of the site with minor
associated increases in velocity of approximately 0.1m/s.
◼ In all cases, changes are predominantly due to an adjustment of internal catchment boundaries within the
mine, and partially attributable to the change in hydraulic roughness (land use). Changes to water level
and velocity can be reduced with refinements to the design surfaces and internal drainage arrangements
if practicable. It is typical for these changes and improvements to be made during the design process. Any
residual impacts can be mitigated by revegetation and channel stabilisation works.
◼ In all cases, water level impacts noted can be mitigated as discussed below, but are nonetheless minor
given the following:
◼ Water level impacts are largely contained to existing flood constrained land;
◼ Flooding impacts predominantly affect heavily modified and rural farmland, and do not affect
freeboard provisions for any residential dwellings.
21020125_R03v01_Expert_Witness_Statement_James_Weidmann.docx
◼ The Site Study Report notes that all significant flood impacts can be managed/mitigated with design and
or operational procedures.
◼ It is my opinion that all the impacts identified can be reduced through effective mitigation strategies and
can be managed. Key flood mitigation strategies include the following:
◼ Maintain the existing landforms and catchment boundaries as much as practicable. Limit significant
modification of catchment boundaries and provide internal drainage/diversions to maintain existing
points of discharge as much as practicable to minimise offsite impacts. This is particularly important
for the Perry Gully catchment to minimise impacts to the unnamed gully to the west.
◼ Operational measures which include drawing down dams to ensure freeboard is available to attenuate
flood impacts.
◼ Vegetation buffers to manage velocity and erosion.
◼ Grade control structures to stabilise active erosion features (head cuts) outside the active mining
extent.
Kalbar Operations Pty Ltd | January 2021
In the matter of the Fingerboards Mineral Sand Project EES – Flooding and Hydraulics Page 6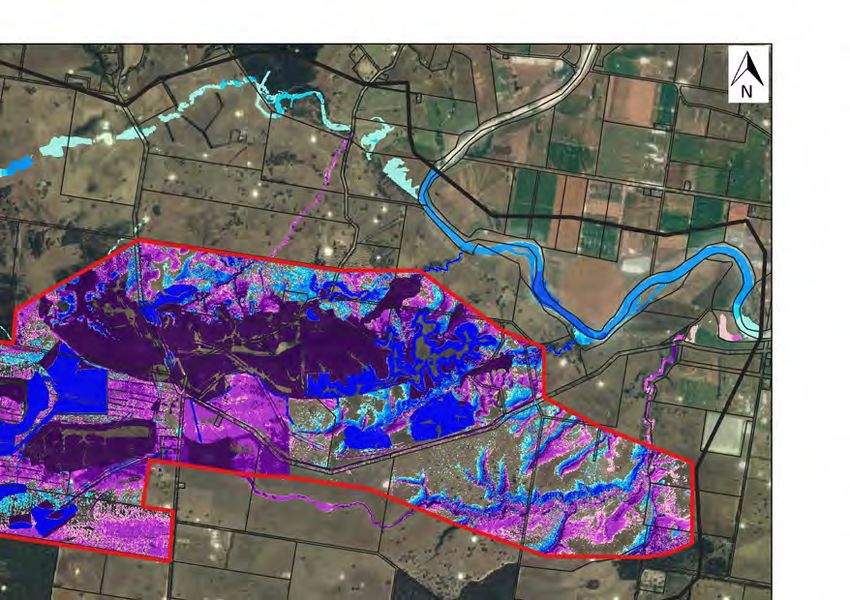
◼      Regular and ongoing inspections of drainage system (during and post mining) to identify emerging
                                                                          issues (e.g. bed instabilities).
                                                                   ◼      In respect to the rehabilitation impacts, flooding impacts can be mitigated via modifying the post-
                                                                          mining landform design and extensive revegetation to maintain the existing catchment response as
                                                                          much as practicable. Dam 18 located on the tributary to Honeysuckle creek may be utilised as a
                                                                          detention basin (designed to blend into the natural environment), which would be capable of mitigating
                                                                          flood impacts downstream if such infrastructure is allowed to remain post-closure.
                                                               ◼   With reference to the Mitigation Register (Attachment H to the EES), Kalbar has committed to additional
                                                                   management practices to minimise off-site flooding impacts, including the following:
                                                                   ◼      (SW02) - The design and placement of infrastructure in the project area will consider potential for flow
                                                                          accumulation and increased flood risk, and associated prevention measures.
                                                                   ◼      (SW34) Ephemeral drainage gullies will be revegetated in areas downstream of future mining
                                                                          activities prior to operations commencing to increase landscape stability and specifically mitigate:
                                                                          ◼   Effects of a moderate increased flow velocity downstream of the mine operations and the final
                                                                              landform.
                                                                          ◼   Potential effects of tunnel erosion downstream of the mine void boundary where soil treatment is
                                                                              not planned.
                                                                          ◼   Effects of sediment starvation by reducing sediment transport and encouraging deposition.
                                                               ◼   Landowners shown to be impacted by changes in flooding regime should be engaged through the broader
                                                                   EES and approvals process. Models developed as part of this study can be used to help understand the
                                                                   potential magnitude changes and the effectiveness of the surface water management system.
                                                               ◼   The ongoing design of the rehabilitated landform should respond to the findings of this study. Adjustment
                                                                   to catchment boundaries and valley morphology is recommended during future design updates as well as
                                                                   careful management of valley arrangements including fill types and vegetation type and density. Future
                                                                   rehabilitation designs should include the input of a qualified geomorphologist. The hydraulic model
                                                                   developed in this study (or similar) should be used as an evaluation tool for future designs.

                                                               TABLE 3-2      FLOOD IMPACT RESULTS

                                                                                                                        Identified changes

                                                                Mine Year /       Lucas Creek     Simpson         Perry Gully      Long Marsh         Honeysuckle    Unnamed
                                                                Stage                             Gully                            Gully              Creek          Gully
                                                                Year 5            Flood level     Reduction in    Reduction in     Reduction in       Reduction in   Flood level
21020125_R03v01_Expert_Witness_Statement_James_Weidmann.docx

                                                                                  increases up    flooding        flooding         flooding           flooding       increases up
                                                                                  to 100mm                                                                           to 260mm
                                                                                  (20%)                                                                              (20%)
                                                                Year 8            Flood level     Reduction in    Reduction in     Reduction in       Reduction in   Flood level
                                                                                  increases up    flooding        flooding         flooding           flooding       increases up
                                                                                  to 50mm                                                                            to 220mm
                                                                                  (60%)                                                                              (16%)
                                                                Year 15           Flood level     Flood level     Reduction in     Reduction in       Reduction in   Flood level
                                                                                  increases up    increases up    flooding         flooding           flooding       increases up
                                                                                  to 400mm        to 360mm                                                           to 210mm
                                                                                  (11%)           (17%)                                                              (15%)

                                                               Kalbar Operations Pty Ltd | January 2021
                                                               In the matter of the Fingerboards Mineral Sand Project EES – Flooding and Hydraulics                          Page 7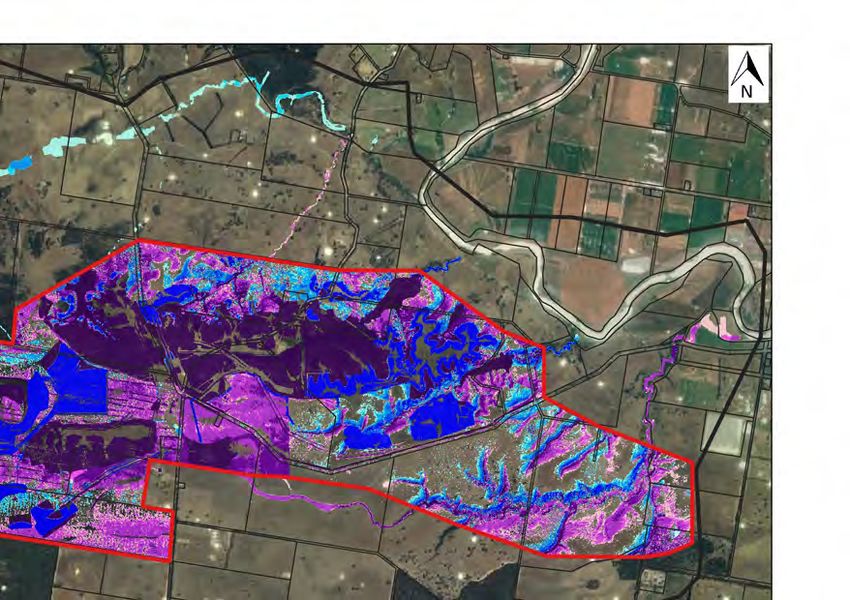
Identified changes

                                                                Rehabilitation      Flood level      Flood level      Reduction in       Reduction in   Flood level      Flood level
                                                                                    increases up     increases up     flooding           flooding       increases up     increases up
                                                                                    to 170mm         to 140mm                                           to 200mm         to 220mm
                                                                                    (5%)             (7%)                                               (10%)            (16%)

                                                                                                                                     Moilun Creek

                                                                                                   Long Marsh Gully

                                                                                                                                                                Mitchell River

                                                                                                              Unnamed Gully

                                                                                                                       Perry Gully

                                                                                                                       Simpsons Gully

                                                                                                                                                          Lucas Creek

                                                                                 Honeysuckle Creek
21020125_R03v01_Expert_Witness_Statement_James_Weidmann.docx

                                                                                                     FIGURE 3-1 PROJECT AREA WATERWAYS

                                                               3.3           Additional Work Undertaken Since Preparation of the
                                                                             Reports
                                                               3.3.1         Purpose of the Additional Modelling
                                                               A number of ESS submitters expressed concerns about flooding impacts to the Perry River. As such, I have
                                                               undertaken additional modelling to assess potential impacts to the Perry River system. Specifically, this
                                                               involved building a new RORB hydrology model for the Upper Perry River to provide inflows for the extended
                                                               TUFLOW model which was also updated and extended to include the Perry River. Details of the additional

                                                               Kalbar Operations Pty Ltd | January 2021
                                                               In the matter of the Fingerboards Mineral Sand Project EES – Flooding and Hydraulics                              Page 8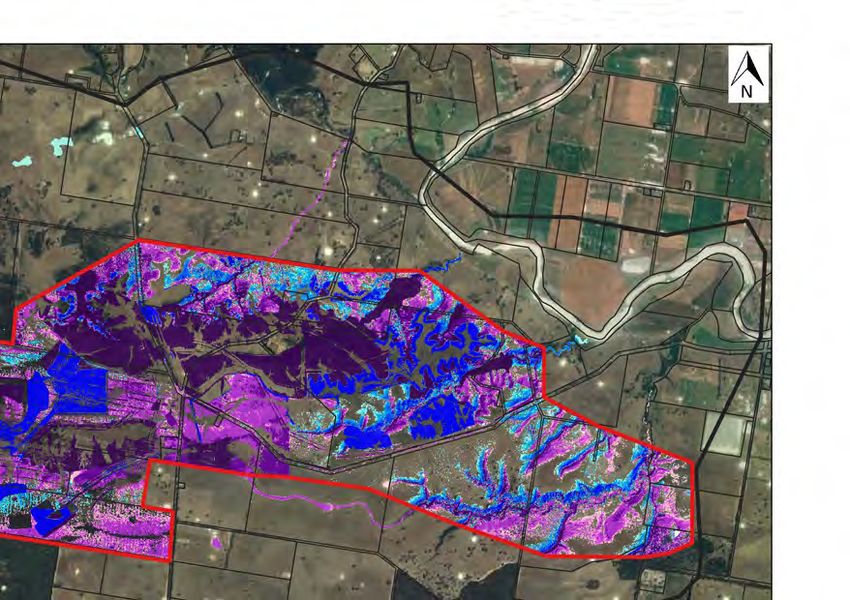
modelling undertaken are contained in the following sections. Collectively, the results of the additional
                                                               modelling undertaken are discussed in Section 3.3.4.

                                                               Some ESS submitters also raised concerns over flooding impacts to the Mitchell River. This has been
                                                               addressed with additional discussion as detailed in Section 3.3.5.

                                                               3.3.2        Upper Perry River RORB Modelling
                                                               To assess the impacts of the proposed mine on flooding conditions in Honeysuckle Creek and the Perry River,
                                                               it was necessary to develop a hydrology model for the Upper Perry catchment. The purpose of the model is to
                                                               inform the Perry River impact assessment and provide regional hydrographs (inflows) for the hydraulic model
                                                               as discussed separately in the following section.

                                                               Modelling the entire Perry catchment to Lake Wellington is not necessary, given that if no impacts are
                                                               identifiable downstream of the Honeysuckle and Perry confluence, it can be assumed that areas farther
                                                               downstream will not be affected. The model outlet was positioned approximately 5.8km downstream of the
                                                               Honeysuckle and Perry confluence, and the upstream catchment was divided into approximately 64 sub-
                                                               catchments of roughly similar size. The recently available 2018/2019 LiDAR for the Perry catchment was
                                                               utilised for catchment delineation. Figure 3-2 shows the RORB model layout.

                                                               Model parameters were adapted and scaled from the Mitchell River RORB model (developed by Water
                                                               Technology) which is a calibrated hydrology model for a neighbouring catchment. All impervious percentages
                                                               were assumed to be effectively zero. The model utilises standard ARR19 design losses and rainfall
                                                               parameters, which is consistent with the previous modelling for the site.

                                                               Flows were validated using the RFFE online tool for the outlets of sub-catchments “1.17” and “15.03”. The
                                                               comparison shown in Table 3-3 demonstrates that the 1% AEP (1 in 100-year ARI) flows are reasonable
                                                               (noting that the upper confidence limit for sub-catchment “1.17” is 594 m3/s).

                                                               The peak flow for sub-catchment “15.03” located downstream of the site was also validated using the Rational
                                                               Method. The results demonstrate that flows from the Honeysuckle Creek tributary catchment which contains
                                                               the western part of the mine site are reasonable. We note that the calculation was somewhat sensitive to the
                                                               adopted C10 value and assumed velocity, however, the adopted values are reasonable based on-site
                                                               inspection observations and hydraulic modelling results. The calculation is also constrained for catchments
                                                               that have two similarly sized sub-catchments converging at the validation location (“15.01” and “16.01” below).
                                                               In reality, flows from the two catchments will converge at similar times, resulting in higher peak flows than can
                                                               be estimated using the Rational Method. The resulting Rational Method flow estimate will therefore be an
                                                               underestimate. Indeed, the hydraulic model predicts the median 1% AEP (1 in 100-year ARI) flow at the sub-
                                                               catchment “15.03” location to be 61.6 m3/s.
21020125_R03v01_Expert_Witness_Statement_James_Weidmann.docx

                                                               Kalbar Operations Pty Ltd | January 2021
                                                               In the matter of the Fingerboards Mineral Sand Project EES – Flooding and Hydraulics                      Page 9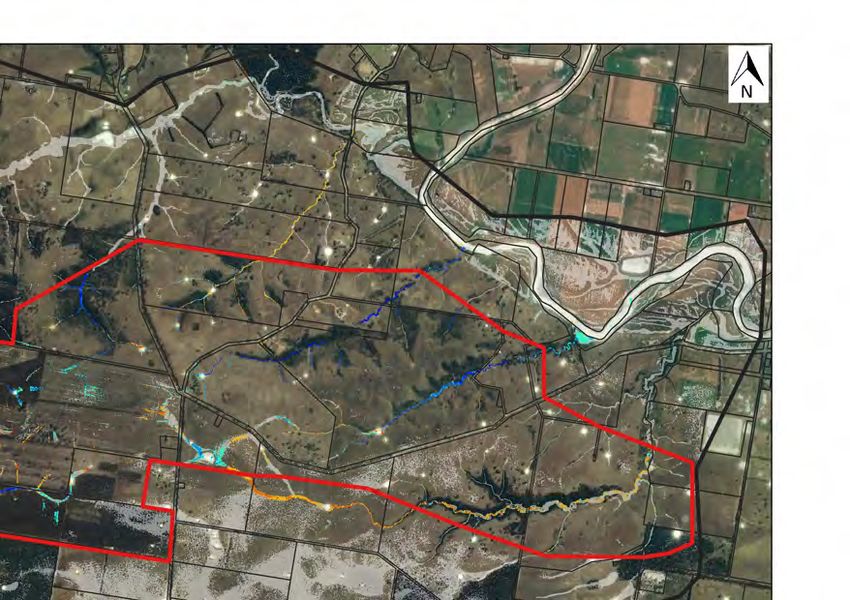
FIGURE 3-2 UPPER PERRY RORB MODEL LAYOUT

                                                               TABLE 3-3    RFFE FLOW VALIDATION SUMMARY

                                                                Parameter                               Sub-catchment 1.17                    Sub-catchment 15.03
                                                                Total upstream area   (km2)             145.3                                 8.37
                                                                RORB 1% AEP median peak flow            435                                   50.2
                                                                (m3/s)
                                                                RFFE 1% AEP discharge                   259                                   47.3
21020125_R03v01_Expert_Witness_Statement_James_Weidmann.docx

                                                               TABLE 3-4    RATIONAL METHOD FLOW VALIDATION SUMMARY

                                                                Parameter                                                  Sub-catchment 15.03
                                                                Total upstream area   (km2)                                8.37
                                                                C10                                                        0.46
                                                                Flowpath Length (m)                                        4,830
                                                                Channel Velocity (m/s)                                     0.7
                                                                Overland Flow Time (mins)                                  115
                                                                Rational 1% AEP Discharge     (m3/s)                       44.5
                                                                RORB 1% AEP median peak flow       (m3/s)                  50.2
                                                                Percentage Difference                                      +11%

                                                               Kalbar Operations Pty Ltd | January 2021
                                                               In the matter of the Fingerboards Mineral Sand Project EES – Flooding and Hydraulics                 Page 10
3.3.3 Additional TUFLOW Hydraulic Modelling
The previous hydraulic model extent included the entire project site, a section of the Mitchell River, a section
of Moilun Creek, Long Marsh Gully, and a section of Honeysuckle Creek. Upstream boundary conditions were
included which represented hydrographs (inflows) for the greater Mitchell River and Moilun Creek catchments.
I am satisfied that the previous modelling work demonstrates that the project will not have any adverse impact
on flooding or flood behaviour in the Mitchell River and therefore does not require any additional assessment.
In respect to Honeysuckle Creek, it was not clear how far downstream potential impacts in the rehabilitation
scenario may extend or whether flood impacts may be present in the Perry River located approximately
4.5 kms downstream of the project site. The location of the previous model downstream boundary on
Honeysuckle Creek was constrained by the lack of 1m LiDAR data any further downstream. However, since
the completion of the previous modelling work, additional LiDAR data has been released which includes the
entire Perry River catchment (understood to be captured in 2018 and 2019). The additional LiDAR has been
used to supplement the previous datasets and extend the hydraulic model to approximately 5 km downstream
of the Perry River and Honeysuckle Creek confluence. This is a sufficient distance from the confluence to
adequately assess impacts to the Perry River.
Changes and improvements to the existing case hydraulic model are summarised as follows:
◼ Inclusion of the additional 1m LiDAR for the Perry River (captured in 2018/19).
◼ Extension of the model boundaries to include additional catchments to the south of the site.
◼ Updated downstream boundary located approximately 5 km downstream of the Perry River and
Honeysuckle Creek confluence.
◼ Inclusion of regional upstream inflows in the Perry River and California Creek based on the RORB model
output.
◼ Adoption of depth-varying roughness parameters which more accurately represent flow in on rain-on-grid
model.
◼ Adoption of the latest version of TUFLOW (Build 2020-10-AA).
◼ Application of a 5m grid size with the Sub-Grid-Sampling (SGS) enhancement (sampling the LiDAR DEMs
at 1m).
The existing case model topography is based primarily on the available LiDAR datasets for the catchment.
The model layout is shown in Figure 3-3. Minor topographic modifications were required to ensure flow
continuity and approximate some culvert crossings where details are not available.
21020125_R03v01_Expert_Witness_Statement_James_Weidmann.docx
The mining operation cases included the previously assessed “Year5”, “Year8”, “Year15” and “Rehabilitation”
scenarios. The model set up is largely identical to the previous assessment, with only minor topographical
modifications made to suit the updated cell resolution. I note that the design surfaces provided contained some
triangulation errors which are inconsequential to the overall assessment and outcomes, but were nonetheless
corrected as part of the updated modelling.
The “Rehabilitation” case materials layer was modified to suit the updated proposed revegetation layout shown
in Figure 3-4.
The hydraulic simulations concentrated on the 1% AEP (1 in 100-year ARI) and 50% AEP (1 in 1.44-year ARI)
events only for the concept assessment.
For the 1% AEP (1 in 100-year ARI), all ten (10) temporal patterns for the 1-hr, 3-hr and 12-hr storms were
simulated hydraulically for the existing case model. This selection was based on the critical durations in the
RORB model at four (4) locations: immediately downstream of the site (sub-catchment 15.02), Honeysuckle
Creek upstream of the Perry Confluence (sub-catchment 14.04), Perry River upstream of the Honeysuckle
Kalbar Operations Pty Ltd | January 2021
In the matter of the Fingerboards Mineral Sand Project EES – Flooding and Hydraulics Page 11Confluence (sub-catchment 1.11) and Perry River downstream of the Honeysuckle Confluence (sub-
catchment 1.14).
For the 50% AEP (1 in 1.44-year ARI), all ten (10) temporal patterns for the 9-hr storm were simulated
hydraulically for the existing case.
The results were processed to determine the critical temporal pattern for each duration. For the purpose of this
preliminary assessment, and to minimise total computation time, only the critical temporal patterns were
simulated to assess the “Year5”, “Year8”, “Year15” and “Rehabilitation” cases. Impact maps contained in
Appendix C have been developed based on differences with the corresponding existing case duration and
temporal pattern.
The hydraulic model 1% AEP (1 in 100-year ARI) median flow for the sub-catchment “1.15” outlet location
(shown below) was compared to ensure consistency with the RORB model. The critical 1% AEP 12-hr duration
median flow is 363 m3/s, compared with 409 m3/s in the RORB model. Flows in the hydraulic model are
expected to be lower in the hydraulic model compared to the hydrology model largely due to the storages
present in the hydraulic model (such as natural channel storage, depressions and farm dams) that are not
replicated in the RORB model.
21020125_R03v01_Expert_Witness_Statement_James_Weidmann.docx
Kalbar Operations Pty Ltd | January 2021
In the matter of the Fingerboards Mineral Sand Project EES – Flooding and Hydraulics Page 12Moilun Creek Mitchell River
California Creek
Perry River
Honeysuckle Creek Confluence
“1.15” Flow Comparison Location
FIGURE 3-3 UPDATED TUFLOW MODEL LAYOUT
21020125_R03v01_Expert_Witness_Statement_James_Weidmann.docx
Kalbar Operations Pty Ltd | January 2021
In the matter of the Fingerboards Mineral Sand Project EES – Flooding and Hydraulics Page 13FIGURE 3-4 REHABILITATION LAND USE LAYOUT (KALBAR 2020)
3.3.4 Additional Modelling Results
Flood impact mapping is contained in Appendix C. The results are largely consistent with the previous
modelling. Differences can be attributed to the model changes discussed above, and particularly the adoption
of the latest TUFLOW version and Sub-Grid-Sampling enhancement. Note that the water level impact mapping
will look different to the previous mapping due to a change in output settings (map cut-off depth) but are both
derived the same way. The change in output settings was necessary given the fundamental difference in the
way the latest TUFLOW version is configured and solves hydraulic equations.
21020125_R03v01_Expert_Witness_Statement_James_Weidmann.docx
Hydrographs were extracted from the hydraulic model for two locations downstream for the site shown in
Figure 3-5 below. Figure 3-6 shows the 1% AEP (1 in 100-year ARI) 12-hr event for the existing and post-
rehabilitation (having the highest impact) cases. Figure 3-7 shows the 1% AEP (1 in 100-year ARI) 1-hr event
for the same scenarios. Impacts do not propagate downstream of the Honeysuckle Creek and Perry River
confluence by virtue of the much larger external catchment of the Perry River.
Kalbar Operations Pty Ltd | January 2021
In the matter of the Fingerboards Mineral Sand Project EES – Flooding and Hydraulics Page 14Honey01
PO_168
FIGURE 3-5 HYDROGRAPH LOCATIONS
21020125_R03v01_Expert_Witness_Statement_James_Weidmann.docx
Kalbar Operations Pty Ltd | January 2021
In the matter of the Fingerboards Mineral Sand Project EES – Flooding and Hydraulics Page 15No fundamental change in
critical storm in Perry River
downstream of Honeysuckle
Discharge (m3/s)
Time (hrs)
FIGURE 3-6 1% AEP 12-HOUR CRITICAL STORM HYDROGRAPHS
Localised increase in
Honeysuckle downstream
of site in critical storm
21020125_R03v01_Expert_Witness_Statement_James_Weidmann.docx
Discharge (m3/s)
Flows from much larger
external Perry catchment
dominate flooding downstream
Time (hrs)
FIGURE 3-7 1% AEP 1-HOUR CRITICAL STORM HYDROGRAPHS
Kalbar Operations Pty Ltd | January 2021
In the matter of the Fingerboards Mineral Sand Project EES – Flooding and Hydraulics Page 163.3.5 Impacts to Mitchell River
The flooding assessment in the Site Study Report demonstrated that the mine operations would not have any
adverse flooding impacts on the Mitchell River - refer to the flood mapping contained in Appendices B, C, D
and E of the report. Impacts were identified in local tributaries, however, no adverse impacts are predicted in
the Mitchell River by virtue of the much larger external catchment to the north which dominates flood conditions
in the Mitchell River. Impacts will therefore not propagate to the lakes downstream.
Figure 3-8 below shows a comparison of the Mitchell River 10% AEP flows and flows from selected site
tributaries in a co-incident 1% AEP event. The hydrographs demonstrate that the much larger external
catchment of the Mitchell River dominates flood conditions downstream of the site. Note that the regional flows
shown are for a 10% AEP event and a co-incident 1% AEP would result in significantly higher flows.
Regional Mitchell
River 10% AEP flows
Site tributary
flows for 1% AEP
FIGURE 3-8 REGIONAL VS SITE TRIBUTARY FLOWS
3.4 Response to Submissions
21020125_R03v01_Expert_Witness_Statement_James_Weidmann.docx
I reviewed submissions with comments relevant to my field of expertise. Table 3-5 contains submissions which
include substantial content relating to my area of expertise. I have provided a response to each of the
submissions separately below. Table 3-6 contains submissions which provide general comments or concerns
relating to my area of expertise. The general concerns tend to be common to many submissions, therefore, I
have provided a response to these recurring general concerns separately in Section 3.13. I note that many
other submissions mention “water” or “rainfall” but are not substantive in terms of flooding. I have not included
these in the lists below.
I have also considered and support Kalbar’s responses to a number of the IAC questions dated 11 December
2020. My responses to those questions are set out in Section 3.12.
Kalbar Operations Pty Ltd | January 2021
In the matter of the Fingerboards Mineral Sand Project EES – Flooding and Hydraulics Page 17TABLE 3-5 SUBMISSIONS WITH SUBSTANTIAL CONTENT RELATING TO MY FIELD OF EXPERTISE
# Title
716 Environmental Effects Statement, Draft East Gippsland Planning Scheme Amendment C156
and EPA Works Approval Application – Fingerboards Mineral Sands Project, Fingerboards and
Glenaladale
358 Fingerboards Mineral Sands Project Inquiry and Advisory Committee
268 Submission into the EES assessment for the proposed Mineral Sands Mine at Glenaladale
429 Submission by Bendigo District Environment Council to the Kalbar EES. 2020.
568 My Submission into the EES for the Proposed Mineral Sands Mine at Glenaladale.
812 EES Submission (Coleman Partnership)
TABLE 3-6 SUBMISSIONS WITH RECURRING GENERAL CONTENT RELATING TO MY FIELD OF EXPERTISE
Recurring General Issues Raised Submission #
Potential flooding impacts of dam failure. 70, 155, 191, 201, 239, 291, 524, 673, 713, 843
Extreme rainfall and east coast lows have not 70, 123, 135, 155, 168, 191, 201, 239, 524, 530, 673,
been considered. 712, 713, 837, 843, 866, 875, 896
Climate change impacts on flooding. 691, 813
3.5 Response to Submission #716
This submission requests an explanation of the supposed 3% Average Exceedance Probability (AEP) Mitchell
River spillway discharge design criteria. The submission states that “the water balance predicted 3 overflow
events during a 117-simulation period which corresponds to a 2.5% AEP event and a 37.5% probability that a
mine water discharge event will occur during the 15-year project life.”
It is correct that 3 overflows during a 117-year period corresponds to 2.5% AEP, however, the probability of
this occurring over a 15-year period is 32%, and not 37.5%. In any case, the mine contact and process water
dams have been sized to contain the volume of the 1% AEP (1 in 100-year ARI) 72hr storm. This storm event
was selected because it is representative of a storm event caused by an ‘east coast low’. Based on the water
balance modelling undertaken by EMM, the dams are predicted to spill less than once in 30 years (which
roughly equates to a 3.3% AEP, (1 in 30-year ARI)). This is because the dams are unlikely to be empty prior
to a significant rainfall event. The 1% AEP 72hr design specification only refers to the volume available
21020125_R03v01_Expert_Witness_Statement_James_Weidmann.docx
(containment capacity) and does not refer to the spillway design, which is typically designed to pass 0.1% AEP
(1 in 1000-year ARI) flows or higher, depending on the outcomes of a risk assessment to be undertaken at
detailed design.
3.6 Response to Submission #358
Under the heading, “Change in flow regime”, this submitter contends that whereas Section 7.6.3 of Appendix
A006 to the EES identifies an increase in the Perry River catchment discharges by 13%, the Regional Study
Report states a reduction in flows in the “Year 8” scenario. I am not able to find where it says this and believe
it may be based on a misinterpretation of the flood modelling results. According to the Regional Site Report,
“Modelling of existing conditions and mine development showed that runoff to the Perry River will increase
with mine operation. The increase reaches a maximum of 13% in the 8-year mining scenario for the small
upstream site catchments - which subsequently causes a 1.05% increase in the average annual runoff volume
in the Perry River.”
Kalbar Operations Pty Ltd | January 2021
In the matter of the Fingerboards Mineral Sand Project EES – Flooding and Hydraulics Page 18Under the heading, “Flooding” it is claimed:
◼ The change in topography following mine rehabilitation will increase the catchment boundary and
watershed of the Honeysuckle creek catchment.
◼ Modelling indicates that peak flows in the waterway downstream of the mine boundary will increase by
12.2m3/s, which equates to a 20% increase.
◼ Increased flood levels of 100 to 200mm downstream of the mine area and did not assess impacts further
downstream or to Perry River
As stated previously in this document, I do not agree that that the change in overall catchment area contributes
significantly to the impacts noted downstream in Honeysuckle Creek in the rehabilitation case. The overall
Honeysuckle Creek catchment will not be changed significantly. The impacts noted downstream are
predominantly attributable to the internal landform and land-use changes. Both these aspects of the design
and rehabilitation strategy can be refined and managed such that impacts are mitigated.
I have recommended that mitigation strategies be implemented to minimise offsite impacts. Nonetheless, it is
my opinion that water level impacts identified as part of this assessment are minor given that they are largely
contained to existing flood constrained land and predominantly affect heavily modified and rural farmland, and
do not affect freeboard provisions for any residential dwellings.
The results stated above by the submitter are consistent with the updated modelling; however, these impacts
are overstated given the conservative nature of the assessment (assuming water management dams are
full), and additionally noting that impacts can be mitigated with subsequent design phases and assessments.
In respect to impacts to the Perry River, this has been addressed as part of the additional assessment
undertaken since the preparation of the Site Study Report. Results are detailed in Section 3.3.4 of this
document. The results demonstrate that impacts will not propagate further downstream than the Perry River
confluence, including to Lake Wellington.
3.7 Response to Submission #268
This submitter claims that there is no flood data or modelling for the site. This is incorrect. All details of the
methodology and outcomes of the flood assessment undertaken has been detailed in the Site Study Report,
and additional flood modelling has been undertaken as detailed in Section 3.3 of this document.
The submitter also claims that rainfall totals up to 254mm in 24hrs are possible for the site.
According to BoM IFDs, rainfall of 254mm in 24hrs equates to approximately a 0.1% AEP (1 in 1000-year ARI)
event. This amount of rainfall is possible, but is very unlikely, and far exceeds the usually adopted standard
21020125_R03v01_Expert_Witness_Statement_James_Weidmann.docx
design event threshold for the design of most structures (generally the 1% AEP event). Depending on the
outcome of the dam safety assessments to be completed at the detailed design stage, dam spillways may be
designed to convey up to 0.1% AEP (1 in 1000-year ARI) flows.
I also note that according to the EMM Conceptual Surface Water Management Strategy and Water Balance
Report (Appendix A006 (Appendix A) of the EES), the highest recorded daily rainfall total (in 117-years of data)
is 206mm.
3.8 Response to Submission #429
This submitter raises concerns regarding the potential for dam failure. I have provided a response to all
submissions which contain references to dam failure in Section 3.13.2 below.
Kalbar Operations Pty Ltd | January 2021
In the matter of the Fingerboards Mineral Sand Project EES – Flooding and Hydraulics Page 19The submitter also alleges that Water Technology has not provided hydrological models for flooding events.
Details of the hydrological modelling undertaken for the Fingerboards are contained in the Site Study Report,
and in Section 3.3 of this document.
3.9 Response to Submission #568
Under the heading “Water/Rainfall not accurate”, this submitter claims that rainfall measured at the
Fingerboards site very rarely matches gauges at Mt Moornapa, Lindenow or Glenaladale. The submitter also
claims that the BoM has no idea of the rainfall that falls on the Fingerboards plateau and that BoM’s erroneous
rainfall data will result in engineered structures not strong enough to withstand a 1-in-100-year weather event
or extreme events. The submission presents examples of varying rainfall from two time periods (July 2020 and
June-Dec 2007) claiming Fingerboards receives approximately 20% more rainfall than at his residence.
The submitter’s concerns may be grounded in some truth, in that micro-climates can exist and rainfall patterns
can vary significantly over small distances. However, rainfall patterns tend to vary where there is significant
topography or landform changes. The submitter’s property is on the eastern fringes of the site, located only
5 kms from the Fingerboards and the topography change is unlikely to be a contributor to the alleged rainfall
differences. Rain gauges located 5kms apart will naturally vary and can sometime vary significantly over short
time periods. The rain gauge differences noted in the submission are likely due to erroneous measurements.
Additionally, measurements from only two time periods is not enough to draw any significant conclusions
regarding spatial rainfall distribution.
The submitter’s assertions are also not supported by AWAP (Australian Water Availability Project) gridded
rainfall data, which comprises high-resolution daily rainfall gridded datasets from 1900 onwards. The dataset
is derived by analysing thousands of rain gauges to produce an interpolated rainfall depth surface (or grid)
covering the whole of Australia. The same datasets are used to derive IFD curves used for design event
modelling undertaken as part of this project and which will be used to inform future detailed design. The
resolution of the dataset (5km x 5km) is very high considering its spatial coverage, however, it is limited in
detecting micro-climates if local rain gauges are present to capture this variability. Nonetheless, according to
the AWAP data, 630mm of rain fell over the Fingerboards area for the June-December 2007 period. This
compares to 687.5mm and 412.5mm measured by the submitter at Fingerboards and his residence
respectively. Although the AWAP data is slightly lower, this indicates that the AWAP data (and by extension
the adopted design rainfall depths) appropriately represent rainfall total for the Fingerboards area and that the
measurement taken on the submitter’s property is likely to be erroneous. AWAP does not contain data for
2020.
The SILO Gridded Rainfall dataset1 is also derived using the rainfall data relied upon for the IFD calculations.
This dataset is similar to the AWAP data, but derived using different techniques. According to the SILO data,
21020125_R03v01_Expert_Witness_Statement_James_Weidmann.docx
668mm fell the Fingerboards between June-December 2007. SILO data also suggests 131mm fell over the
shorter time period of July 2020, which is similar to the 136mm measured by Mr Johnson on his property, but
lower than the 175 measured at the Fingerboards. More variability will naturally occur over shorter timeframes,
and the measured difference is not sufficient justification to adopt increased IFDs to inform future designs.
The comparisons with the AWAP and SILO rainfall datasets confirms that the rainfall data relied upon for the
project (specifically the IFD rainfall depths) is appropriate for the site.
Under the heading “Water and Flood Gauges Future 1-in-100-year events”, Mr Johnson questions whether
the impacts on his property and in the Mitchell River floodplain are appropriately representing actual impacts.
1Jeffrey, S.J., Carter, J.O., Moodie, K.B. and Beswick, A.R. (2001). Using spatial interpolation to construct a
comprehensive archive of Australian climate data, Environmental Modelling and Software, Vol 16/4, pp 309-330.
DOI: 10.1016/S1364-8152(01)00008-1.
Kalbar Operations Pty Ltd | January 2021
In the matter of the Fingerboards Mineral Sand Project EES – Flooding and Hydraulics Page 20Hydrologic and hydraulic modelling undertaken as part of my assessments confirms that any flooding impacts
caused by the mine will be contained onsite, or to tributaries downstream. Results in respect to impacts on the
Mitchell River are summarised in Section 3.3.5 of this document. Impacts do not affect the main Mitchell River
channel by virtue of the much larger external Mitchell River catchment upstream of the site. The modelling
utilises hydrology extracted from a calibrated model for the Mitchell River and is reliable and representative of
flooding in the catchment.
The submission also questions why there isn’t another dam capturing run-off from north and northeast of the
processing/truck loading facilities. The submission claims this generates 1.5 times more run-off than that going
to Dam 18. I am unable to discern how this claim has been arrived at. In any case, all mine contact water
(including run-off from the processing and truck loading facilities) will be directed to water management dams.
On Page 12 of the submission, there is a photo with the label “Culvert following from tailing dam area estimated
to flowing at 3gl per day in recent rain”. It is unclear how the 3 GL per day figure has been estimated. However,
if it is an estimate of the total flow at the culvert location shown in the photo, this is clearly in error as 3 GL in
24 hours (on average approximately 35,000 m3/s) is an extremely large and unrealistic amount of flow in this
instance. It is not clear where the culvert is located or what rainfall depths occurred, so I am unable to estimate
the flow myself. However, the submitter’s estimate is likely to be out be a factor of 1000 to 10,000.
3.10 Response to Submission #812
Under the heading “East Coast Lows”, this submitter contends that east coast lows occur randomly, frequently
and are a major risk. Rainfall at Fingerboards has been recorded as significantly higher than at properties
5kms away. I presume this submission is referring to the measurements referred to in Submission #568 – in
which case, see my response to Submission #568 above.
The submission also asserts that dams must be constructed to the “new ANCOLD requirement of 1 in 1000-
year event, rather than the 1 in 100-year flood events”. The mine contact and process water dams have been
sized to contain the volume of the 1% AEP (1 in 100-year ARI) 72hr storm. This storm event was selected
because it is representative of a storm event caused by an ‘east coast low’. Based on the water balance
modelling undertaken by EMM, the dams are predicted to spill less than once in 30 years (which roughly
equates to a 3.3% AEP, (1 in 30-year ARI)). This is because the dams are unlikely to be empty prior to a
significant rainfall event. The 1% AEP 72hr design specification only refers to the volume available
(containment capacity) and does not refer to the spillway design, which is typically designed to pass 0.1% AEP
(1 in 1000-year ARI) flows or higher, depending on the outcomes of a risk assessment to be undertaken at
detailed design.
Design of the water management and tailings dams are a civil design matter and will be designed in
21020125_R03v01_Expert_Witness_Statement_James_Weidmann.docx
accordance with the latest ANCOLD guidance as specified in the Mitigation Register (Attachment H of the
EES). Details can be provided when those structures undergo detailed design.
3.11 Response to Submission #813
This submission states that climate change is a major risk for the industry and its impact has not been
adequately addressed. I have provided a response to all submissions which contain references to climate
change and flooding in Section 3.13.3 below.
3.12 Response to IAC Request for Information
The IAC submission requests an explanation of the supposed 3% Average Exceedance Probability (AEP)
Mitchell River spillway discharge design criteria and why this is different to the Perry River design criteria of
Kalbar Operations Pty Ltd | January 2021
In the matter of the Fingerboards Mineral Sand Project EES – Flooding and Hydraulics Page 211% AEP, which is a more widely adopted design criteria for mine water runoff. Please refer to my previous
response to Submission #716 in Section 3.5 above.
The IAC requests information on the indirect impacts of the railway siding on the wetland area including
potential changes in the hydrological regime.
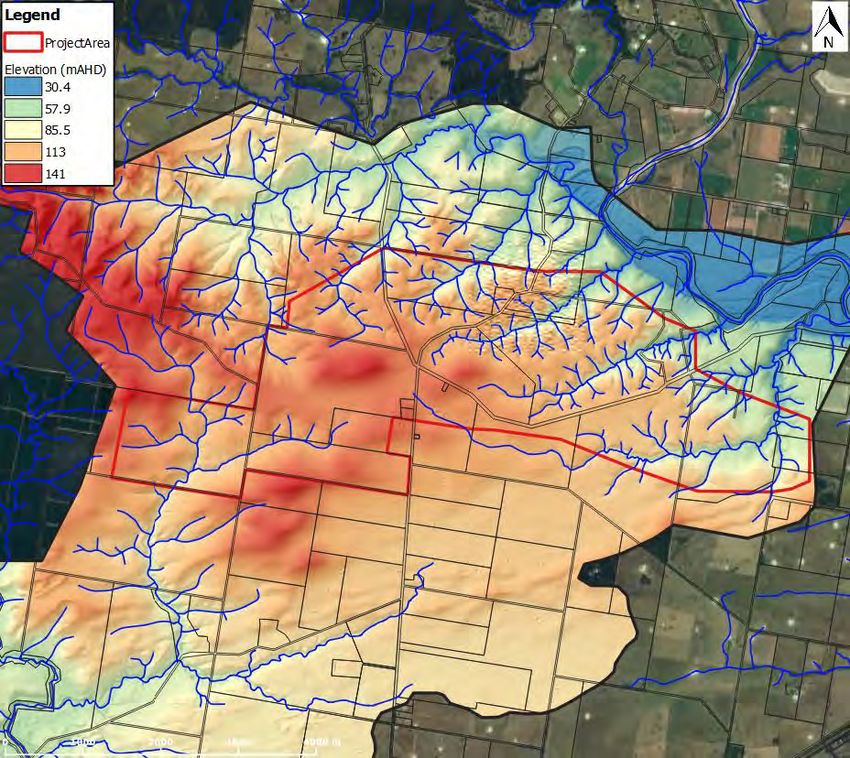
The preferred rail siding site (shown in Figure 3-9 below) is located outside of the available detailed (1m)
LiDAR extents, so it is not possible to undertake a detailed hydraulic assessment at this stage. Shuttle Radar
Topography Mission (SRTM) data is available as shown below, and is adequate for showing the approximate
catchment contributing to Saplings Morass. To ensure that the hydrological regime of Saplings Morass is not
affected by the proposed new rail corridor, several cross-drainage culverts will be required to preserve the
existing flow regime as much as practicable. Indicative locations of the culverts are shown below, noting that
the most southerly of these should be sized to cater for overflows from the morass.
The culverts (or bridge structures) can be designed to maintain exiting conveyance such that the existing water
levels, duration of inundation and flow paths of the morass are not adversely impacted. Note that the majority
of the morass catchment is not affected by the rail corridor.
The alignment of the preferred rail siding is parallel with and immediately upslope of the existing rail corridor,
thus minimising potential impacts to stormwater runoff. The rail siding itself will not affect Saplings Morass.
The minor catchment upstream of the rail siding can be readily managed with standard stormwater drainage
and diversions to maintain the existing discharge points across the existing rail corridor to the immediate south.
Stormwater drainage for the proposed new rail corridor and siding are matters for detailed design, but it is my
opinion that with standard detailed drainage design, neither will have any adverse hydrological impacts on
Saplings Morass or impacts further downstream.
21020125_R03v01_Expert_Witness_Statement_James_Weidmann.docx
Kalbar Operations Pty Ltd | January 2021
In the matter of the Fingerboards Mineral Sand Project EES – Flooding and Hydraulics Page 221m LiDAR
Approximate Saplings
Morass Catchment (1.37km2)
Standard stormwater
drainage design to manage
minor upstream catchment
Extent of detailed LiDAR
SRTM Topography
Cross drainage required to
preserve existing flow regimes
21020125_R03v01_Expert_Witness_Statement_James_Weidmann.docx
FIGURE 3-9 PREFERRED RAIL SIDING ALIGNMENT
The IAC requested information on flood modelling undertaken to demonstrate changes to flood level and
impact on the catchment, private property, and public infrastructure, until discharge of surface water to Lake
Wellington.
The flooding assessments undertaken demonstrate that the mine operations will not have any adverse flooding
impacts on the Mitchell River. Refer to the flood mapping contained in the flood report. Impacts were identified
in local tributaries, however, no adverse impacts are predicted in the Mitchell River by virtue of the much larger
external catchment to the north which dominates flood conditions in the Mitchell River. Impacts will therefore
not propagate to the lakes downstream.
Section 3.3.5 contains a figure showing a comparison of the Mitchell River 10% AEP flows and flows from
selected site tributaries in a co-incident 1% AEP event. The hydrographs demonstrate that the much larger
Kalbar Operations Pty Ltd | January 2021
In the matter of the Fingerboards Mineral Sand Project EES – Flooding and Hydraulics Page 23external catchment of the Mitchell River dominates flood conditions downstream of the site. Note that the
regional flows shown are for a 10% AEP event and a co-incident 1% AEP would result in significantly higher
flows.
3.13 Response to Recurring General Concerns
I have provided a response below to general flooding matters raised in numerous submissions as summarised
in Table 3-6.
3.13.1 Extreme Rainfall and East Coast Lows
Many submissions contend that east coast low events pose a significant flood risk for the project and have not
been considered. As part of the flooding assessment undertaken, I have assessed a worst-case flooding
scenario involving the 1% AEP event with dams full, which is consistent with the intensity and pattern of rainfall
typically associated with east coast lows.
Submission #70 alleges that up to 200mm of rain can fall on the site within a 24-hour period. Based on the IFD
data (derived by BoM) which was used for the flooding assessments, the 1% AEP 24-hour design rainfall depth
is 186mm, which is not dissimilar to the alleged amount. Also, as noted previously, the highest recorded 24-
hour rainfall total (in 117-years of data) is 206mm.
Submission #896 alleges that 200-300mm of rain can fall in three (3) days. Based on the IFD data, 1% AEP
72-hour design rainfall depth is 238mm, which is again entirely consistent with the rainfall totals that are
associated with east coast low events.
Furthermore, a comparison of AWAP and SILO rainfall datasets undertaken as detailed in the response to
Submission #568 above confirms that the IFD data relied upon for the project is appropriate for the site.
In terms of the timing of dam construction and commissioning, east coast lows are a well-known risk and can
be managed with appropriate dam construction scheduling, weather forecast monitoring and implementation
of normal civil design safety and risk management procedures.
3.13.2 Risk of Dam Failure
Several submissions have raised issues regarding dam safety, the potential for cascading dam failures and
associated impacts downstream. Dam failure impact assessments were not within the scope of the flooding
assessments undertaken thus far, and are typically completed at the detailed design stage. Dam failure
assessments (particularly cascading failures) are not usually undertaken at the preliminary design stage and
21020125_R03v01_Expert_Witness_Statement_James_Weidmann.docx
provide little benefit without detailed civil design of the dams being available. Dam failure assessments can be
conditioned and can be readily undertaken with subsequent detailed design.
The mine contact and process water dams have been sized to contain the volume of the 1% AEP (1 in 100-
year ARI) 72hr storm. This storm event was selected because it is representative of a storm event caused by
an east coast low as previously shown. The final design of the water management and tailings dams are a civil
matter and will be designed in accordance with the latest ANCOLD guidance, including embankments and
spillways etc., as specified in the Mitigation Register (Attachment H of the EES). Details can be provided when
those structures undergo detailed design.
Further, the Mitigation Register commits to several management measures to minimise the risk of dam failure,
including the following:
◼ (SW05) - Freeboards on the water storage dam, process water dam and sediment ponds will be
maintained to allow for storm events and high rainfall periods, in accordance with relevant licence, permit
and approval requirements.
Kalbar Operations Pty Ltd | January 2021
In the matter of the Fingerboards Mineral Sand Project EES – Flooding and Hydraulics Page 24You can also read