Genetic linkage and association studies in celiac disease: discoveries from whole genome analysis - Svetlana Adamović
←
→
Page content transcription
If your browser does not render page correctly, please read the page content below
Genetic linkage and association studies in
 celiac disease: discoveries from whole
             genome analysis

                Svetlana Adamović

  Department of Medical Genetics and Clinical Genetics
                Institute of Biomedicine

              The Sahlgrenska Academy
                           at
                University of Gothenburg
                        Sweden

                                                         1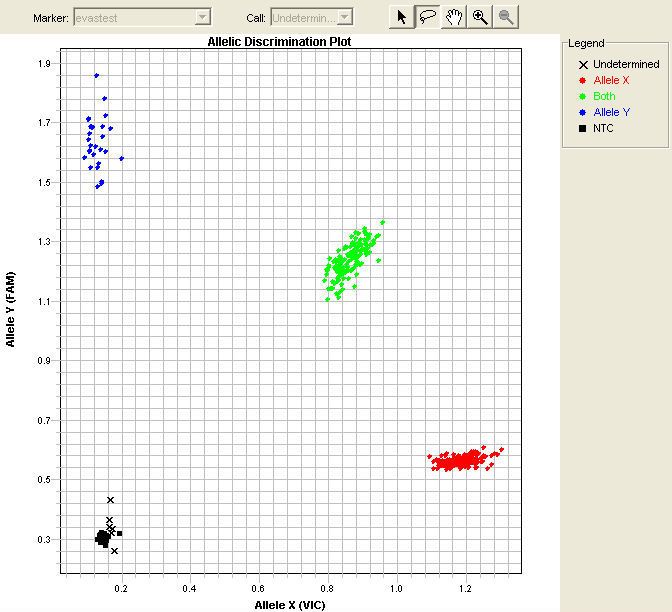
2
PREFACE

One of the most exciting moments a geneticist may experience is finding The
Gene or genetic variant responsible for the disease or trait he/she is dedicated
to. The way to the goal is very often a roller coaster, with it’s slowly ups and
speedy downs, neck breaking loops and twisted curves, but yet – nobody wants
to get off. We are searching in the dark, playing hide-and-seek, swinging from
the highest excitement to the deepest depression (in a few hours sometimes…)
but we enjoy every single moment of it.

Even if I don’t give you any big answers in this book, I am still immeasurably
proud that you are holding it in your hands. It is because I learned, during my
time as a researcher in this project, that - even if we don’t reach the end point of
our journey, we can still make a great contribution travelling to it.

                                  May you find what you are looking for.

                                                                    Chinese course

                                                                                  3
4
ABSTRACT

Celiac Disease (CD) or Gluten Sensitive Enteropathy (GSE) is a life-long
disorder. It is characterized by inflammation in the small intestine of genetically
predisposed individuals caused by inappropriate immune response to gluten, a
protein enriched in some of our common grains (wheat, rye and barley). The
toxicity of gluten is manifested by the autoimmune action of T-lymphocytes on
mucosal cells in the small intestine, disrupting its vital function of absorbing
nutrients from the food. The disease affects predominantly children, but it can
develop later in life as well. Untreated CD involves risk for major
complications: Dermatitis herpetiformis (“the celiac disease of the skin”),
nutritional deficiencies, osteoporosis, anaemia, fertility problems, neurological
disturbances and malignancies. The only known treatment for CD is a lifelong
adherence to gluten-free diet (GFD).
In a Scandinavian genome wide scan, performed by our group and published in
2001, eight chromosomal regions apart from HLA showed nominal significance
(p < 0,05), among them 5q31-33. This region was previously suggested as a
susceptibility region in other complex diseases: asthma, type 1 diabetes,
rheumatoid arthritis and inflammatory bowel disease.
The main goal of this study was to explore the region of 18cM on 5q31-33,
identify genetic risk factors and evaluate their contribution to the development
of CD. In 2003 a joint analysis of four independent genome scans was
performed by the European Genetics Cluster on Coeliac Disease, a collaborative
work between six European research groups, including our. Data from Italian,
Finnish, UK and Swedish/Norwegian cohorts, a total of 442 families, was
pooled together and analysed. The meta-analysis using pooled data confirmed
5q31-33 as the second most significant region after the HLA region.
After the meta-analysis, we applied a fine mapping strategy on the 18cM region
on 5q31-33. The most essential result of this study was the strengthened linkage
signal on 5q31-33
In 2006 we used the Illumina platform (GoldenGate assay technology) to
perform an extensive screen of the region on 5q31-33. This study identified
seven associated regions within 5q31-33 and a number of associated haplotypes
but none of the association signals could explain the linkage peak observed in
the families previously.
In 2007 we performed a follow-up study of the association to the region
comprising IL2/IL21 genes on 4q27, reported in the first genome-wide
association study (GWAS) in celiac cases and controls. We confirmed that the
IL2/IL21 region is a susceptibility region in CD.

                                                                                 5
Unfortunately, the first GWAS failed to identify specific genes predisposing to CD. The GWAS as well as our own fine mapping study pointed out the difficulties scientists face in searching for the causing variants in complex diseases. It appears that causing variants may be hard to detect with association analysis alone because of the strong linkage disequilibrium in associated regions. However, the GWAS detected a number of CD associated genomic regions which remain to be explored. 6
INDEX
PREFACE                                            3

ABSTRACT                                           5

INTRODUCTION                                       9

THE WORLD OF GENES                                 9
  GREGOR MENDEL                                   10
  POLYGENIC INHERITANCE                           12
  MENDELIAN VS COMPLEX TRAITS                     13
  CELL DIVISION                                   14
  THE CENTRAL DOGMA OF MOLECULAR BIOLOGY          16
  CROSSING OVER / RECOMBINATION                   18
  GENETIC LINKAGE                                 19
  MUTATIONS                                       20
  POLYMERASE CHAIN REACTION, PCR                  21

FINDING GENES                                     23

GENETIC LINKAGE AND ASSOCIATION                   23

GENOME-WIDE ASSOCIATION STUDIES (GWAS)            26

CELIAC DISEASE                                    27

GLUTEN – NUTRITIOUS OR TOXIC?                     27

CLINICAL MANIFESTATIONS OF CD                     29

EPIDEMIOLOGY OF CD: the famous “Celiac Iceberg”   29

GENETICS OF CD                                    30

THIS STUDY                                        35

BACKGROUND                                        35

AIM                                               36

MATERIAL & METHODS                                36
 FAMILIES                                         36
 GENOTYPING: Concept of genetic markers           36

THE WORKFLOW AND DISCUSSION OF RESULTS            39
  PAPER I: THE META-ANALYSIS                      39
  PAPER II: THE FINE MAPPING STUDY                40
  PAPER III: THE COMPREHENSIVE SCREEN STUDY       40

                                                   7
PAPER IV: REPLICATION OF ASSOCIATED HAPLOTYPES 41
PAPER V: ASSOCIATION OF IL2/IL21 REGION AND FcgRIIa IN CD 41
CONCLUDING REMARKS AND FUTURE PERSPECTIVE 42
ACKNOWLEDGEMENTS 44
REFERENCES 46
8INTRODUCTION
THE WORLD OF GENES
Life is just four letters…
Every living being on this planet has its very own life code written by four
letters only: A, C, G and T. These letters represent the four nucleotides (A =
adenine, C = cytosine, G = guanine and T = thymine) which build up the
deoxyribonucleic acid molecules, the DNA. Different arrangements of
nucleotides in the DNA provide the key to diversity among living organisms.
But, there is one rule to obey: A always pairs with T and C always pairs with G,
which means that whatever amount of A in the DNA – the amount of T is equal.
Similarly, whatever amount of C – the same amount of G is present in the DNA
(Chargaff’s rule). The ratio of A+T : C+G vary between species and make them
unique.
The four letters are lined in rows, like strings of pearls, telling the story about
the individual carrying them. And it is a long story: the DNA of a single cell
contains information equal to almost 600 000 printed pages of 500 words each, a
library of about 1 000 books! The DNA from an average human, unwound and
joined together, makes the string that could stretch from the Earth to the Sun 400
times, a distance of 93 million miles - one way.
The DNA molecule is shaped like a twisted zipper, consisting of two perfectly
fitting strands. It is called a double helix. Almost every cell in our bodies
contains nearly two meters of DNA. In order to fit into the cell nucleus, which is
only 1/10 of the cell’s volume, the DNA undergoes remarkable twisting and
coiling and gets tightly packed into the chromosomes. Each chromosome
consists of two chromatides. There are two types of chromosomes: autosomes
and sex chromosomes. Humans have 22 pairs of autosomes and one pair of sex
chromosomes (XX or XY). Together they are making the human genome.
Chromosome pairs are passed to us from our parents, one chromosome in each
pair comes from our mom, the other one from our dad. So, we have 46
chromosomes in our cells, with one exception - our germ cells, female eggs and
male sperms. They only have one half of every pair, altogether 23
chromosomes. When they meet and get united a new individual is created with
46 chromosomes in this very first cell. Whether it is going to be a boy or a girl is
decided by the sex chromosome carried by the sperm: an X gives a girl, a Y
gives a boy.
Traits are passing from generation to generation. We resemble our parents, or
maybe our grandparents, but are clearly distinct from them. It looks like we
9inherit our characteristics in a random, “blended” manner, but the process is carried out with perfect precision. The first one to demonstrate the principles of inheritance was GREGOR MENDEL Planting the seeds of genetics Mendel was a nature loving Augustinian monk, living in 19th century Brünn, Austria (today Brno, Czech Republic). His interests in plants led him into studies of how traits were inherited. Inspired by Jean-Baptiste de Lamarck, Mendel wanted to illustrate the influence of the environment upon plants. Instead, he observed that the offspring retained the important traits from its parents and concluded that environment had no effect on the inheritance. Hereby, the idea of heredity was born. Mendel didn’t know anything about chemistry of inheritance. He applied a very sophisticated experiment using the plants of the garden pea, Pisum Sativum, bred the plants repeatedly and observed only the outward appearance of the progeny, one character at the time. The outwards characteristics or physical traits are today called phenotypes. The brilliance of Mendel’s work was based on understanding statistics even before the formal statistics was developed. He observed that inheritance follows certain numerical patterns and that some traits appeared more often then others. He even observed that some traits “disappeared” in the first offspring generation and then re-appeared in the next, when plants were pollinated with the plants from the same generation or were allowed to self-pollinate. He kept careful records and published his findings in 1866, but nobody took notice. The biologists of that time were occupied by Charles Darwin’s evolutional theory. It took more than 30 years for the scientific community to recognize Gregor Mendel’s work. Mendel postulated rules that explain factors affecting heredity. Today we call them Mendelian laws of inheritance. 10
Mendelian law of unit characters: An individual inherit two factors (alleles)
affecting the actual trait, one from each parent.
Mendelian law of dominance: One of the factors may dominate or hide the
other. The trait observed in the offspring is the dominant trait. The trait that
disappears in the offspring is the recessive trait.
Mendelian law of segregation: The two factors affecting the trait must separate
in the parental generation, when gametes are formed. A parent randomly passes
one allele for each trait to each offspring.
Mendelian law of independent assortment: The factors affecting different
traits are inherited independently of each other.

Today we call the two factors (alleles), which an individual inherit from its
parents, a genotype. Each genotype consists of two alleles, one from each parent.
An allele is the genetic information in a certain position (locus) on the parental
chromosome. The two alleles come from the exact same position on the
mother’s and on the father’s chromosomes. If an allele is dominant, we write it
with capital letter (A, B, C), if it is recessive we use lowercase (a, b, c). If both
alleles are the same, the individual is homozygous for given trait. When the
individual inherit two dominant alleles it is said to be homozygous dominant; if
the individual inherit two recessive alleles it is said to be homozygous recessive.
In contrast, if the inherited alleles are different, the individual is heterozygous.
Since the dominant allele always is expressed, the individual is said to be
heterozygous dominant.

In the world of genetics it is like in the real world: there is no rule without
exceptions. Those exceptions were not discovered by Mendel and are therefore
called non-Mendelian inheritance:
Incomplete dominance or co-dominance: a type of inheritance where both
alleles for a specific trait are expressed, which results in a combined phenotype
(like pink flowers when you cross plants with red and white flowers).
Sex-linked inheritance: when the trait is controlled by genes located on sex
chromosomes. Those traits show up exclusively or more frequently in one sex.
Examples are haemophilia and red-green colour blindness in males.
Polygenic inheritance: simply opposite from pleiotropic inheritance - several
genes affect the same trait. The perfect examples of polygenic inheritance are
eye1 and skin colour, and the subject of this thesis – celiac disease.

                                                                                  11
POLYGENIC INHERITANCE
When 1 + 1 + 1 = 1
This type of inheritance, occurs when a group of alleles or genes act together to
produce a certain trait, each pair of alleles contributing with a small effect. This
may result in a wide variety of different phenotypes. Such traits are normally
distributed (Figure 1).
Parental generation
1st generation offspring
2nd generation offspring
Figure 1. Polygenic inheritance of skin colour. This trait is governed by several genes.
Variety of possible phenotypes is shown in the diagram.
Sometimes, in case of disease, this interaction of many alleles or genes may not
produce but rather predispose to trait. Often the trait needs interplay between
genetic and environmental factors in order to be expressed, like celiac disease.
Such polygenic traits are called multifactorial or complex traits.
12MENDELIAN VS COMPLEX TRAITS
In Mendelian inherited traits or diseases there is a direct correspondence
between the phenotype and the causative gene(s). These diseases are rare, have a
classic inheritance pattern and can develop as a result of a mutation in a single
gene. Such mutations are sometimes family specific. Phenotypically, these
diseases are usually very uniform.
Complex diseases, in contrast to Mendelian, develop in genetically predisposed
individuals as an accumulated effect of environmental exposure over time2.
They are common in populations and display a wide range of phenotypic
variations. Genetic components of complex diseases are complicated to identify.
In most cases they are not directly disease causing but rather mediate the disease
risk. Many different genetic variants contribute with modest effects in disease
development, and often those variants are common for similar diseases (like
autoimmune disorders).
HIGH Mendelian disease
Gene effect on disease
Complex disease
LOW
LOW Frequency in population HIGH
Figure 2. Mendelian and complex disease, a comparison. Mendelian diseases have a lower
frequency in the population compared to complex diseases. On the other hand, Mendelian
diseases are caused by a single or very few genes with greater effect on disease development
compared to complex diseases. (Based on Juran et al2).
13CELL DIVISION
Simple in principle, complicated in practice
There are two major characteristics of an organism - growth and reproduction.
Both of them are achieved by cell division.
Growth is due to mitosis, a process of cell division resulting in two identical
copies of the original cell. Before the cell starts dividing, the chromosomes are
duplicated by the process called DNA replication. The double helix unwinds and
the two strands separates. Each strand is now a template for a new DNA
molecule. New strands are formed by pairing complementary bases with the old
strands. Two new molecules are made; each has one new and one old strand.
They are both identical to the original DNA molecule.
Parental DNA molecule
1st replication
2nd replication
Figure 3. DNA-replication. The synthesis of the DNA using itself as a template. In the first
replication cycle, the parental DNA molecule (indicated by rough lines) unwinds making two
templates for the synthesis of new strands. After each replication cycle the daughter
molecules contain one parental strand and one newly-replicated strand.
Mitosis precisely and evenly divides duplicated chromosomes, providing each
new cell with an identical and complete set of genetic instructions. Of course,
the other cell components (organelles and cytoplasm) are also duplicated and
14divided. Ploidy of new cells, which refers to the number of pairs of
chromosomes, is diploid (2n, two of each chromosome).
Duplication of
Nucleus genetic material
Parental
cell
DNA
Daughter
cells
DNA replication Cell division
Figure 4. Mitosis. Cell division starts with DNA replication (duplication of all genetic
material) in the nucleus of the cell. Other cell components duplicate as well. Finally, two new
daughter cells are made identical to the parental cell. The ploidy of both parental and daughter
cells is diploid (2n).
In contrast to mitosis, meiosis is a cell division resulting in two new cells with
only ½ of the genetic material from the original cell. It only occurs in germ cells
of sexually reproductive organisms. Meiotic cells passes through two stages,
meiosis I when the homologous chromosomes separates into new cells, and
meiosis II when the two chromatides of each chromosome separates into new
cells. This means that the ploidy of cells which have undergone meiosis is
haploid (n, one of each chromosome).
DNA replication Cell division
Meiosis I
Cell division
Meiosis II
Figure 5. Meiosis. Cell division in germ cells. The first cell division (meiosis I) is identical to
mitosis (see figure 4). It starts with a diploid cell (2n) and ends with two new diploid cells
(2n). Then the cells undergo another cell division without DNA replication, meaning that cell
division results in new haploid (n) cells with only ½ of the genetic material compared to the
parental cell.
15THE CENTRAL DOGMA OF MOLECULAR BIOLOGY
In a talk given 1957, Francis Crick proposed a model of cellular function known
as The Central Dogma of Molecular Biology (Figure 6). It was published in
19583. His model, which has been revised many times, describes the information
flow from DNA to a functional protein in the cell.
DNA
(information)
DNA
replication
Transcription
messenger RNA
(information)
Translation
Ribosome
Protein
Figure 6. The Central Dogma of Molecular Biology. DNA duplicates itself and the
information it carries in the process called DNA replication. In the transcription step the DNA
is used as a template in synthesis of messenger RNA (mRNA), which is representing the gene
coding information. mRNA is in turn a template for process called translation, synthesis of a
protein coded by the given gene. Translation is performed by the enzyme complex called the
ribosome. Proteins carry out almost all cellular processes in a living cell.
The pathway starts with DNA replication, a duplication of the information using
DNA as a template. Next step is transcription, synthesis of RNA using DNA as
a template. RNA is a single stranded molecule with a sequence complementary
to the DNA strand being copied, with one difference – thymine (T) is replaced
by uracil (U).
Only coded parts of DNA are transcribed so that the RNA-molecule contains
information needed for production of a protein. RNA goes through a processing
step, when intron sequences are being cut from the rest of the coding
information, resulting in a shorter molecule called mRNA, messenger RNA.
This process is even called nuclear processing (Figure 7).
The flow of information is so long carried out in the nucleus of the cell. After
processing, the mRNA-molecule is being transported outside the nucleus, to the
16cytoplasm, where the next step is taking place: protein synthesis or translation.
This process involves large molecular complexes called ribosomes.
Coding sequence of DNA (gene)
TRANSCRIPTION
Newly syntethized RNA (T=U)
RNA PROCESSING
RNA PROCESSING
RNA PROCESSING
mRNA
Figure 7. From DNA to mRNA. Flow of information in the cell nucleus.
They are “scanning” the information carried by the mRNA, reading the code
defined by nucleotide triplets and translating it into amino acids. These are the
building stones of proteins. Each amino acid has its own code (or codes, since
there are several nucleotide triplets coding for the same amino acid). There are
20 different amino acids with varying properties. They are transported to the site
of protein synthesis by another type of RNA-molecules called transport RNA
(tRNA).
Ribosomes read the mRNA sequence, translate it and synthesize the protein by
adding one amino acid after another to the growing chain (Figure 8). The
process of protein synthesis terminates when the ribosome scans the “stop-
codon” (UAG, UGA or UAA) on the mRNA. Afterwards, the protein undergoes
conformational changes necessary for its function and than it is ready for action.
Amino
acid tRNA
tRNA
Amino
tRNA
acid
tRNA
tRNA STOP
tRNA UAG
START UGA
AUGGCGUU AGCCUA UAA
Ribosome mRNA
Growing polypeptide chain (protein)
Figure 8. From mRNA to protein – translation.
17CROSSING OVER / RECOMBINATION Mother Nature’s own bioengineering One important event during the meiosis I is the crossing over of chromatides. The two homologues break at identical positions and then the “broken” sections join the other homologue (Figure 9). This creates new combinations of alleles on each chromosome called recombinants. Crossing over occurs randomly at least once and sometimes several times on every chromosome. This helps “mixing” the genes the offspring inherit from its parents. The farther apart two genes are, the greater the chance of crossing over occurring between them and the greater the chance of recombination between them. It occurs randomly between two homologous DNA segments, thus the frequency of recombination between two sites is reflecting the physical distance between the sites. The average proportion of times recombination occurs between two locations on the chromosome (loci) per meiosis, is referred to as recombination fraction, θ. It varies from 0 for two completely linked loci and 0.5 for two unlinked loci (maximum value 0.5 corresponds to 50% chance for recombination). Figure 9. Crossing over. Sometimes during the cell division the two chromosomes of a homologous pair may exchange segments, producing genetic variation. One genetic map unit or 1 M (morgan) is the distance between two loci for which the average number of crossovers is 1. Smaller units, centi-morgans (cM), are more convenient to use. 1cM corresponds to about 750,000 to 1,000,000 base pairs in humans and is named after the pioneering geneticist Thomas Hunt Morgan. Probability of crossing over increases with increased distance between the two loci and is not constant over the chromosome. There is a strong inhibition of crossing over near the centromere, e.g. For unknown reason, there are regions on 18
the chromosome where recombination occur more frequently than in other parts.
Such regions are called hot spots of recombination.
If there is no recombination between two genes, they will be passed together to
the offspring. Such genes are said to be linked together.

GENETIC LINKAGE

Building genetic maps
Linkage in humans can be detected using pedigree analysis and following the
pattern for inheritance of a trait from parents to their children. If the trait is often
passed to the next generation together with specific markers, then we can
conclude that genes governing the trait are located close to these markers on the
chromosome. Generally, genetic markers used in linkage studies are sites of
heterozygosity, a kind of silent DNA variation that is not associated with any
measurable phenotypic expression. The most frequently used types of markers
are microsatellites and single nucleotide polymorphisms (SNPs).
Microsattelites are short DNA sequences arranged in a repetitive pattern. They
are also called short tandem repeats. Microsatellites can be up to six nucleotides
long: two-nucleotide repeats (CACACA…), three-nucleotide repeats
(CTGCTGCTG…), tetra repeats of four nucleotides (ACTCACTCACTC…)
The number of times the sequence is repeated often varies between individuals
in the population, which makes microsatellites very suitable for following the
inheritance pattern in pedigrees. They are abundant, evenly distributed through
the genome and highly polymorphic. Estimated number of microsatellites in the
human genome is ~ 165.0004. Microsatellites are inherited according to
Mendelian laws5.
The other types of genetic variances are single nucleotide polymorphisms,
SNPs. As the name clearly implies, they occur when a single nucleotide in a
certain position in the genome varies between individuals. SNPs are highly
abundant in the human genome and are found with much higher frequency in
non-coding than in coding regions. According to dbSNP build 129 (April 2008)
there     are     14,708,752     SNPs       in    the     human      genome
(http://www.ncbi.nlm.nih.gov/projects/SNP/), of which 6,573,789 are validated
by independent re-sequencing.
In contrast to genetic maps, the physical maps are made by sequencing the DNA
which gives the exact position of every gene and nucleotide on the chromosome.

                                                                                     19
MUTATIONS
For better or for worse…
Mutations are changes in DNA sequence. They can be caused by radiation (X-
rays, cosmic rays, man-made or natural radioactive sources), chemicals, viral
infections or arise spontaneously due to unequal crossing over or recombination.
The daily mutation rate in human cells is 6 000 mutations/cell, but efficient
repair mechanisms ensure that most of these are repaired. However, some of
those DNA mutations become permanent in our cells during a lifetime, either
through mistakes during DNA copying or cell division or, because of damages
from the environment. Mutations occur in all types of cells with various
consequences: in somatic cells they can cause cancer and in germ cells they can
lead to new traits in the offspring. But, we can not forget that mutations
sometimes have beneficial outcome in evolutionary perspective by giving the
organism a better chance for adapting to environmental changes.
There is a range of DNA mutations:
• Gene mutations; large segments are affected or a single nucleotide within
a codon or a regulatory region is altered (point mutations). Example for
the latter:
ACGGTC Original DNA sequence
ACTGTC Substitution; replacement of a single nucleotide with
another nucleotide
AGCGTC Inversion; two neighbouring nucleotides change their places
ACGGCTC Insertion; a single nucleotide is randomly added in a
sequence
ACGTC Deletion; a single nucleotide is removed from the sequence
AACGGTC Duplication; addition of the same kind of nucleotide in the
sequence.
Mutations may have severe effects on the protein which is coded by the
sequence. Insertions, deletions and duplications cause a frame shift in the open
reading frame (ORF), which may result in altered protein function or
dysfunctional protein. Substitution and inversion may change an amino acid in
the sequence of the protein or cause a premature termination of translation by
making a “stop-codon”.
20• Chromosomal mutations; two classes exist:
Structural mutations can involve deletions, insertions, or inversions of large
sections of DNA. In some cases, deleted sections may attach to other
chromosomes, disrupting both the chromosome that loses the DNA and the one
that gains it. Such mutations are also called chromosome rearrangements.
Numerical changes, loss or gain of an entire chromosome. If this kind of
mutation takes place in a germ cell, it results in changes of total number of
chromosomes in the offspring. Examples:
Trisomy gain of one chromosome (Down’s syndrome, gain of chr 21)
Monosomy loss of one chromosome (Turner’s syndrome, loss of chr X)
POLYMERASE CHAIN REACTION, PCR
One of the major breakthroughs in the field of genetics was the Polymerase
Chain Reaction, PCR. It was invented and first described by Kary Mullis in
1985, published in 19876 and rewarded by Nobel Prize in 1993.
“I was working for Cetus, making oligonucleotides. They were heady
times. Biotechnology was in flower and one spring night while the
California buckeyes were also in flower I came across the polymerase
chain reaction. I was driving with Jennifer Barnett to a cabin I had been
building in northern California. She and I had worked and lived together
for two years. She was an inspiration to me during that time as only a
woman with brains, in the bloom of her womanhood, can be. That morning
she had no idea what had just happened. I had an inkling. It was the first
day of the rest of my life.”
- from Karry Mullis’s autobiography at the Nobel e-
Museum
In a few words, PCR can be described as DNA replication in a test tube. It
targets and amplifies specific sequences from a mixture of DNA. The reaction
requires genomic DNA, sequence-specific forward and reverse primers, DNA
polymerase, free nucleotides and buffer containing magnesium. The basics of
the reaction are explained in the figure 10.
21Primer anealing Elongation
Parental DNA
Denaturing
Rev
Taq
For
95ºC
~55ºC 72ºC
Figure 10: Basics of PCR reaction. One completed cycle of Polymerase Chain Reaction. For
– forward primer; Rev – reverse primer; Taq – polymerase.
The first step is denaturation of the DNA, when the two strands of the DNA
separate from each other. The process demands a temperature of 95ºC. Each
strand serves as a template for a new product. After denaturing, binding of
primers (annealing) is required. Every primer pair has its specific annealing
temperature, often between 50-60ºC. When primers have bound to the template,
the synthesis of a new strand by the DNA polymerase starts, a process called
elongation. The optimal temperature for this step of the PCR reaction is 72ºC. A
heat-stable polymerase is of vital importance in order to carry out the reaction
and to work properly. It is isolated from a thermophilic (heat tolerating) bacteria
Thermus Aquaticus. This organism was first discovered in a warm springs of
Great Fountaine region in Yellowstone National Park. The isolated enzyme got
its name from its origin – Taq-polymerase.
From every single molecule of DNA in the reaction mixture two new are made,
but only the specific sequences restricted by the primers (up to a few hundreds
of nucleotides long). The amplification of desired sequence occurs in
exponential fashion - for every thermal cycle (denaturing-annealing-elongation)
the amount of new sequence doubles.
Parental DNA
1st cycle
2nd cycle
3rd cycle
Figure 11: Exponential amplification of the PCR product. For each cycle the amount of
specific sequence is doubled.
22FINDING GENES
Looking for a needle in a haystack
Disease susceptibility factors (genes or genetic variants) are possible to locate in
the genome by measuring the associations between genetic markers and the
disease in a certain population. In multifactorial (or complex) traits, which the
most traits actually are, finding susceptibility factors might be a challenge
because of possible interactions between the causal genes (epistasis),
interactions between genes and environmental factors, genetic heterogeneity or
sometimes limited statistical power7; 8. One difficulty geneticists often meet is
that a great deal of identified genetic risk factors is likely to account for very
small fractions of the variation in a given phenotype.
In 2001, Glazier et al proposed a widely accepted working criteria for
establishment of gene discoveries in complex traits9 (Figure 12).
Functional
Linkage
and
Fine- Sequence tests of THE
mapping analysis candidate
association
variants
GENE
Figure 12. Working criteria in gene discoveries according to Glazier et al.
GENETIC LINKAGE AND ASSOCIATION
Genetic linkage analysis is performed in families. Affected members of a family
share the same DNA segment predisposing for a certain trait or disease at a
given susceptibility locus. Association analysis, on the other hand, is performed
in populations: affected individuals in a population share the same DNA
segment predisposing for a disease. When studying genetic linkage we are
looking for similarities between parental and inherited alleles within affected
family members. In association studies we are searching for differences between
alleles of affected and healthy individuals in a population.
A suitable family sample for linkage studies in complex diseases are sib-pairs.
Since there are genotypic similarities between relatives, like shared alleles
coming from the same ancestor, they are used for linkage mapping. In every
23single point of a chromosome a child has two alleles – one from the mother and
one from the father. Siblings may have inherited exactly the same allele on some
locations in the genome. If this is the case, then the siblings are Identical By
Descent (IBD) for that allele. If they share both alleles they are 2 IBD, if they
share only one allele they are 1 IBD. No common alleles – they are 0 IBD
(Figure 13).
1,2 3,4
1,3 1,3 2,3 2,4
2 IBD 1 IBD 1 IBD
0 IBD
Allele 1 is
linked with
the disease
Figure 13. The IBD status of siblings. Dark symbols indicate affected family members; light
symbols represent healthy individuals; numbers within symbols stand for genotypes.
The IBD status of siblings is a focus of non-parametric linkage studies (NPL).
Simplified, it is measuring a probability of two relatives (often siblings) shearing
the same ancestral allele. This method is appropriate for traits regulated by
multiple genes with small effects; no disease model has to be assumed. Once the
family sample is collected, the first step is to perform a genome wide scan. It is
done by genotyping markers evenly spaced across the chromosomes (Figure 14).
The result of the scan is a linkage map showing chromosome segments linked to
the disorder.
When analyzing sib-pairs, it is widely accepted that a NPL ≥ 3.2 refers to
suggestive linkage (p = 0.00074); it is a score that occurs by chance alone once
per genome scan. NPL ≥ 4.1 reflects significant linkage and it appears by chance
alone once in every 20 scans (p = 0.000022).
Tightly linked markers located close to each other are in the state of linkage
disequilibrium (LD). They are strongly correlated and inherited together in LD-
blocks. Because of this strong correlation between them it is possible to
genotype some of them and get the information about the others. Markers
defining an LD-block are called tags. Measure of LD between two markers is
expressed as r2, which varies between 0 and 1; r2 = 1 means that the markers are
perfectly correlated10 and only two haplotypes are present. Another LD measure
24related to r2 is D’. The absolute value of D’ = 1 means complete LD between
markers.
It is important to establish statistical significance of above mentioned
correlation, in order to prove that it is unlikely to have occurred by chance.
Statistical significance is often measured by p-value. Guidelines proposed by
Lander and Kruglyak in 1995 for identifying results in linkage studies that are
statistically significant11 gained universal acceptance and are still commonly
used.
While genome-wide linkage analysis is appropriate for detecting regions in the
genome likely to be 10-30cM long, harboring gene(s) predisposing for the trait,
it is less useful in detecting the exact variants involved. For this association
analysis can be used. Compared to linkage, association analysis yields fine-scale
resolution of genetic variants. Samples tested for association can be population
based (cases/affected vs controls/healthy) or family-based (trios, parents and
affected child, where healthy parents serves as controls). Testing cases vs
controls is sometimes misleading because of difficulties with population
stratification, which is overcome in trios. Family-based association method is
Transmission Disequilibrium Test (TDT), which is testing for overtransmission
of a particular allele across affected individuals12; 13. This method has
contributed in finding genes predisposing for several complex diseases14-16.
5
Significant linkage
4
Suggestive linkage
3
2
NPL
1
0
0 10 20 30 40 50 60 70 80 90 100 110 120 130 140 150 160 170 180 190 200
-1
-2
cM
Region showing
significant
linkage
Figure 14. Linkage map. The result of a genome scan. Arrows represent genotyped markers.
Light grey dotted lines indicate levels of significance; dark grey dotted lines delimit the
region of interest.
25GENOME-WIDE ASSOCIATION STUDIES (GWAS)
“The goal of the International HapMap Project is to determine the
common patterns of DNA sequence variation in the human genome and to
make this information freely available in the public domain. An
international consortium is developing a map of these patterns across the
genome by determining the genotypes of one million or more sequence
variants, their frequencies and the degree of association between them, in
DNA samples from populations with ancestry from parts of Africa, Asia
and Europe.”
Nature, 18 december 2003
The International Haplotype Mapping (HapMap) Project has been a success in
the last few years17. It is an international consortium consisting of 19 research
centres. 270 individuals from populations with African, Asian and European
ancestry have been genotyped for known variants across the genome with a
minor allele frequency (MAF) > 0.05. Together with completion of the Human
Genome Project in 2003 and constantly developing high throughput genotyping
technology, it gives a possibility of scanning the whole genome for association
with realistic sample sizes at affordable cost.
The method is based on examination of common variations in the genome.
Because variations are inherited in blocks (the LD phenomenon) not all of them
need to be genotyped, but still approximately 500,000 to 1 million SNPs are
tested in each assay, which means that association signals must show a high
level of statistical significance to survive the correction for multiple testing.
According to the Catalog of Published Genome-Wide Association Studies
(www.genome.gov), following the NHGRI/NIH criteria, 245 GWAS have been
published and 1114 associated SNPs reported with p-values < 0.00001 as of 21
January 2009. One of the studies that attracted much attention is The Wellcome
Trust Case-Control Consortium’s (WTCCC’s) GWAS for seven common
complex diseases (coronary hart disease, type 1 diabetes, type 2 diabetes,
rheumatoid arthritis, Crohn’s disease, bipolar disorder and hypertension) which
was successful in uncovering many new disease genes underlying these
diseases18.
26CELIAC DISEASE
The world embracing illness
GLUTEN – NUTRITIOUS OR TOXIC?
Celiac Disease (CD) or Gluten Sensitive Enteropathy (GSE) is a life-long
disorder characterized by inflammation in the small intestine of genetically
predisposed individuals caused by inappropriate immune response to gluten.
Gluten is formed when water is mixed with flour in bread baking process and it
gives elasticity and viscosity to dough. It is mainly composed of endosperm
proteins gliadin and glutenin (~80%), starch, lipids and fibres. Gliadin and
glutenin are proteins enriched in wheat, related proteins in rye are called secalins
and in barley hordeins19. Gliadin belongs to the group of prolamines,
hydrophobic proteins with high content of glutamine and proline, which are
soluble only in strong alcohol solutions. Glutenin is a member of glutelin family,
soluble in diluted bases or acids. Both prolamines and glutelines are storage
proteins, poor in nutritionally important amino acids.
The first findings in studies of gluten toxicity to celiac patients indicated that it
was the gliadin fraction of gluten that was immunostimulatory factor in CD20.
Most of the research in this field was focused on gliadin21-23 and the role of
glutenin was ignored for a long time. But, the increasing understanding of their
chemical structure and new analyzing methods revealed many similarities
between them. Since 1999, several independent studies have shown that even
glutenin is capable of raising the immune reaction in celiac patients24-26.
The toxicity of gluten is manifested by the autoimmune action of T-lymphocytes
on mucosal cells in the small intestine, disrupting its vital function of absorbing
nutrients from the food (Figure 15).
Gluten peptides, digested by the endopeptidases in the intestinal lumen, are
being transported into the lamina propria, where deamidation of the peptides by
tissue transglutaminase (tTG) takes place. These modified peptides are presented
to the immune system by antigen presenting cells, carrying HLA molecules on
their surface. Peptides are recognized by naïve CD4+ T-lymfocytes in
association with HLA-DQ2 or DQ8, which activates them and initiates
production of IFNγ and other inflammatory cytokines (Figure 16). The luminal
surface of inflamed intestinal cells, which under normal conditions is
enormously enlarged because of a presence of finger-like structures (villi), is
now damaged and reduced.
27Gluten peptide
T T T
T T T
D T T T T T
Healthy Inflamed Apoptotic
Time of exposure to gluten
Figure 15. The autoimmune action on the intestinal cells in the presence of gluten. D
indicates dendritic cell, acting as antigen presenting cell (APC); white T-cell represents naïve
CD4+ T-cell; black T-cells are activated T-cells mediating their cytotoxic action via cytokines
(IFNγ, TNFα, IL-15).
Cells are shrinking and contacts between them are destroyed. Consequently, the
distance between cells increases and the passage for gluten peptides from lumen
to lamina propria gets much easier. More gluten peptides support further T-cell
activation, maintaining the inflammatory reaction in the gut. Long-term
exposure to gluten leads to impaired intestinal function and cell death.
HLA-DQ2 or
DQ8
TCR
APC CD4+ T
T active
naïve
Gluten
peptide
IFNγ IL-15
TNFα
Figure 16. Recognition of the gluten peptide and activation of the immune response. APC
– antigen presenting cell carrying HLA-DQ2 or DQ8 molecule on its surface. TCR – T-cell
receptor. IFNγ, TNFα, IL-15 – inflammatory cytokines secreted by the active T-cell.
28CLINICAL MANIFESTATIONS OF CD
Symptomatically, CD is a very heterogeneous disorder. Patients show a wide
variety of disease phenotypes. Symptoms may be “classical” with
gastrointestinal manifestations like abdominal pain, vomiting and diarrhoea or
constipation. Such symptoms are frequent in young patients and children27. The
disease in children leads to growth stagnation due to malabsorption and in many
cases delay of puberty or absence of it.
“Atypical” manifestation of CD with no symptoms from the gut is common in
adult patients. Instead, they have symptoms of systemic character28 including
weight loss, tiredness and fatigue. In some cases patients can be generally
asymptomatic, but still having an ongoing inflammation in the intestine. Those
patients have so called silent CD29.
One group of patients may have positive serology due to inflammation, but no
visible lesions or damage in the intestinal mucosa. The damage may come up
later in life. This phenotype is known as potential or latent CD30.
In all cases, untreated CD involves risk for major complications: Dermatitis
herpetiformis (skin disease associated with CD)31, nutritional deficiencies32,
osteoporosis33, anaemia34, fertility problems35, neurological disturbances36; 37 and
malignancies38; 39. An Italian retrospective study from 2001 reported two fold
increased mortality in undiagnosed celiac patients of all ages40, mostly because
of developed lymphomas. The only known treatment for CD is lifelong
adherence to gluten-free diet (GFD).
EPIDEMIOLOGY OF CD: the famous “Celiac Iceberg”
For a long time CD was considered a rare disease, but rapidly developing
diagnostic methods in the past decade have changed this misconception.
Considering geographical distribution of risk factors for CD – gluten-containing
grains and HLA-haplotypes predisposing to disease, Europe is clearly a high-
risk area41, but even in regions where CD was considered historically rare (South
America, North Africa and Asia) new studies are showing that the disorder is
evenly spread and the prevalence is estimated to ~1% in the US and other
developed countries42; 43. Lower numbers in some countries are probably due to
inaccuracy in reporting routines.
Looking at the celiac iceberg (Figure 17) one huge problem appears
immediately: large portions of asymptomatic, silent and latent celiac patients
with no typical symptoms remain undiagnosed. Increasing awareness of diseases
associated with CD is making the disease more assessable, but it is still 5-10
29undiagnosed affected individuals on every diagnosed patient, and in some
countries with rare diagnostic facilities even higher, up to 50 undiagnosed on
every diagnosed celiac patient.
Genetic susceptibility (DQ2 or DQ8)
Symptomatic
patients
Positive serology
Damaged
intestine
Asymptomatic,
silent CD
Latent CD Normal
intestine
Figure 17. The Celiac Iceberg. A schematic presentation of CD epidemiology. The white
triangle on the top of the iceberg represents the “visible” portion of all patients affected by
CD, those that are diagnosed. Remaining grey areas are patients not aware of having CD.
In 2001, Green et al found that the average time from disease onset to diagnosis
in adult patients was 11 years44. This finding clearly implies the need of better
understanding of CD among clinicians to counteract the complications, promote
health and decrease medical costs to the society.
GENETICS OF CD
There is a strong genetic predisposition for CD. Italian twin study found 86%
concordance probandwise and 75% pairwise for monozygotic twins, the highest
reported for a multifactorial disease45. Concordance rate of 20% for dizygotic
HLA identical twins is interpreting the significance of other genes besides HLA
in CD. Several regions in the genome comprising susceptibility genes for CD
have been reported:
CELIAC1 on 6p21.3 containing HLA genes.
Human Leukocyte Antigen, HLA, is a molecule expressed on the surface of all
cells with the essential role of presenting antigens to the immune system. It
presents both self-antigens from the body, teaching the immune system not to
30react to them, and non-self-antigens coming from the outside of the body (as
pathogens or toxins), telling to the immune system that it should fight the
danger. The HLA molecule is coded by the HLA genes located on chromosome
6, characterized by an extremely high allelic diversity which is of vital
importance for the presenting mechanism. HLA variants predisposing for CD
are DQ2 and DQ8. The vast majority of CD patients (~95%) are carrying the
HLA-DQ2 genotype. Those negative for DQ2 (~5%) have the other variant,
DQ8. These variants are very common in the general population as well - about
20% are DQ2 positive. So, the conclusion is that DQ2 or DQ8 are necessary but
not sufficient for developing CD.
So far HLA is the only known disease predisposing genetic variant in CD. It has
been reported in a number of independent CD studies46; 47 and confirmed in
meta-analysis of four European genome scans48. The HLA region have been
implied as a susceptibility region in many other complex diseases: psoriasis49; 50,
type 1 diabetes (IDDM)51, asthma52, dyslexia53, multiple sclerosis (MS)54,
rheumatoid arthritis (RA)55, inflammatory bowel disease (IBD)56, Crohn’s
disease57 etc.
The HLA region is characterized by strong LD, which often make fine mapping
very difficult. Despite that, the haplotypes predisposing for CD has been
identified and described58. As mentioned before, the majority of all patients are
carrying the HLA-DQ2 molecule. It is a dimer encoded by DQ-A1*05 and DQ-
B1*02 alleles. The risk alleles may be localised either on the same chromosome
(cis) or on homologous chromosomes (trans). Being homozygous for the DQ2
haplotype increases susceptibility to CD59.
CELIAC2 on 5q31-33.
This region is known as a cytokine cluster, it harbours many immunological
genes which makes it interesting in CD as an autoimmune disease. This was the
only non-HLA region confirmed as a risk factor in a European genome wide
linkage meta-analysis48. Before that, several independent CD studies reported
linkage to 5q31-3346; 47; 60. The large number of genes mapping to the region
made the candidate gene approach less appealing and our group chose a fine-
mapping approach61 resulting in a significant linkage signal across 18cM on
5q31-33. In order to identify candidate variants or narrow the area of interest we
carried out a comprehensive screen with a reasonably high resolution62. The
study pinpointed seven associated haplotype regions, but none of them could
account for the linkage signal in the region.
Apart from CD, 5q31-33 is a susceptibility region in other complex diseases:
asthma63; 64, Crohn’s disease65, early onset IBD66, autoimmune thyroid disease
(AITD)67, bipolar disease68, RA69, etc.
31CELIAC3 on 2q33. This locus is harbouring the cytotoxic T-lymphocyte associated (CTLA4) gene. Upon induction, the protein coded by this gene is transported to the surface of an activated T-cell after the recognition of the antigen (in this case gluten) where it is involved in modification of co-stimulatory signals that are vital in the immune system. CD28 molecules expressed on the surface of T-cells bind to B7 molecules expressed by APC, giving a proliferative signal to the T-cell. This co- stimulatory signal is essential in activation and differentiation of T-lymphocytes in immune responses. But, for regulative purposes, negative signals are needed that counteract the T-cell activation, and that is the role of CTLA470. Since CTLA4 has a stronger affinity for B7 than CD28, it competes out the CD28 molecules, which results in an inhibitory signal to the T-lymphocyte. Djilali-Saiah et al investigated in 1998 a polymorphism at position 49 in exon 1 of the CTLA4 gene in celiac patients71. It was a substitution of A to G (A49G) which corresponded to an amino acid threonine change to alanine in the expressed protein. The A allele was significantly overrepresented in celiac patients compared to controls. Two years later our group confirmed association of this polymorphism in Scandinavian families affected by CD72. Associations to polymorphisms in the CTLA4 locus are reported for several complex diseases: type 1 diabetes73, Graves’ disease74, Hashimoto’s thyroiditis and Addison’s disease75, systemic lupus erythematosus (SLE)76, etc. CELIAC4 on 19p13.1 This locus is associated with a polymorphism in the myosin IX-B (MYO9B) gene in celiac patients. Members of the myosin protein family are motor proteins involved in cell motility. In enterocytes (intestinal cells) the role of MYO9B is in remodelling of the cytoskeleton and the tight junctions, which are the connection points between the cells. They are not only the cell-to-cell contacts but the complex communication centres mediating a variety of signals and facilitating the cross-talk between cells. The single layer of enterocytes functions as a barrier between the environmental factors in the lumen of the intestine (food and microorganisms) and the insides of the body. One hypothesis is that the mutations in the MYO9B disrupts this barrier function and enhance the paracellular permeability of the intestine77. The MYO9B locus has shown association with CD in Dutch sib-pairs78 and in a separate case/control study79. However, several European studies could not replicate this finding80-83. According to published data, the MYO9B genetic locus is also a susceptibility factor in other autoimmune diseases84-87. 32
CELIAC5 on 15q11-13.
Linkage to this locus has been reported for a population isolate from north-
eastern Finland88 with convincing LOD score of 3.74, but no replication studies
have been published. Other complex diseases associated to 15q11-13 are Prader-
Willi and Angelmans syndromes89 and autism90.

CELIAC6 on 4q27.
In the first GWAS performed by van Heel and colleagues91, a locus on 4q27
comprising KIAA1109, TENR(ADAD1), IL2 and IL21 genes showed the
strongest association outside of the HLA-region, approximately 25kb from the
5’-end of the IL21 gene. The highest scored SNP was rs6822844 (overall p =
1.3x10⁻¹⁴). Because of very powerful LD the causal variant/s could not be
determined in this study, however, the region was confirmed in three
independent European samples. Also in our cohort this SNP showed a
significant association to CD (p = 2x10⁻³)92.
Since the IL2 and IL21 genes are of great immunological importance, one
possible hypothesis is that this locus is a general susceptibility locus in
autoimmune diseases. A Dutch group tested this hypothesis in T1D and RA, and
came to the conclusion that it was the case for both disorders93.

CELIAC7 on 1q31.
The third strongest association from the GWAS and its follow up study92 was to
rs2816316 (p = 2.6x10⁻¹¹). This SNP is located within the strong LD block
containing the RGS1 gene, which is involved in B-cell activation and
proliferation through the regulation of the chemokine receptor signalling. RGS1
is found to be expressed in small intestinal biopsies94, which makes it even more
interesting in CD.

CELIAC8 on 2q11-12.
This locus on chromosome 2, encompasses two genes coding for the receptor of
the IL18 protein, IL18RAP and IL18R. This cytokine is highly relevant in CD
since it induces T-cells to synthesize IFNγ which is involved in the intestinal
inflammation. The locus has already been reported as susceptibility region in
Crohn’s disease in a study from Welcome Trust Case Control Consortium
(WTCCC)95 and in both ulcerative colitis and Crohn’s disease by Zhernakova et
al96.

                                                                              33
CELIAC9 on 3p21. A cluster of chemokine receptor genes influencing susceptibility to CD maps to this locus. Chemokines are proteins involved in the immune response; they act as chemoattractants and activators of lymphocytes (immune cells). The cluster includes CCR1, CCR2, CCRL2, CCR3, CCR5 and XCR1. We are currently testing SNPs in this locus. CELIAC10 on 3q25-26. A locus near the IL12A (or p35) gene which functions as a link between the innate and acquired immune responses. This region is linked to Asperger syndrome and autism as well97. CELIAC11 on 3q28. A locus within an LD block near the LPP gene (lipoma-preferred partner), involved in translocation of benign lipomas94. CELIAC12 on 6q25. A locus encompassing the TAGAP gene coding for a protein expressed by activated T-cells98. An SNP within TAGAP is associated with T1D99. CELIAC13 on 12q24. Association to two SNPs proximal to the SH2B3 gene (p = 8x10⁻⁸). One of the SNPs, rs3184504, has previously shown very strong association to T1D95. SH2B3 is highly expressed in lymphocytes (monocytes, dendritic cells, B- and T-cells). It is also expressed in small intestinal biopsies of celiac patients94, but this may be due to lymphocyte recruitment under the ongoing inflammatory response. The locus on 12q24 is also involved in susceptibility to schizophrenia100 and SLE101. Regions CELIAC7-13 are all confirmed in the GWAS follow-up study by Hunt et al94. 34
THIS STUDY
BACKGROUND
Our genome-wide scan of Swedish/Norwegian multiplex families was
performed and published in 200147. From the beginning, 70 families were tested
for linkage in order to identify susceptibility genes for CD. First preliminary
results were followed up by additional genotyping of 34 multiplex families in
regions with potential linkage to CD.
Beside the HLA-region on chromosome 6, eight other chromosomal regions
showed nominal significance (p < 0,05), among them 5q31-33. This region was
previously suggested as a susceptibility region in other complex diseases:
asthma in Australian children in 1998102, rheumatoid arthritis (RA) in a French
study in 1999103, inflammatory bowel disease (IBD) in Canadian families in
200066 and T1D in Australian study in 200163. Also, two other European groups
reported 5q31-33 as a susceptibility region in celiac disease: one Finnish104 and
one Italian60.
In the year 2000 our group got involved in The European Genetics Cluster on
Celiac Disease. Beside Sweden, members of the cluster were Norway, Italy,
France, United Kingdom and Finland. The main goal of the international
collaboration was to bring data from four independent European genome scans
together and evaluate results. Meta- and mega analysis was performed and
published in 2003 in an article that attracted much attention48. In this pooled
analysis, 5q31-33 was the only genetic region, except for HLA, that without a
doubt manifested linkage to CD.
It was now confirmed, both in independent studies and in a joint analysis, that
“there was something lurking on 5q” and it was the time to find out what that
“something” was. The region of interest was approximately 18 cM long,
comprising a cluster of immunologically important genes. Many of those genes
seemed to be obvious candidates, but the problem was – they were too many.
The only possible and manageable approach was to narrow the area of interest
by fine mapping.
The period of intense genotyping was about to begin…
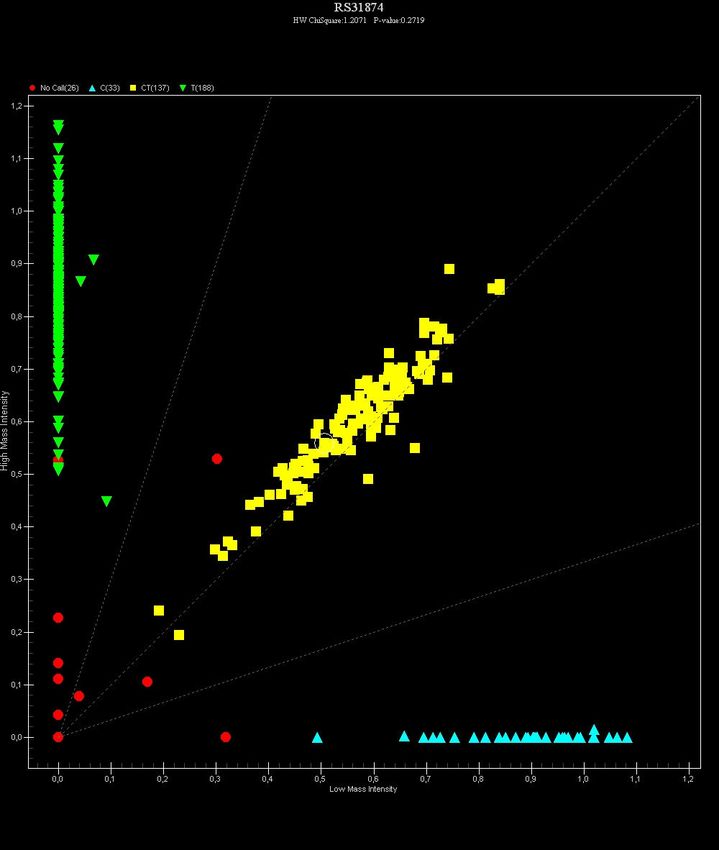
35AIM The main goal of this study was to explore the region of 18cM on 5q31-33, identify genetic risk factors and evaluate their contribution to the development of CD. MATERIAL & METHODS FAMILIES During the 1990’s great efforts was done at the Queen Silvia’s Children’s Hospital in Gothenburg in collecting blood samples and clinical data from Swedish and Southern Norwegian sib-pairs affected by CD and their parents105. The aim was to perform a genome-wide scan in order to identify genes responsible for development of CD in the Scandinavian population. Only families who met all diagnostic criteria according to the ESPGHAN106 was included in the study. A sample of 107 families was collected, referred to as multiplex families in further text. Affected individuals were diagnosed by serological screening of blood samples and pathological evaluation of small intestinal biopsies before and after gluten-free diet and after gluten challenge. Additional sample of 225 trios affected by celiac disease was collected at the same time for confirmation studies, preferably from South-West Sweden and Southern Norway. Diagnostic criteria were the same as for sib-pair families. This sample is referred to as simplex families in further text. GENOTYPING: Concept of genetic markers Microsatellites Microsatellites were genotyped by fragment length analysis. Amplified, fluorescently labeled PCR-product was loaded on a gel. Different lengths of alleles (meaning – different number of repeats in the amplified sequence) were then separated by electrophoresis. The fluorescent dye enabled visualisation of the fragments by laser in an ABI PRISM® 377XL DNA sequencer (Applied Biosystems®). Alleles were analyzed by Genotyper® v 2.0 software (Applied Biosystems®). 36
You can also read