GLACIER INVESTMENT SUMMIT - Jurie Strydom, Sanlam Personal Finance CEO 06 February 2020 - Glacier by Sanlam

Page created by Rhonda Simmons
 
CONTINUE READING
GLACIER INVESTMENT SUMMIT - Jurie Strydom, Sanlam Personal Finance CEO 06 February 2020 - Glacier by Sanlam
GLACIER INVESTMENT SUMMIT

           Jurie Strydom, Sanlam Personal Finance CEO

                                                 06 February 2020

       Insurance | Financial Planning | Retirement | Investments | Wealth
GLACIER INVESTMENT SUMMIT - Jurie Strydom, Sanlam Personal Finance CEO 06 February 2020 - Glacier by Sanlam
1. Overview
2. Strategic focus for the Sanlam
   Group: 2020 and beyond
3. Operating environment
4. Outlook
GLACIER INVESTMENT SUMMIT - Jurie Strydom, Sanlam Personal Finance CEO 06 February 2020 - Glacier by Sanlam
1.   Overview
GLACIER INVESTMENT SUMMIT - Jurie Strydom, Sanlam Personal Finance CEO 06 February 2020 - Glacier by Sanlam
A PROVEN STRATEGY THAT DELIVERS
                                                                                   Our strategic intent
             Our purpose
 Our purpose is to build a world of                   Our strategic intent is to create sustainable value for all stakeholders.
Wealthsmiths™, that supports people                                                  Our vision in
                                                  Our vision in                                                         Our vision in
  in living their best possible lives             South Africa                Africa, India and Malaysia             developed markets
  through financial resilience and           To lead in client-centric        To be a leading Pan-African           To play a niche role in
     prosperity at the individual,               wealth creation,             financial services group with         wealth- and investment
 organisational and societal levels         management and protection           a meaningful presence in            management in specific
                                                                                    India & Malaysia                 developed markets
             Our values
                                             Profitable top-line growth through a                       Extracting value through innovation
To:
                                                        culture of client-centricity                    and improved efficiencies
  Act with integrity;
                                                                                   Our strategic pillars
  Grow shareholder value through
                                              Enhancing resilience and earnings                         Responsible capital allocation and
  innovation and superior
                                                 growth through diversification                         management
  performance
  Lead with courage                                                                    Transformation
  Serve with pride; and                                Continuous transformation is central to Sanlam’s ability to adapt to a
  Care because we respect one                                changing world and underpins all of the strategic pillars.
  another

                                        Executed through five clusters       SPF       SEM   SIG   SNT     SC
GLACIER INVESTMENT SUMMIT - Jurie Strydom, Sanlam Personal Finance CEO 06 February 2020 - Glacier by Sanlam
OPERATIONAL STRUCTURE
                        Our decentralised structure provides us with a competitive advantage

                                                      Sanlam Group

                                    Group office

           100%                   100%                       100%                   100%                  62%
                         Sanlam Emerging
 Sanlam Personal                                   Sanlam Investment           Sanlam
                             Markets                                                                Santam
     Finance                                            Group                 Corporate
                             (SPA & SSI)
    SA Retail: life     Emerging markets ex-         SA & developed        SA & EM corporate:   General insurance,
insurance, investment     SA: life insurance,      markets: investment     employee benefits,   reinsurance & co-
   & other financial      general insurance,       management, wealth            health          investor in SEM
       services         investments, credit &      management, credit &                         general insurance
                                banking                structuring                                  businesses
GLACIER INVESTMENT SUMMIT - Jurie Strydom, Sanlam Personal Finance CEO 06 February 2020 - Glacier by Sanlam
SUSTAINABLE SHAREHOLDER VALUE CREATION

          Target: SA 9yr risk free + 4%                                                                      Target: 2% - 4% real growth

                                                   Dual focus on future growth and dividend flows
       Consistent outperformance of RoGEV target                                                                      Stable dividend growth
1600                                                                                                350
         10yr CAGR 15.6%                                                                                  10yr CAGR 12.3%
1400                                                                                                300
1200                                                                                                250
1000
                                                                                                    200
 800
                                                                                                    150
 600
                                                                                                    100
 400
 200                                                                                                 50

   0                                                                                                  0
       1998
       1999
       2000
       2001
       2002
       2003
       2004
       2005
       2006
       2007
       2008
       2009
       2010
       2011
       2012
       2013
       2014
       2015
       2016
       2017
       2018

                                                                                                          1999
                                                                                                          2000
                                                                                                          2001
                                                                                                          2002
                                                                                                          2003
                                                                                                          2004
                                                                                                          2005
                                                                                                          2006
                                                                                                          2007
                                                                                                          2008
                                                                                                          2009
                                                                                                          2010
                                                                                                          2011
                                                                                                          2012
                                                                                                          2013
                                                                                                          2014
                                                                                                          2015
                                                                                                          2016
                                                                                                          2017
                                                                                                          2018
       Target     Actual                                                                                  Dividend   Cash earnings
GLACIER INVESTMENT SUMMIT - Jurie Strydom, Sanlam Personal Finance CEO 06 February 2020 - Glacier by Sanlam
AN UNMATCHED PAN-AFRICAN FOOTPRINT
                    Diversification within Sanlam strengthens financial and operational capability

                                                                  Luxembourg

                                        United Kingdom
                                                 Ireland
                                                 France
                               USA          Switzerland
                                                Tunisia                              Saudi Arabia
                                               Algeria              Lebanon
                                            Morocco
                                             Mali
                                           Niger                                         Egypt
                                          Senegal
                                     Burkina Faso                                          Ethiopia         India
                                          Guinea
                                     Cote D’Ivoire                                                                      Philippines
                                             Ghana                                         Kenya
                                                    Togo                                   Uganda            Malaysia
                                                         Benin                            Rwanda
                                                           Nigeria                        Burundi
                                                        Cameroon                          Tanzania
                                                           Gabon
                                           Republic of the Congo                            Malawi
                                                           Angola                          Zambia
Future Expansion                                         Zimbabwe                               Mauritius
                                                         Botswana                         Madagascar
Emerging Markets - Indirect presence                        Namibia
                                                                                  Mozambique
Emerging Markets - Direct presence                         South Africa         Swaziland
                                                                                                                                  Australia
                                                                      Lesotho
Developed Markets
GLACIER INVESTMENT SUMMIT - Jurie Strydom, Sanlam Personal Finance CEO 06 February 2020 - Glacier by Sanlam
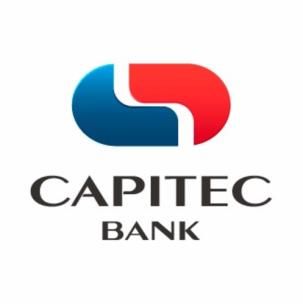
SPF (SA RETAIL) VNB MARKET SHARE
                40.0%
Large 5 peer
group           35.0%
                30.0%
   SANLAM
                25.0%
   OLD MUTUAL

   LIBERTY      20.0%
   MMI          15.0%
   DISCOVERY
                10.0%
                 5.0%
                 0.0%
                        2013   2014   2015   2016   2017   2018   2019H1
GLACIER INVESTMENT SUMMIT - Jurie Strydom, Sanlam Personal Finance CEO 06 February 2020 - Glacier by Sanlam
SPF IN-FORCE POLICY NUMBERS

                        2021               2 390 380                           1 712 237              651 369      Total: 4 753 986
2014 - 2021
                        2020             2 197 296                        1 753 353              631 968        Total: 4 582 617
   Entry Level Market

   Middle Market        2019            2 027 336                       1 795 804              615 241      Total: 4 438 381
   Glacier              2018           1 879 681                      1 841 966              601 347      Total: 4 322 994
                        2017          1 753 059                     1 889 064               592 662      Total: 4 234 785
                        2016         1 624 655                     1 952 973               585 745      Total: 4 163 373
                        2015        1 538 066                  2 025 129                   573 025      Total: 4 136 220
                        2014        1 451 537                 2 100 458                    543 384    Total: 4 095 379
                               0        1 000 000      2 000 000         3 000 000          4 000 000           5 000 000
PROFITABILITY DRIVERS
                                  Value of New Business per SPF Business

Glacier
                                                                                                            473
BrightRock
                                                                                                      526
                                                                                                604       120
Middle Market                                                                                          81 226
                                                                              301         323
                                                                    187 250         338          20   251
Sanlam Personal Loans                                                                           280
                                                                                          513               457
                                                               144 405 424 460                        408
Digital (MiWay Life & Indie)                                                        410      36 352
                                                         127 301                          9
                                                 85              263 249 288     287
Entry Level Market                            67      94 249
                                           54    280 208     211             296             696
                                   14 57 198 260         150                         521 618
                                                 103 98          382 371 365
                                       186
                               169 258 74 67  62 129 138 174 263             244 357
                                           74 88                                      -4
PERSISTENCY IN CHALLENGING CONDITIONS
                                             SA middle income market

Lapses,                5   4.8
surrenders & fully   4.5     4.2                                4.2
paid-ups as % of                   3.94.0 3.93.8              3.8 3.9
                       4                           3.63.7 3.6
in-force per half    3.5
                                                         3.4         3.4
year                                                                       3.02.9 2.9 2.9                       3.0
                       3                                                            2.8 2.7 2.82.9 2.92.8 2.92.8 2.9 2.92.7 2.72.7
                     2.5
   H1
                       2
   H2
                     1.5
                       1
                     0.5
                       0
                           2003 2004 2005 2006 2007 2008 2009 2010 2011 2012 2013 2014 2015 2016 2017 2018
PERSISTENCY IN CHALLENGING CONDITIONS
                                      SA lower income market

Sanlam Sky

                       17.5
                      16.8
(Excluding Capitec)

                               14.5
                              14.1
– NTU’s, lapses and

                                      12.7
                                      12.6

                                                                                        11.9
surrenders as % of

                                             11.4

                                                                      11.3

                                                                               11.3
                                             11.1
                                                     11.1

                                                              11.0

                                                                     10.7

                                                                                      10.7

                                                                                                10.7

                                                                                                              10.5
                                                    10.4

                                                                                                       10.3
                                                                             10.0

                                                                                               10.0

                                                                                                       10.0
in-force

                                                            9.9
   H1

   H2

                                                                                                                 -
                      2008    2009    2010   2011   2012    2013     2014    2015     2016     2017    2018   2019
2   Sanlam Group
    strategic focus
    2020 & beyond
KEY PRIORITIES FOR THE GROUP
                                       SA and beyond
Continue to accelerate
market share gains in                                                  Execute on the partnership
                                      Execute on our advantage               opportunities
high opportunity areas                         in SA
                                                                          Capitec, MTN, ARC

Entry level     3rd party
                                       Delivering on the Saham          Harnessing technology
  market          asset
                                              acquisition                   through digital
 (funeral)     management
                                                                           transformation

Employee                              Deliver on the Pan-African
                  Health                                               Competing through people
 benefits                              opportunity via SEM &
                                               Santam

    Transformation and societal impact – being the very best of what Africa has to offer
CAPITEC COLLABORATION
                                                                                                Sales performance to date

                    Policy sales since launch in May 2018 (in '000)
140
                                                                                                                                                                                          • Sales exceeded
120                                                                                                                                                            116 113                      2019 target by
                                                                                                                                    102                                                     40%
                                                                                                                                             97 96
100
                                                                                                                  88 88
                                                                                                         79                                                                      77
                                                                                                                                                                                          • 1 075 000 policies
 80                                                74                         74                75
                                                                                       69                                                                                                   sold in 2019
                                                            60
 60                              56 59
                        47                                           45                                                                                                                   • Active book
 40            31
                                                                                                                                                                                            960 000 policies

 20   12                                                                                                                                                                                  • Collections, NTU
                                                                                                                                                                                            and claims on or
 -                                                                                                                                                                                          better than target
                                                                              Jan-19
                                                            Nov-18
               Jun-18

                                                   Oct-18

                                                                                                                           Jun-19

                                                                                                                                                               Oct-19
                        Jul-18
                                 Aug-18

                                                                     Dec-18

                                                                                                Mar-19
                                                                                                         Apr-19

                                                                                                                                    Jul-19
                                                                                                                                             Aug-19

                                                                                                                                                                        Nov-19
                                                                                                                                                                                 Dec-19
      May-18

                                          Sep-18

                                                                                       Feb-19

                                                                                                                  May-19

                                                                                                                                                      Sep-19
INNOVATION & GROWTH

                      Matrix Risk Cover repositioned

                             Investment Hub
    Sanlam Indie
DIGITAL: PORTFOLIO OF INITIATIVES

SCAN, TEST AND LEARN

   NEW BUSINESS

                                                                     Robotics
TRANSFORMATION OF                                                    Find an intermediary
                                                                     Sanlam Now Risk
  CORE BUSINESS                                                      Cover
                       Sales & marketing   Operations   Technology   Savings Goal Manager
                                                                     Glacier Investment Hub
                                                                     Business intelligence
THE SANLAM FOUNDATION
3. OPERATING ENVIRONMENT
SOUTH AFRICA’S REALITY
                                       3 possible scenarios for 2030

                                           A nation torn by deepening             A nation with an expanding
  A nation torn between
 immobility and restless                  social divides, daily protests          economy, social cohesion
         energy                             and cynical self-interest               and a renewed spirit of
                                                                                       constitutionalism

GDP growth averages 1.5% with               GDP growth averages 2.2% to            GDP growth averages 4.5% to
periods of recession                        2030                                   2030 with growth becoming more
Unemployment never falls below              Slow but persistent depreciation in    solid and predictable from 2020
25%                                         the rand and increasing                onwards
The interest rate increases towards         government debt risk                   Unemployment in 2030 stands at
the end of the 2020s                        Unemployment is reduced to 22%         16%
Income inequalities skyrocket               A growing separation of South          The 1st six years of education
Destructive battles within major            Africans by class and income level     improves, and university education
political parties with oppositions          Under-investment in agriculture        becomes more affordable
forming coalitions between 2024-            sees declines in food production       Public sector becomes more
2029                                        and security                           capable and which increases trust
Key institutions are only partially         Market-led interventions in            in key institutions
liberated and are quickly recaptured        education, health and SOE’s            Faster urban and rural land
by the newly emerging elite                 produces mixed results                 redistribution
Individual freedoms are becoming                                                   Agricultural production and food
curtailed                                                                          security is boosted
OPERATING ENVIRONMENT
 Going forward, political will, political alignment and implementation capability will determine the SA economic
                                                      landscape

                              Pedestrian economic           Eskom bail-out undoes           SOE risks remain
Market risk and volatility
                               growth, with GDP            fiscal consolidation, with     (SAA, Denel, PRASA,
         higher
                               expected at 0,8%            a debt trap now possible               etc.)

                                                                                          Unemployment rates
     Risk of SARB
                                                           Current fiscal trajectory    increasing including high
nationalisation remains,       NHI risk to economy
                                                                not possible              levels of unemployed
  but mandate intact
                                                                                                  youth

 Revenue shortfall of                                     Moody’s downgrade now
                             Possible VAT hike on the
R52bn projected for the                                    more likely than ever
                                      cards
  current fiscal year                                             before
THE REALITY
• Moody’s last decision to downgrade the outlook from stable to negative
   • Reflects the "material risk" that the government will not stop deterioration of its
     finances
   • Concerned high unemployment and inequality precludes the necessary policy action
   • Notes that “the 2020 budget in particular will be a key indicator of whether or not the
     government is committed to [fiscal consolidation]”
   • Moody’s sending a strong signal that Government should stop talking about structural
     reform and should start implementing policy that will attract investment

• Continued inaction will likely ensure a downgrade ±March 2020
   • This will lead to outflows and an increase in the cost of borrowing
   • Very negative for investor confidence and growth outlook
CRITICAL ACTIONS NEEDED
                      What is needed at the SONA / February Budget Speech

• Implement a blueprint to revive the economy focusing on strategic
  sectors and interventions.
• Key aspects and clear milestones to be covered in the plan to
  include:
   •   Security of energy supply
   •   Fiscal consolidation by cutting government expenditure and energy supply
   •   Reform SOE’s
   •   Government to refrain from announcing any new big policy initiatives that could
       further erode investor confidence
4.   Outlook
LOOKING FORWARD
 We believe SA is on the right path, we will not fail, but it
 may take time to right the ship
 A slow recovery in SA will require Sanlam to up its game
 continuously
 We have conviction that Sanlam has the required
 strategy and execution capability to do this
 We need to benchmark ourselves against the best in the
 world
 As Sanlam we need to lead by looking through the noise
 and restoring confidence
questions
You can also read