How will Expanding Broadband Internet Access Benefit Knox County, TN? - Prepared by Lawrence M. Kessler Alex Norwood Richard Beem William F. Fox ...
←
→
Page content transcription
If your browser does not render page correctly, please read the page content below
How will Expanding
Broadband Internet Access
Benefit Knox County, TN?

           Prepared by

        Lawrence M. Kessler
          Alex Norwood
          Richard Beem
          William F. Fox

            June 2021
Executive Summary                                                                   KUB’s plan would certainly provide consumer
                                                                                    surplus for its customers. Consumer surplus
      As part of a modernization effort, KUB                                        measures the benefit that buyers receive for
plans to upgrade its electrical grid by installing an                               purchasing a good or service at a lower price
extensive fiber system, which will provide a more                                   than they are willing to pay. In recent studies,
reliable electricity service, better efficiency, and                                Brynjolfsson et al. (2019) found that the average
shorter downtimes in the event of power outages.                                    person benifited from having access to broadband
The fiber system would also enable KUB to offer                                     services, and Lobo (2020) found that ultra-fast
cheaper, ultra-fast internet to all households and                                  internet connections in Hamilton County raised
businesses in its electric grid service area. This                                  consumer surplus by $128 million per year.
report documents the various benefits associated                                    Furthermore, Lobo (2015) found that current
with expanding access to ultra-fast internet                                        internet service providers (ISPs), such as Xfinity
connections.                                                                        and AT&T, reduced their prices after ultra-fast
      Under KUB’s current proposal, residential                                     municipal broadband was brought to Hamilton
internet plans would offer internet upload and                                      County in 2010. In the most extreme case, Xfinity
download speeds of 1 gigabits-per-second (Gbps)                                     reduced the price of its 105 Mbps plan by 55%
at roughly $65 per month. Assuming that 35% of                                      between 2010 and 2014, which would increase our
KUB households adopt the new internet plan, we                                      cost-savings estimate if we were able to account
estimate that the cost savings of switching from                                    for it. Thus, increased competition should provide
their current provider would lead to a $18.5 to $85.7                               a strong positive benefit to consumers.
million increase1 in Tennessee incomes per year,                                         In addition to the direct household benefits
depending on the cost of their current internet                                     of KUB’s plan, access to high-speed internet
plan (these estimates also include multiplier effects,                              at the home provides a number of significant
as discussed in Section 3). KUB’s proposed                                          economic and social benefits to the region
download speeds are equivalent to the top-speed                                     as a whole. Previous research has found that
residential plan currently offered to some Knox                                     ultra-fast broadband can boost a region’s gross
County residents by Comcast/Xfinity (hereafter                                      domestic product (GDP) by 1.1%, and reduce an
Xfinity), but KUB’s proposed upload speeds are                                      unemployed person’s job search time by roughly
more than 25-times faster than anything currently                                   25% (Sosa, 2014; Kuhn and Mansour, 2014).
offered by Xfinity. Increased upload speeds                                         In general, greater connectivity leads to quicker
could provide a substantial benefit to workers                                      information dissemination and the ability to
and businesses who create online content. As an                                     process more information overall, which can aid
example, a local plumber might market his/her                                       unemployed workers in their job search, help
business by uploading a short 500 megabytes (MB)                                    firms find strongly-suited job candidates, and
video to YouTube, which demonstrates how to fix                                     for already employed workers, it can result in
a leaking toilet. Or a teacher might upload a short                                 increased wages. Increased broadband availability
video to complement a homework assignment.                                          can also lead to growth in the number of
According to allconnect.com, it would take between                                  small firms in a region, and has been shown to
1.5-2 minutes to upload the short video clip with a                                 reduce rural depopulation trends (Shideler and
30 Mbps upload connection, which is comparable to                                   Badasyan, 2012; Briglauer et al., 2019; Lehtonen,
the fastest residential upload speed currently offered                              2020). While Knox County is not rural, KUB’s
by Xfinity. For those needing to upload multiple                                    business plan proposes the expansion of ultra-
files, the time commitment could add up relatively                                  fast broadband through its entire electric grid,
quickly. By comparison, an internet plan with upload                                which includes sizable portions of Grainger,
speeds of 500 megabits-per-second (Mbps) (half the                                  Union, and Jefferson counties as well–three
speed of KUB’s proposed plan) could upload the                                      counties where population growth has been
video clip in just 8 seconds.                                                       slower than the state average.2
      Based on both the cost and time-savings,                                           High-speed internet access also has important
1
    These range of estimates are the cost savings of 200,000 (35% take up rate) customers switching from either Xfinity’s 100Mbps or 1,000Mbps to KUB’s plan.
2
    Population growth for 2010-2019.

1     |    BOYD CENTER FOR BUSINESS & ECONOMIC RESEARCH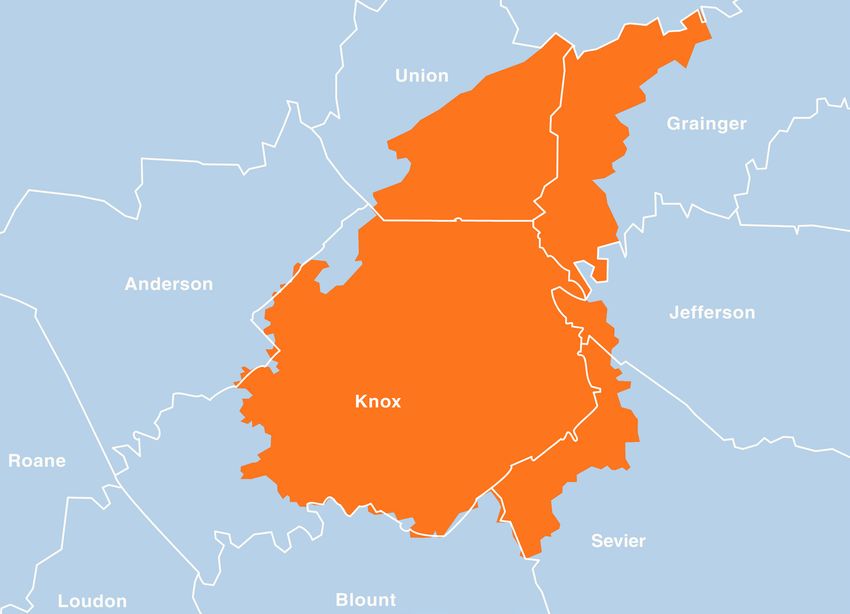
social benefits through increased educational               connections was made glaringly obvious during
attainment and better health outcomes. Both of              the COVID-19 pandemic. In the spring of 2020,
which also have implications for economic growth,           large portions of the state economy were shut
as good healthcare makes for a more productive              down to limit the spread of COVID-19. As a result,
workforce and improved education offers long-term           many workers and students shifted to remote work
benefits for productivity growth, higher incomes,           and virtual learning, while physicians and health
and lower unemployment rates. Research has shown            insurance companies made telehealth more widely
that students with high-speed internet access have          available and reimbursable. However, these online
higher grade point averages (GPAs), perform better          tools were only available to those with a reliable
on standardized tests, and apply to more colleges           high-speed internet connection. On the education
(Dettling et al., 2018; Bauer et al., 2020; Hampton et      front, Knox County Schools closed on March 13,
al., 2020). Research also indicates that internet speed     2020, due to the pandemic, and remained closed
matters. For example, Grimes and Townsend (2018)            for the remainder of the academic school year.
find that providing ultra-fast broadband connections        Virtual learning was not offered for the second
to schools leads to a 1 percentage point increase           half of the spring 2020 semester due to gaps in
in standardized test pass rates among elementary            internet access and device availability, preventing
school students. Similarly, Sanchis-Guarner et al.          many Knox County students from accessing formal
(2021) find that increasing home internet speeds by         education. For the following school year (academic
1 Mbps (1,000 Mbps is equal to 1 Gbps) increases            year 2020/21), families were able to choose between
test scores by 1.37 percentile ranks.                       in-person schooling or at-home virtual learning for
      With regards to healthcare, those with                their school-aged children. However, the latter was
broadband access are more likely to use the                 only a viable option for those with reliable internet
internet to gather health-related information,              access. Furthermore, as shown in Section 2, the
and broadband can deliver healthcare services               majority of Knox County residents without home
remotely through telehealth (Rains, 2008; Kim et            internet connections are those in lower-income
al., 2021). For these reasons, broadband access             households. Lower-wage workers were also the
is viewed as a “super-determinant” of health                group that suffered the brunt of the pandemic-
(Bauerly et al., 2019). However, telehealth services        related job losses. Providing high-speed internet
are underutilized in many communities due to no             connections to these households could have helped
or slow internet access and internet affordability          many retain employment, through telework, or
issues (Kourvelas et al., 2021).                            could have aided them in their job search to find
      The importance of high-speed home internet            new employment faster.

                                                          BOYD CENTER FOR BUSINESS & ECONOMIC RESEARCH       |   2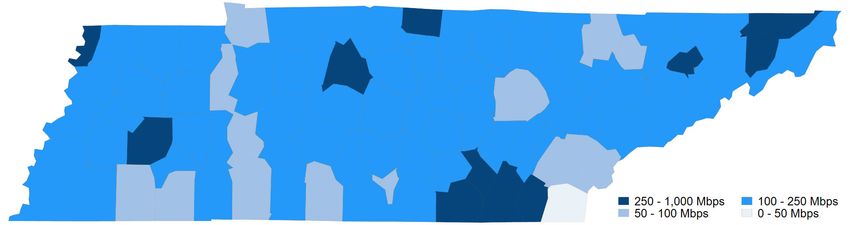
How will Expanding Broadband Internet
             Access Benefit Knox County, TN?
1. Introduction                                                                          In this report, we discuss the various benefits
                                                                                    associated with KUB’s Fiber to the Home Business Plan,
      The Knoxville Utilities Board (KUB) provides                                  which aims to provide cheaper ultra-fast internet
electricity to over 200,000 households in Knox                                      to all households and businesses in KUB’s electric
County and portions of six surrounding counties.                                    grid service area.3 To provide some background,
KUB’s electric grid spans nearly 700 square miles and                               Section 2 reports key demographic and economic
utilizes over 5,000 miles of service lines. As part of                              indicators of Knox County, as well as information
a modernization effort, KUB plans to upgrade its                                    on current broadband infrastructure and availability
electrical grid by installing an extensive fiber system,                            in the county. Direct economic benefits of KUB’s
which will provide a more reliable electricity service,                             proposal are then discussed in Section 3, with a
better efficiency, and shorter downtimes in the event                               focus on the cost savings associated with switching
of power outages. The fiber system would also enable                                to a cheaper monthly internet plan as well as time
KUB to offer ultra-fast internet, with direct fiber to                              savings associated with faster upload and download
the home connections (FTTH), to all households and                                  speeds. These direct economic benefits will be
businesses in its electric service area (see Figure 1).                             enjoyed by the individual households and businesses

                                                         Figure 1: KUB Electric Service Area

Source: https://www.kub.org/about/about-kub/kub-service-areas/.

3
    As discussed further in Section 3, KUB’s proposed plan would offer upload and download speeds of 1 gigabits-per-second (Gbps) at a price of $65 per month.

3     |    BOYD CENTER FOR BUSINESS & ECONOMIC RESEARCH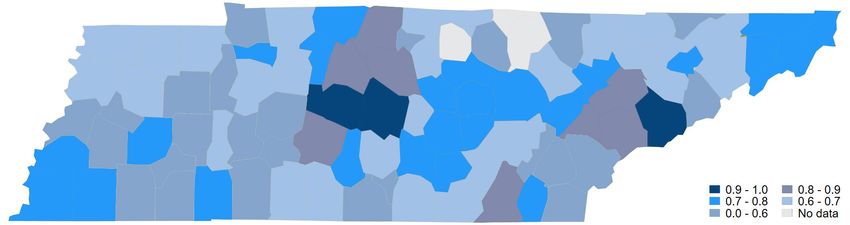
who switch to the proposed KUB internet plan, but                                       GDP per capita, while Hjort and Poulsen (2019)
these benefits will have a strong positive economic                                     found that when fast internet becomes available, the
effect on the region as a whole as more households                                      probability of individual employment increases by at
hook into KUB’s ultra-fast internet. Assuming that                                      least 3.1%. International research has also shown that
35% of KUB households adopt the new internet                                            the expansion of broadband to rural communities has
plan, we estimate that the cost savings of switching                                    led to reductions in rural depopulation (Briglauer et
from their current provider would lead to a $18.5                                       al., 2019; Lehtonen, 2020). While on the education-
to $85.7 million increase in Tennessee incomes                                          front, research has shown that students with high-
per year, depending on the cost of their current                                        speed internet access have higher grade point averages
internet plan.4,5 In addition to cost savings, KUB’s                                    (GPA), perform better on standardized tests, and
proposed plan would provide consumer surplus                                            apply to more colleges (Dettling et al., 2018; Bauer et
for its customers. Consumer surplus measures the                                        al., 2020; Hampton et al., 2020). Furthermore, Kolko
benefit that buyers receive for purchasing a good or                                    (2009) shows that people switching from dial-up to
service at a lower price than they are willing to pay.                                  broadband connections spend more time using the
Given the current prices of available internet plans                                    internet, indicating a strong consumer preference
in Knox County (some of which are documented in                                         for high-speed connections. Broadband is also used
Section 3), KUB’s broadband plan would provide                                          as a tool for entertainment, social networking, job
a significant boost in consumer surplus. In recent                                      searches, shopping, banking, and newsgathering.
studies, Brynjolfsson et al. (2019) estimated that                                      However, Coren (2016) notes that many mobile
the average person gained roughly $32,000 per year                                      data plans and slow internet connections cannot
from having access to broadband services, and Lobo                                      adequately handle the bandwidth needed for many of
(2020) found that ultra-fast internet connections in                                    these applications. As a result, those without a reliable
Hamilton County raised consumer surplus by $128                                         high-speed internet connection may find themselves
million per year. The $32,000 estimate is very high,                                    at a severe economic and social disadvantage.6
but demonstrates that consumers place high value                                              The majority of studies focused on the
on faster and stronger internet speeds. Furthermore,                                    benefits of broadband were performed prior to
Lobo (2015) found that current internet service                                         the COVID-19 pandemic, and the pandemic has
providers (ISPs), such as Xfinity and AT&T, reduced                                     certainly magnified the importance of high-speed
their prices after ultra-fast municipal broadband was                                   home internet connections. In the spring of 2020
brought to Hamilton County in 2010. In the most                                         large swaths of the state economy were shutdown
extreme case, Xfinity reduced the price of its 105                                      to limit the spread of COVID-19. As a result, many
megabits-per-second (Mbps) plan by 55% between                                          workers and students shifted to telework and online
2010 and 2014. Thus, increased competition should                                       learning, while physicians and health insurance
provide a strong positive benefit to consumers.                                         companies made telehealth more widely available
     Regional economic benefits of broadband                                            and reimbursable. However, these online tools were
internet are discussed in Section 4. Access to                                          only available to those with a reliable high-speed
high-speed internet at the home has a number of                                         internet connection. Furthermore, as shown in
important economic and social benefits. In Section                                      Section 2, the majority of Knox County residents
4, we review the various strands of literature focused                                  without home internet connections are those in
on the benefits of broadband, including the positive                                    lower-income households. Lower-wage workers
economic effects on gross domestic product                                              were also the group that suffered the brunt of the
(GDP), employment outcomes, firm activity, and                                          pandemic-related job losses. Providing high-speed
rural migration, as well as the social benefits tied to                                 internet connections to these households could have
education and health. For example, Sosa (2014) finds                                    helped many retain employment, through telework,
that providing ultra-fast broadband to metropolitan                                     or could have aided them in their job search to find
statistical areas (MSAs) leads to a 1.1% increase in                                    new employment faster.
4
  This 35% take-up rate assumption is taken straight from KUB’s “Fiber to Home Business Plan.” However, as noted in Section 3, other municipalities with
broadband services have seen residential take-up rates of 50% or higher.
5
    These estimates also include multiplier effects, which are discussed in more detail in Section 3.
6
    As discussed in Section 2, nearly 16% of Knox County households do not have an internet connection in their home (Table 3).

                                                                                    BOYD CENTER FOR BUSINESS & ECONOMIC RESEARCH                           |   4
Defining Broadband Internet                                                           FTTH run fiber directly to the end user’s home,
                                                                                      eliminating the need for “last mile” transmission.
      With the signing of the Telecommunications                                      Because FTTH is a pure-fiber technology, it offers
Act of 1996, the Federal Communications                                               higher bandwidth compared to FTTC and FTTN.
Commission (FCC) updated its universal service                                        KUB’s proposed plan would run FTTH fiber
objective to include “advanced” services                                              throughout its entire electric grid, providing high
(i.e., broadband internet).7 In the same way that                                     bandwidth fiber internet to its customers–even
telephone service was made available to every                                         those where current ISPs deemed it infeasible or
household in the twentieth century, expanding                                         cost prohibitive to run “last mile” fiber lines.
broadband service nationwide at affordable rates
in the twenty-first century is among the FCC’s                                        2. Knox County, TN
chief policy objectives. Broadband allows users
to access high-speed internet from desktops,                                          Demographic and Economic Profile
laptops, smartphones, and other electronic devices.
Compared to “dial-up” service, broadband offers                                            Knox County, with a population of 470,313,
faster download/upload speeds, lower latency,                                         is the third largest county in Tennessee. Over the
and higher bandwidth.8 Since 2015, the minimum                                        last decade, the county has seen strong population
standard for broadband requires download/upload                                       growth, advancing by 8.8% between 2010 and 2019.
speeds of 25/3 Mbps.                                                                  Population growth in Knox County was much faster
      Broadband can be provided over different                                        than the nation as a whole, which grew by 6.3%
platforms. Most common are digital subscriber                                         over the same period. Table 1 Panel A reports
lines (DSL), which transmit data over the existing                                    key demographic indicators for Knox County, as
infrastructure of copper telephone lines, and cable                                   compared to the state of Tennessee, and the nation
                                                                                      as a whole. Knox County’s population is much less
modems, which deliver high-speed internet through
                                                                                      diverse than both the state and national average;
the same coaxial cables used to deliver content to
                                                                                      81.8% of the county’s population is White, 8.2% is
TV sets. Broadband can also be achieved through
                                                                                      Black, and 4.6% is Hispanic. The county has higher
a wireless (Wi-Fi) connection, which uses radio
                                                                                      rates of educational attainment than both the state
signals as opposed to telephone lines or cable. In
                                                                                      and nation, with 92% of adults (aged 25 years and
rural areas, satellite connections are more common.
                                                                                      older) having graduated high school and 38% having
Increasingly, however, ultra-fast internet can be
                                                                                      a bachelor’s degree or higher. Median household
achieved through fiber technology, whereby fiber
                                                                                      income in the county was $57,470 in 2019, which
optics carry data via pulses of light through strands
                                                                                      was higher than the state average but well below the
of fiber to the end user. Fiber technology is able to
                                                                                      national average.
transmit data at speeds that far exceed DSL or cable                                       Table 1 Panel B presents some economic
and offers greater reliability than satellite.                                        indicators of the county, state, and nation. Knox
      Establishing a high-speed internet connection                                   County’s inflation-adjusted gross domestic product
using fiber technology can be achieved through                                        (real GDP in 2012 Dollars) was $24.5 billion in 2019,
a few transmission methods: fiber-to-the-node                                         representing 7.5% of all economic activity in the
(FTTN), fiber-to-the-curb (FTTC), and fiber-to-                                       state. As of February 2020 (prior to the pandemic),
the-home (FTTH). Providers that offer FTTN run                                        there were over 409 thousand workers in the
fiber lines to a node or neighborhood. From there,                                    Knoxville MSA, representing 13% of all workers in
the “last mile” of transmission is achieved through                                   the state of Tennessee. Throughout the country, the
existing coaxial cable or copper telephone lines.                                     labor force continues to recover from the pandemic,
FTTC brings fiber optic strands within 1,000 feet                                     however, Knox County and the Knox MSA have
of the end user, to the curb, or closet that houses                                   seen a quicker rebound than both the state and
the communications device. Providers that offer
7
  For a brief history of the FCC’s universal service objective, see https://www.fcc.gov/general/universal-service#:~:text=The%20Telecommunications%20Act%20
of%201996,just%2C%20reasonable%20and%20affordable%20rates.
8
  Latency refers to the amount of time it takes for a signal to travel to and from its destination. Bandwidth measures the amount of data that can be transferred in a
network.

5    |   BOYD CENTER FOR BUSINESS & ECONOMIC RESEARCH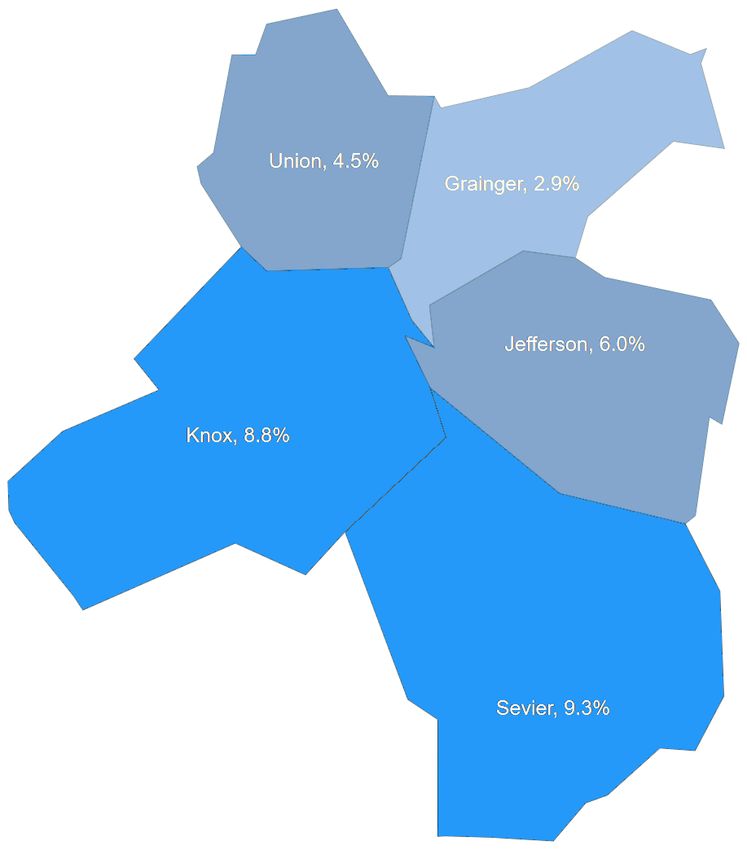
Table 1: Knox County Profile

 Panel A. Demographics & Household Profile                                                 Knox County          Tennessee              U.S.

 Population (July 1, 2019)                                                                       470,313         6,829,174    328,239,523

 Population, growth (2010-2019)                                                                    8.80%            7.60%           6.30%

 Median Age                                                                                          37.4             38.7             38.1

 Population by age group:

      18 and under                                                                               20.90%             22.10%         22.20%

      18-24                                                                                        11.70%            9.10%          9.30%

      25-54                                                                                       38.80%           39.00%         39.00%

      55-64                                                                                       12.50%            13.10%         13.00%

      65 and over                                                                                  16.10%          16.70%          16.50%

 Population by gender:

      Male                                                                                       48.60%            48.80%         49.20%

      Female                                                                                      51.40%           51.20%         50.80%

 Population by race/ethnicity:

      White                                                                                       81.80%           73.30%         60.00%

      Black or African American                                                                    8.20%           16.60%          12.40%

      American Indian and Alaska Native                                                            0.40%            0.30%           0.70%

      Hispanic                                                                                     4.60%            5.70%          18.40%

      Asian                                                                                         2.10%            1.80%          5.60%

      Native Hawaiian and Other Pacific Islander                                                   0.00%            0.00%           0.20%

      Other Race                                                                                   0.30%            0.20%           0.30%

      Two or More Races                                                                            2.70%             2.10%          2.50%

 High school graduate or higher, percent of persons age 25+, 2019                                 91.70%           87.50%         88.00%

 Bachelor’s degree or higher, percent of persons age 25+, 2019                                    37.60%           27.30%          32.10%

 Number of households (2019)                                                                      187,319        2,597,292    120,756,048

 Average household size (2018)                                                                       2.40             2.52            2.62

 Median household income (in 2019 dollars), 2019                                                 $57,470          $53,320        $62,843

 Poverty rate 2019 (%)                                                                            13.40%           13.90%          10.50%

 Panel B. Economic Indicators                                                              Knox County          Tennessee              U.S.

 Real GDP 2019 (2012 Dollars)                                                                $24.5 billion   $328.4 billion   $19.1 trillion

 Total Non-Farm employment (Pre-pandemic, February 2020) *                                       409,300         3,153,700    152,523,000

 Unemployment rate (Pre-pandemic, February 2020) *                                                 3.60%            3.90%           3.50%

 Unemployment rate (Current, March 2021) *                                                         4.50%            5.00%            6.10%

Source: U.S. Census, Bureau of Labor Statistics, Bureau of Economic Analysis, * Knoxville MSA.

                                                                          BOYD CENTER FOR BUSINESS & ECONOMIC RESEARCH                 |   6
nation as a whole. As of March 2021, Knoxville’s profile shift more towards jobs that can be
(MSA) unemployment rate was 4.5%, which is done remotely. Figure 2 shows that since 2010,
less than a percentage point higher than the pre- Knoxville has seen a steady increase in the share
pandemic unemployment rate from February 2020. of jobs that can be performed remotely. Figure 3
Table 2 presents a snapshot of employment further illustrates this point, showing that
by sector for the Knoxville MSA, as of 2019. employment growth over the last decade (2010
The two largest sectors in the MSA were the to 2019) was particularly strong in the Knoxville
Trade, Transportation, and Utilities sector, and sectors that are more readily able to shift to
the Professional and Business Services sector. remote work. These figures show that, even
Together, these two sectors employed more before the pandemic, remote work was trending
than one-third of all Knoxville MSA workers. upward in Knox County. However, COVID has
Following Dingel and Neiman (2020) and Lobo certainly accelerated this trend.
(2020), Table 2 also identifies the sectors where
at least 50% of the jobs can be performed Broadband Availability in Knox County, TN
remotely (with an asterisk).9 Dingel and Neiman
(2020) found that 37% of all U.S. jobs could be For broadband infrastructure to generate
performed remotely. According to the same study, economic gains, it must be (1) made available
35% of all jobs in the Knoxville MSA could be by providers and (2) used by households and
performed remotely. Knoxville is more heavily businesses. To understand the extent to which
concentrated in industries that lend themselves households in Tennessee subscribe to internet
to remote work than the rest of Tennessee services, we first turn to the FCC’s Form 477
but is less invested than the nation as a whole. dataset. Made available twice per year for the
However, Knoxville continues to see its industry reference monts of June and December, these
Table 2 Industry Snapshot – % of Jobs by Major Sector (2019)
Knoxville MSA Tennessee U.S.
Industry % of Total
Total Nonfarm Employment 405,400 3,122,900 150,905,000
Trade, Transportation, and Utilities 19.50% 20.40% 18.40%
Professional and Business Services* 16.10% 13.70% 14.10%
Government 14.60% 14.00% 15.00%
Education and Health Services* 13.70% 14.30% 16.00%
Leisure and Hospitality 11.00% 11.10% 11.00%
Manufacturing 10.20% 11.40% 8.50%
Financial Activities* 4.90% 5.50% 5.80%
Mining, Logging, and Construction 4.70% 4.30% 5.40%
Other Services 4.00% 3.90% 3.90%
Information* 1.50% 1.50% 1.90%
Source: Bureau of Labor Statistic; * are industries and occupations where at least 50% of all jobs can be done from home based on estimate from Dingel
and Neiman (2020).
9
Using survey data, Dingel and Neiman (2020) classify the feasibility of working remotely for occupations and industries based on the nature of their workday. Lobo
(2020) then applies Dingel and Neiman’s estimates to the employment profile of Hamilton County, TN.
7 | BOYD CENTER FOR BUSINESS & ECONOMIC RESEARCHFigure 2: Knoxville MSA, Growth in Remote Work Industries.
37.0
Growth in Remote Work Industries (%)
36.5
36.0
35.5
37.0
35.0
Growth in Remote Work Industries (%)
36.5
34.5
36.0
34.0
2010 2011 35.5
2012 2013 2014 2015 2016 2017 2018 2019 2020
Source: Bureau of Labor Statistics; Knoxville MSA
ssional and Business 35.0
Note: Services*
The figure represents growth in the share of Knoxville MSA jobs in the following sectors: Professional and Business Services, Education and Health
Services, Financial Activities, and Information.
Manufacturing
34.5
Leisure and Hospitality
34.0
ducation and Health Services* Figure 3: Knoxville MSA,
2010 Growth Rates2013
2011 2012 by Major
2014Sector
2015(2010-2019)
2016 2017 2018 2019 2020
Total
Professional and Business Services*
Financial Activities*
Manufacturing
Other ServicesLeisure and Hospitality
ng, Logging, and Construction
Education and Health Services*
e, Transportation, and Utilities Total
Financial Activities*
Information*
Other Services
Government
Mining, Logging, and Construction
-5.00% 0.00% 5.00% 10.00% 15.00% 20.00% 25.00% 30.00%
Trade, Transportation, and Utilities
Information*
Government
-5.00% 0.00% 5.00% 10.00% 15.00% 20.00% 25.00% 30.00%
Note: * denote sectors where at least 50% of all jobs can be done from home based on estimate from Dingel and Neiman (2020).
Source: Bureau of Labor Statistics; Knoxville MSA
BOYD CENTER FOR BUSINESS & ECONOMIC RESEARCH | 8data report the number of fixed consumer (i.e., States throughout recent history. Between June
household) internet connections by county, an 2016 and December 2018, an additional 3.5%
estimate of the number of households in each of households in the United States gained fixed
county, and the share of households with internet internet access offering download and/or upload
access.10 To be sure, the data report connections speeds of at least 200 kbps. Knox County started
that offer download and/or upload speeds of at below the national average, but of particular note
least 200 kilobits-per-second (kbps), which falls far are the stronger trends seen for Tennessee and its
below the FCC’s current broadband benchmark constituent areas. During the same time period,
of 25 Mbps.11 Therefore, the Form 477 data internet connectivity rates increased from 77.5%
only provide a snapshot of internet access but to 84.0% in Knox County, nearly double the gains
not necessarily high-speed internet access at the made at the national level. In fact, Knox County’s
county level. This is important because internet internet connectivity rate surpassed the national
speeds of 200 kbps are not sufficient for many average in December 2018. The Knoxville MSA
common internet uses such as (but not limited and the state of Tennessee reported similar growth
to) video streaming, telehealth services, and video at slightly lower levels of overall connectivity.
conferencing. This divergence also highlights Again however, these data include internet
the severe gap in data availability on household connection speeds as low as 200 kbps.
broadband coverage throughout the nation. For a more complete picture of Knox
Figure 4 reports the share of households County’s connectivity rate, we turn to American
with fixed internet access connections (200 kbps Community Survey (ACS) data published by the
or higher) in December 2018 (the most-recent data U.S. Census Bureau, which provides data on actual
available) for all counties in Tennessee. In Knox broadband access. Table 3 presents statistics on
County, 84% of households had some form of fixed household use of computers and broadband for
internet access offering download and/or upload Knox County in 2015 and 2019, the most recent
speeds of at least 200 kbps. This measure of internet year available. While more than 94% of households
availability ranks Knox County tenth among all 95 in Knox County had some sort of computing
counties in the state of Tennessee.12 Of the three device (e.g., desktop, laptop, smartphone, or
counties in Tennessee with internet connectivity rates tablet) in 2019, only 84.3% maintained an internet
above 90%, two are located in the Nashville MSA subscription. Diving into the details, more than
(Williamson and Rutherford) and one shares a border 76% of households had either a desktop or laptop
with the Knoxville MSA (Sevier). Not surprisingly, computer, 88.5% had a smartphone, and only 5.9%
the I-40 corridor connecting the two regions also reported having no computing device at all. Of
reports above-average connectivity rates.13 Still, 22 note is the nearly 6 percentage point increase in the
counties, many of which are small and located in share of households with a computing device that
the more rural parts of the state, reported internet occurred between 2015 and 2019, owing entirely to
connectivity rates below 60%. an increase in smartphones.
In recent years, rates of internet connectivity Whereas only 5.9% of households in Knox
have increased steadily in Knox County and other County do not own a computing device, nearly
parts of Tennessee. Again examining Form 477 16% do not maintain an internet subscription.
data, Figure 5 plots the evolution of internet That’s equivalent to roughly 30,000 households.
connectivity rates in Knox County, the Knoxville Table 4 shows that disconnected homes are
MSA, the state of Tennessee, and the United not distributed uniformly across the income
10
The data also provide an estimate of the number of non-consumer (i.e., business) fixed Internet connections by county, but do not provide an estimate of the
number of businesses per county.
11
The FCC definition of broadband has evolved significantly over the years. In 1996 the broadband benchmark was 200 kbps, but was updated in 2008, 2010, and
again in 2015 to its current benchmark of 25 Mbps. The current 25 Mbps benchmark is equivalent to 25,000 kbps, and is therefore 125 faster than the threshold used
in the FCC Form 477 data.
12
In Union County, where KUB serves about half (geographically) of the county with electric service, only 64% of households had fixed Internet access, ranking the
county 60th out of all 95 counties in the state.
13
I-40 travels through eight counties between Knoxville and Nashville. These include: Knox, Loudon, Roane, Cumberland, Putnam, Smith, Wilson, and Davidson.
On average, these counties report a connectivity rate of 80%, significantly higher than the overall state average of 68%.
9 | BOYD CENTER FOR BUSINESS & ECONOMIC RESEARCHFigure 4: Share of Households with Fixed Internet Access in Tennessee, as of December 2018
Notes: Broadband data are from FCC Form 477, available at https://www.fcc.gov/form-477-county-data-internet-access-services. Household broadband connections offer upload and/or download speeds of at least 200 kbps.
Note, however, that the current definition of broadband requires download/upload speeds of 25/3 Mbps. County-level household estimates come from the 5-year American Community Survey (ACS). Counties shaded gray
are censored for confidentiality.
BOYD CENTER FOR BUSINESS & ECONOMIC RESEARCH
|
10Table 3: Household Use of Computers and Broadband in Knox County, TN
2015 2019
Total Percent Total Percent
Households with Computing Device 159,872 88.2 180,570 94.1
Desktop or Laptop 142,629 78.7 146,600 76.4
Smartphone 143,607 79.2 169,787 88.5
Tablet N/A N/A 122,411 63.8
Other Computer 15,111 8.3 5,711 3.0
No Computer 21,420 11.8 11,355 5.9
Households with Internet Subscription 138,537 76.4 161,869 84.3
Dial-up 462 0.3 177 0.1
Broadband 138,075 76.2 161,692 84.2
No Internet 42,755 23.6 30,056 15.7
Notes: Data are from the American Community Survey (ACS) table ID: S2801. In 2015, the survey did not differentiate between smartphones and tablets.
Instead, the survey asked whether a household had a “handheld device.” These results are presented alongside the smartphone category above. In the
survey, broadband is only defined as “high speed internet service such as cable, fiber optic, or DSL...”
Table 4: Internet Subscriptions by Household Income in Knox County, TN
2015 2019
Total Percent Total Percent
Household Income: Less than $20,000 31,172 N/A 29,612 N/A
Dial-up 0 0.0 0 0.0
Broadband 14,406 46.2 17,905 60.5
No Internet 16,766 53.8 11,707 39.5
Household Income: $20,000 to $74,999 88,987 N/A 85,181 N/A
Dial-up 424 0.5 69 0.1
Broadband 67,118 75.4 69,263 81.3
No Internet 21,445 24.1 15,849 18.6
Household Income: More than $75,000 61,113 N/A 77,132 N/A
Dial-up 38 0.1 108 0.1
Broadband 56,551 92.5 74,524 96.6
No Internet 4,544 7.4 2,500 3.2
Notes: Data are from the 2015 and 2019 American Community Survey (ACS) table ID: S2801. In the survey, broadband is only defined as “high speed
internet service such as cable, fiber optic, or DSL...”
distribution in Knox County. In 2015, less than The exact extent to which this disparity in
half of all households with annual incomes below household connectivity is a function of supply
$20,000 maintained a broadband subscription. (i.e., the availability of broadband) or demand
By 2019, this rate of connectedness had risen to (i.e., the propensity of a household to subscribe
60.5%, but still remains well below households to broadband service) is not entirely clear. On
with annual incomes above $20,000. Indeed, only one hand, internet service providers (ISPs)
3.2% of households making more than $75,000 have historically found it cost-prohibitive to
per year do not have a broadband subscription. expand broadband infrastructure into remote
11 | BOYD CENTER FOR BUSINESS & ECONOMIC RESEARCHFigure 5: Share of Households with Fixed Internet Access
100
90
Percent of Households
80
70
60
50
June 2016 Dec. 2016 June 2017 Dec. 2017 June 2018 Dec. 2018
United States Knoxville MSA Tennessee Knox County
Notes: Internet access data are from FCC Form 477, available at https://www.fcc.gov/form-477-county-data-internet-access-services. Household internet
connections offer upload and/or download speeds of at least 200 kbps. Note that the current definition of broadband requires much faster download/
upload speeds of 25/3 Mbps. County-level household estimates come from the 5-year ACS. In aggregating counties to the MSA, state, and national levels,
censored counties were omitted from the sample. The Knoxville MSA includes the following counties and FIPS codes: Anderson (47001), Blount (47009),
Campbell (47013), Grainger (47057), Knox (47093), Loudon (47105), Morgan (47129), Roane (47145), and Union (47173).
communities. Challenging terrain and greater availability since not all households in a census block
distances between households have meant that may have access to a provider’s internet service type.
many rural communities have been kept under- Nevertheless, the data provide a descriptive view
connected relative to urban communities that have of where ISPs offer high-speed internet service at a
higher housing densities and telecommunication very granular level. Figure 6 reports the distribution
infrastructure already in place. On the other of ISPs offering fiber to households (Panel A) and
hand, low-income households might not view businesses (Panel B) in June 2020, and shows that
broadband as a necessity. This view, however, has there are still many census blocks in Knox County
been challenged recently. With the rise of remote without a fiber connection.
work, telehealth, and online learning (for grades Across all broadband technologies, how
K-12 and beyond), having a stable broadband does Knox County compare to the rest of
connection with sufficient bandwidth has become Tennessee with regard to download and upload
increasingly important. speeds? Examining census-block-level Form 477
To address the supply-side question of whether data for the state of Tennessee, Figure 7 shows
high-speed internet is available uniformly across that ISPs in Knox County advertise maximum
Knox County, we return to Form 477 data. This download speeds of 233 Mbps, on average.
time, we examine data reporting the number of This is 56 Mbps faster than the state average.
ISPs offering fiber internet connections at the However, it is important to note that advertised
census-block level. To be sure, an ISP is said to download speeds are not necessarily realized
offer a fiber internet connection to a census block speeds. Furthermore, Knox County only ranks
if it is serviced by at least one internet connection. 15th out of all Tennessee counties, which is
Especially true for larger census blocks, these troubling given that it’s the third-largest county
data should be viewed as an upper bound of ISP (population-wise) in the state.
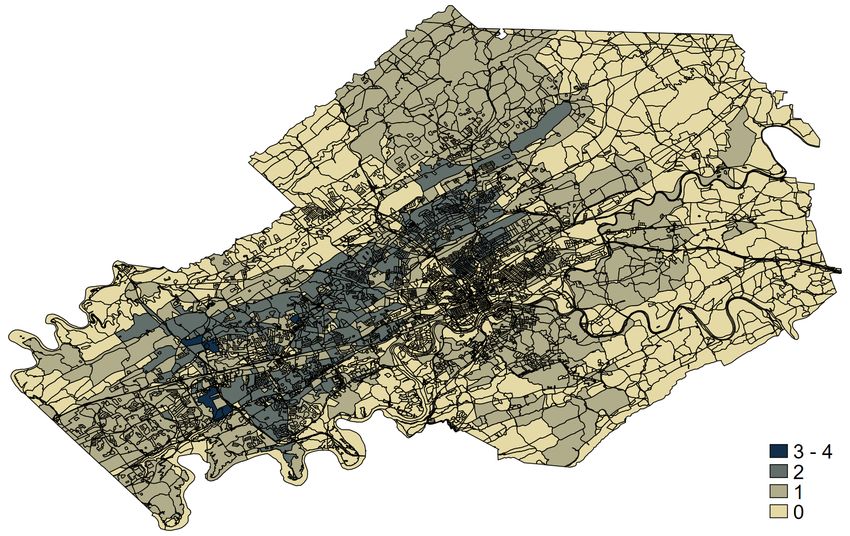
BOYD CENTER FOR BUSINESS & ECONOMIC RESEARCH | 12Figure 6: Number of Internet Service Providers by Census Block in Knox County, TN in June 2020
Panel A. Fiber Available to Households
3-4
2
1
0
Panel B. Fiber Available to Businesses
3-7
2
1
0
Notes: Fixed internet access data data are from FCC Form 477, available at https://www.fcc.gov/general/broadband-deployment-data-fcc-form-477. As per
Form 477, twice per year, providers file lists of the census blocks in which they can or do offer service to at least one location at download and/or upload
speeds of at least 200 kbps. Fiber is defined as fiber to the end user (i.e., FTTH, FTTB) and not fiber to the curb (FTTC).
13 | BOYD CENTER FOR BUSINESS & ECONOMIC RESEARCHFigure 7: Average Maximum Download Speeds in Tennessee as of June 2020
Notes: Fixed internet access data are from FCC Form 477, available at https://www.fcc.gov/general/broadband-deployment-data-fcc-form-477. Average maximum download speeds are based on advertised speeds. Internet
service providers (ISPs) not offering broadband to residential customers are excluded from the calculation of average download speeds.
BOYD CENTER FOR BUSINESS & ECONOMIC RESEARCH
|
14As with most broadband data, the more internet providers in Knox County. This would
granular, the better. Knowing exactly where homes provide a substantial cost savings to customers.
and business are connected (or not connected) is Table 5 presents a prospective product
of great interest and importance to policy makers. comparison for residential internet between
To limit reliance on federal maps that tend to the proposed KUB plan and some of those
overstate the availability of broadband, especially offered by Xfinity, which is currently the largest
in rural areas, the Associated Press recently residential internet provider in Knox County.
reported that Tennessee officials are moving Aside from their 25 Mbps plan – with download
forward with their own broadband map.14 The speeds that are 1/40 as fast as KUB’s proposed
plan involves collecting and validating data from plan – Xfinity’s other offerings are all at a higher
ISPs for one year to produce a detailed map of monthly price than KUB’s proposed plan. Based
where broadband does and does not exist in the on Table 5, the proposed KUB 1 Gbps plan
state. The map is expected to be completed by the would cost $11-$51 less per month than the
summer of 2022. Xfinity 100 Mbps and 1 Gbps plan respectively.
Thus, switching from one of these current plans
3. KUB’s plan and its economic effects to the proposed KUB plan would lead to yearly
savings ranging from $132-$612.15
Under KUB’s current proposal, residential Table 6 shows how these savings can have a
internet plans would offer internet speeds of sizable economic impact in Tennessee. Specifically,
1 gigabits-per-second (Gbps, equivalent to KUB will offer this internet plan to its roughly
1,000 Mbps) at much lower prices than existing 200,000 electric customers. If 35% of those
Table 5: Prospective Plan Comparisons
Xfinity KUB
Xfinity Xfinity
1Gbps 1Gbps
25Mbps 100Mbps
(1000Mbps) (1000Mbps)
Download Speed 25Mbps 100Mbps 1Gbps 1Gbps
Upload Speed 3Mbps 10Mbps 35Mbps 1Gbps
Data Cap 1.2 TB 1.2 TB 1.2 TB Unlimited
Cost per month $56 $76 $116 $65
Source: KUB Resolution 1433 Presentation, March 11, 2021.
Note: Figures were collected by KUB in the winter of 2021 and do not include promotional discounts or other fees.
Table 6: Total Cost Savings & Economic Effects from Switching from Current Xfinity Plan to KUB Proposed Plan
Xfinity
Xfinity
1Gbps
100Mbps
(1000Mbps)
Cost savings per household, per month $11 $51
Cost savings per household, per year $132 $612
Total cost savings per year 200,000 customers with take up rate 35%* $9,240,000 $42,840,000
Total Income Effect** $18,480,000 $85,680,000
*Assumes a 35% take-up rate among the 200,000 eligible households (i.e. 70,000 households)
**Assumes a multiplier of 2
14
See https://apnews.com/article/tennessee-business-technology-9f06aca4b8e0c2f0a652872c81461ef7.
15
Switching from the Xfinity 100 Mbps plan would lead to an annual savings of $132, and switching from the Xfinity 1 Gbps plan would save consumers $612 per
year.
15 | BOYD CENTER FOR BUSINESS & ECONOMIC RESEARCHcustomers switched from one of these existing cost-savings estimates above. Previous studies
providers to the KUB plan, this would lead to an have concluded that the expansion of broadband
aggregate consumer savings of $9.2-$42.8 million provides tremendous amounts of consumer
per year. Furthermore, households could then use surplus. For example, Greenstein and McDevitt
these savings to make purchases at other Tennessee (2009) found that broadband access in the United
businesses. Those purchases will then create States generated $8.3 billion to $10.6 billion in
additional income for other Tennesseans. This is consumer surplus between 1999 and 2006. More
known as the multiplier effect, whereby money is recently, and in one of the most extensive studies
spent and re-spent elsewhere in Tennessee, such on broadband and consumer surplus, Brynjolfsson
that each dollar can generate more than one dollar et al. (2019) used massive online choice
of economic activity. Assuming a (conservative) experiments and found that the average person
multiplier effect of 2, this would generate gained roughly $32,000 per year from having access
$18.5-$85.7 million of additional income to to broadband services. More related to KUB’s
Tennesseans every year. proposed plan, Lobo (2020) examined the impact
These estimates are of course based on a of ultra-fast broadband on consumer surplus in
number of assumptions. We assume that 35% of Hamilton County. Using similar methodology as
Knox County households within KUB’s coverage Brynjolfsson et al. (2019), Lobo (2020) found that
area currently have broadband access, like the the implementation of ultra-fast broadband led to
Xfinity plans we described, and will switch to a $128 million increase in consumer surplus for
KUB’s broadband offerings resulting in cost Hamilton County households. In addition to cost
savings. While other internet plans exist, such as savings, Zuo (2019) finds that broadband pricing
AT&T, WOW!, Spectrum, and TDS, we assume can have a strong positive effect on labor market
that all of those that switch are switching from outcomes among lower-income households.
the two Xfinity broadband plans mentioned The KUB internet plan would also offer
above, as other providers service smaller portions both download and upload speeds that are much
of the county. However, Xfinity does have the faster than the majority of residential internet
largest ISP market share in the County, and this plans currently on the market. This could lead
assumption simplifies our discussion of the results to profound gains in both productivity and
and provides reasonable estimates on consumer leisure time, as outlined in Table 7. For example,
cost savings. KUB’s 35% take-up rate is likely allconnect.com provides information on how
conservative, as other areas and municipalities with long it takes to download a file of a specific size
broadband services have seen residential take-up with varying download speeds.17 For internet
rates of 50% or higher (Lobo, 2020; highlandil. plans with a maximum download speed of
gov).16 In this regard, our estimates can be seen as 1 Mbps (which is still 5-times faster than the
a lower bound in consumer cost savings. 200 kbps threshold used in the FCC Form 477
An examination of the broadband literature on data from Figures 4 and 5), it would take more
consumer surplus also suggests that our estimates than 9.5 hours to download a 4 gigabyte (GB)
can be considered a lower bound. Consumer file (a typical size for a standard high definition
surplus is measured as the difference between the quality movie). By comparison, it would take
price that consumers pay and the price they are nearly 23 minutes to download the same file with
willing to pay. That is, consumer surplus measures a 25 Mbps connections, but only 34 seconds
the benefit that buyers receive for purchasing a with KUB’s proposed 1,000 Mbps connection
good or service at a lower price than they were (equivalent to 1 Gbps).
willing to pay. Given the current prices of available The gains from upload times are even more
internet plans in Knox County, KUB’s broadband substantial, as upload speeds from current ISP
plan would substantially increase the consumer plans are much slower than download speeds.
surplus of its customers – and the increase in Increased upload speeds under KUB’s proposed
consumer surplus is not fully captured by our plan will also be a great benefit to workers and
16
https://www.highlandil.gov/departments/technology_and_innovation/our_story.php. Accessed on May 19, 2021.
17
https://www.allconnect.com/blog/internet-speed-classifications-what-is-fast-internet
BOYD CENTER FOR BUSINESS & ECONOMIC RESEARCH | 16Table 7: Download and Upload Times at Various Internet Speeds
Speed 1Mbps 10Mbps 25Mbps 50Mbps 100Mbps 200Mbps 400Mbps 1,000Mbps
Time to
download a 9h 32m 39s 57m 15s 22m 54s 11m 27s 5m 43s 2m 51s 1m 25s 34s
4GB file
Speed 1Mbps 3Mbps 5Mbps 10Mbps 30Mbps 50Mbps 100Mbps 500Mbps
Time to upload
1h 9m 54s 23m 18s 13m 58s 6m 59s 2m 19s 1m 23s 41s 8s
a 500MB file
Source: https://www.allconnect.com/blog/internet-speed-classifications-what-is-fast-internet
Note: 1,000 Mbps is equivalent to KUB’s proposed 1 Gbps plan.
businesses who create online content. As an productivity, labor market outcomes, firm activity,
example, a local plumber might market his/her and rural migration patterns, as well as strong
business by uploading a short video to YouTube, social benefits tied to improved educational and
which demonstrates how to unclog a sink. Or a health outcomes. These benefits are discussed
teacher might upload a short video to complement separately, but they interact so that the whole is
a homework assignment. Supposing these videos more than the sum of the parts. For example, good
were 500 megabytes (MB) each, it would take healthcare makes for a more productive workforce
over an hour to upload with a 1 Mbps upload and improved education offers long-term benefits
connection, and 23 minutes with a 3 Mbps upload for productivity growth, higher incomes, and lower
connection (the current upload speed in Xfinity’s unemployment rates.
25 Mbps plan). Even under Xfinity’s ultra-fast
1 Gbps plan, they currently only offer upload Economic Growth and Productivity
speeds of 35 Mbps. According to allconnect.
com, it would take more than 2 minutes to upload Since the arrival of broadband, economists
the short video clip with a comparable 30 Mbps and policy makers have been keenly interested
upload connection. This is a very respectable in what value broadband brings to the economy.
speed/time, but for those needing to upload From the beginning, many studies examined the
multiple files, the time commitment could add up impact of broadband access and adoption in
relatively quickly. By comparison, an internet plan comparison to much slower dial-up connections.
with upload speeds of 500 Mbps (half the speed It was immediately clear that the adoption of
of KUB’s proposed plan) could upload the video broadband brought economic gains. Qiang et al.
clip in just 8 seconds. (2009) found that a 10 percentage point increase
Furthermore, KUB would offer internet plans in fixed broadband penetration would increase
with no data caps. Private ISPs have implemented GDP growth by 1.21% in developed economies.
home internet data caps in recent years and then Likewise, Czernich et al. (2011) and Zaballos and
charge overage fees to customers exceeding their López-Rivas (2012) found that the introduction
imposed data caps. As a municipal utility company, of broadband increased GDP per capita growth
KUB would not impose data caps, allowing by 2.7-3.9% and 3.19% respectively. These studies,
customers to avoid both overage fees and the need and many others (Koutroumpis, 2009; Katz et al.,
to worry about limiting their home internet usage – 2010; Scott 2012; Feng and Ma, 2013), demonstrate
especially at the end of each month/billing cycle. that access and adoption of broadband generates
GDP growth across countries.
4. Economic Effects of Broadband KUB’s broadband infrastructure plan is not
limited to expanding broadband coverage but
This section provides an overview of the will also dramatically increase broadband speeds
literature focused on the benefits of broadband for the coverage area. The limited research on
access as well as increased internet speeds. The ultra-fast broadband shows promising effects. For
benefits of broadband are numerous, including example, Sosa (2014) identified 14 MSAs in the
significant economic effects on GDP and United States that provided ultra-fast broadband
17 | BOYD CENTER FOR BUSINESS & ECONOMIC RESEARCHto at least 50% of their residents and found that On the labor supply side, the literature generally
GDP per capita was 1.1% higher in these MSAs finds that broadband access improves the labor
than in their control group of 41 similarly sized market outcomes of unemployed workers.
MSAs where ultra-fast broadband was not Examining the National Longitudinal Survey of
widely available. Similarly, Briglauer and Youth (NLSY97), Kuhn and Mansour (2014)
Gugler (2019) found that a 1% increase in the found that unemployed workers who used the
adoption of ultra-fast broadband generated a internet to search for work were re-employed
0.004–0.005% increase in GDP. about 25% faster than comparable workers who
In addition to GDP growth, broadband has did not search for work online.
been shown to have strong positive effects on This reduction in search frictions is also
productivity (i.e. output per worker). For example, evident on the labor demand side. Using individual-
Tyson (2013) reports that a study by Sandisk level data from Norway, Bhuller et al. (2019)
found that firms with slow internet connections found that greater broadband availability not only
saw productivity losses of 4.9 workdays per increased the number of job openings online, but
employee per year. Similarly, Grimes et al (2016) also lowered the average duration of vacancies,
found that the adoption of broadband leads to and reduced the share of business establishments
a 7-10% increase in firm productivity. These with unfilled positions. Furthermore, the results
results are consistent with more recent research by revealed that unemployed workers were able to
Dalgic & Fazlioglu (2020), who found that faster find employment at establishments located farther
broadband speeds had a significant impact on firm from home, perhaps generating better labor-market
productivity. matching between employers and employees.
The impacts of broadband on GDP and Of particular interest to KUB and its plan to
productivity have been widely documented and expand fiber to its electric grid customers, Lobo
the literature converges to show that broadband et al. (2020) examined the effect of broadband
has a strong and significant impact on economic speed on county-level unemployment rates in
growth (see Bertschek et al., 2015). While, Tennessee. The results from their study showed
the research is robust and conclusive on the that counties with fast internet (with download
relationship between broadband access and speeds of at least 100 Mbps) boasted lower
economic growth, fewer studies have specifically unemployment rates by roughly 0.26 percentage
examined the impacts of ultra-fast broadband. points relative to counties without fast internet.
Although, the emerging literature does suggest Furthermore, rural counties seemed to benefit
that ultra-fast broadband has strong positive disproportionately from faster broadband than
effects on economic growth as well. did urban areas. In a related study, Hjort and
Poulsen (2019) found that when fast internet
Labor Market becomes available (where it was previously
unavailable), the probability of an individual
The impact of broadband availability and being employed increases by at least 3.1%.18 The
usage on labor markets, is also important to results from these studies are particularly helpful
local economies. Indeed, greater connectivity in attempting to foresee the economic outcomes
has the potential to aid unemployed workers from KUB’s fiber expansion plan.
in their job search. It can also help firms enjoy In several other studies, this association
enhanced labor-market matching, and for already between broadband and employment holds. Atasoy
employed workers, it can result in increased wages. (2013) found that employment rates increased by
Underlying all of these potential outcomes are 1.8 percentage points after counties gained access
the common mechanisms of quicker information to broadband, with this effect being larger in
dissemination and the ability to process more rural counties and in counties with a larger share
information overall. of college graduates. In another study, Dettling
Not surprisingly, many studies have examined (2013) examined the impact of high-speed internet
the impact of broadband availability, diffusion, use on labor force participation. The results
and adoption on various labor market outcomes. concluded that labor force participation rates of
18
In some instances, the probability of an individual being employed increased by as much as 13.2%.
BOYD CENTER FOR BUSINESS & ECONOMIC RESEARCH | 18married women rose by 4.1 percentage points due In some studies, small firms have been found
to high-speed internet use, suggesting potential to be disproportionately affected by broadband.
heterogeneous effects by gender and marital status. Indeed, Shideler and Badasyan (2012) examined
Especially after the dramatic fall in the labor force the ConnectKentucky broadband deployment
participation of women due to the COVID-19 program of the early 2000s and found that
pandemic, this result provides optimism for a increased broadband availability led to growth in
recovery in employment among women as labor the number of small firms (with fewer than
markets heal. 100 employees). Especially in rural areas, small
Referring back to Table 4, which displayed firms tend to be strong economic contributors
the breakdown of household connectivity by and essential strands in the larger economic fabric.
household income for Knox County, how are low- To that end, Kim and Orazem (2016) examined
income localities affected after the introduction/ the impact of broadband on new-firm location
expansion of broadband? Examining the discount decisions in rural Iowa and North Carolina, finding
broadband program Internet Essentials, which was gains in new-firm activity, especially among large
launched by Xfinity in 2012, Zuo (2019) found rural areas and those within close proximity to a
that PUMA-wide broadband availability increased metropolitan statistical area (MSA).
the probability of a low-income individual being Especially relevant to KUB’s broadband
employed by 0.9 percentage points; incomes also expansion plan, the Government Accountability
increased by 1.3%.19 Office (2014) found that small businesses reported
improvements in the speed and reliability of their
Firm Activity broadband service after using either federally
funded or municipal networks. Small businesses
It is not hard to imagine how broadband also reported efficiency gains, which allowed for
might impact firm activity. Greater broadband improvements to business operations (also see
connectivity made available to firms could possibly Bertschek et al., 2013). And in predominantly
lead to increased efficiencies in production minority areas, broadband availability facilitates
processes, create greater collaboration with offices/ entrepreneurship and decreases dependence on
firms in other states or countries, or allow products local banks, which may be sparsely located in
to be marketed to a wider set of consumers. minority communities (Prieger, 2020).
Broadband connectivity could also help nascent
firms with the business application process, which Education
is a necessary component of operating a business.
In a similar vein as the literature examining High-speed internet access has become
the impact of broadband and labor markets, an increasingly important tool for teaching
there are many studies that investigate how firm and learning. National data indicate that
activity responds to greater broadband availability. 70% of teachers assign homework that requires
In general, broadband is associated with gains in broadband access, and 30% of school districts
firm activity. In examining the Department of included technology in their curricula even before
Agriculture’s Broadband Loan Program (BLP), COVID-19 (Consortium for School Networking,
Kandilov and Renkow (2010) found that loans 2016; Bauer et al., 2020). Furthermore, survey
made during the Pilot BLP generated gains in data from middle school students in Michigan
not only employment, but annual payroll, and the show that the majority of students with high-
number of business establishments.20 In a follow- speed connections use the internet for a variety
up study, which examined the subsequent BLP, of educational activities including: checking
Kandilov and Renkow (2020) also reported small grades, conducting research, turning in homework,
gains in payroll per worker. emailing teachers, and working with classmates on
19
A PUMA is a Public Use Microdata Area. As per the U.S. Census Bureau’s description, PUMAs are “non-overlapping, statistical geographic areas that partition
each state or equivalent entity into geographic areas containing no fewer than 100,000 people each.” See https://www.census.gov/programs-surveys/geography/
guidance/geo-areas/pumas.html#:~:text=Public%20Use%20Microdata%20Areas%20(PUMAs)%20are%20non%2Doverlapping%2C,and%20the%20U.S.%20
Virgin%20Islands. For another study examining the effect of broadband deployment and wages, see Akerman, Gaarder, and Mogstad (2015).
20
McCoy et al. (2018) also find that broadband deployment in Ireland increased the number of firms in operation.
19 | BOYD CENTER FOR BUSINESS & ECONOMIC RESEARCHYou can also read