Identification of the Oculo-Motor System in the Form Volterra Model Based on Eye-Tracking Data
←
→
Page content transcription
If your browser does not render page correctly, please read the page content below
EPJ Web of Conferences 248, 01009 (2021)                                                              https://doi.org/10.1051/epjconf/202124801009
MNPS-2020

         Identification of the Oculo-Motor System in the Form Volterra
         Model Based on Eye-Tracking Data
         Vitaliy D. Pavlenko1,*, Tetiana V. Shamanina and Vladislav V. Chori
         1
             Computerized Control Systems Department, Odessa National Polytechnic University, UK-65044, Odessa, Ukraine

                        Abstract. Instrumental computing and software tools have been developed for constructing a nonlinear
                        dynamic model of the human oculo-motor system (OMS) based on the data of input-output experiments
                        using test visual stimulus and innovative technology. Volterra model in the form of multidimensional
                        transition functions of the 1st, 2nd and 3rd orders, taking into account the inertial and nonlinear properties
                        of the OMS was used as the identification tool. Eye-tracking data developed in the Matlab environment are
                        tested on real datasets from an experimental study of OMS.

      1 Introduction                                                          − The interaction of mental states and cognitive
                                                                              processes during the educational activities of students, an
      The study of human eye movements and the trajectory of                  objective assessment of their cognitive development
      their movement allows us to reveal the structure of the                 level, assessment of the effectiveness of training to
      relationship of an individual with the environment, a                   improve mental processes and for psychological
      person with the world. Knowledge about eye movement                     correction of personality [16].
      is of great theoretical and applied importance, expanding               − Extension of the individual's creative life due to the
      the possibilities of studying the specifics of many                     early diagnosis of degenerative processes of cognitive
      professions in order to improve the efficiency of the                   functions of the brain. Identification of a gifted
      subject of labor activity [1-4].                                        personality (building a psychological model of the
          The process of mastering knowledge is a central part                personality) and evaluation of its abilities. Professional
      of the learning process. Managing this process implies                  selection (the identification and education of leaders) [9].
      the existence of effective objective indicators for                     − The assimilation of scientific knowledge and their
      assessing an individual’s intellectual abilities. The                   respective skills serves as the main goal and the main
      methods of psychological identification of an individual                result of educational activities. The process of mastering
      proposed in the project based on obtaining experimental                 knowledge is the central part of the learning process.
      data using the innovative Eye-tracking technology and                   Managing this process implies the existence of effective
      computing means of processing them allow monitoring                     objective indicators for assessing an individual’s
      and diagnostics of the state of cognitive processes during              intellectual abilities [7].
      the educational activities of students [5-9].                               The methods of psychological identification of an
          The aim of this work is to develop instrumental                     individual proposed in the project, based on obtaining
      software tools for constructing a nonparametric                         experimental data using eye tracking technology and
      dynamical model of the OMS human, taking into                           computing means of processing them, allow monitoring
      account its inertial and nonlinear properties, based on                 and diagnostics of the state of cognitive processes during
      data from experimental input-output studies using test                  the educational activities of students.
      visual stimulus and innovative eye-tracking technology;
      implementation of the received information models in
      practice diagnostics of states cognitive processes.                     1.2 Diagnostics neuronal processes
                                                                              An intelligent information technology for diagnosing the
      1.1 The scope of application                                            states of neural processes based on nonparametric
                                                                              identification of OMS in the form of nonlinear dynamic
      The developed software enables support of the following                 Volterra models is proposed [17, 18]. The technology
      tasks:                                                                  involves a consistent solution of the following tasks:
      − The relationship study of mental states and cognitive                 − Identification of the OMS. The goal is to obtain an
      processes in educational activities, a post-traumatic                   OMS information model in the form of MTF. Stages of
      stress disorder, the diagnosis of the Parkinson's and                   implementation: the supply of test signals to the inputs of
      Alzheimer’s       disease       stage,    checking      the             the OMS (horizontally, vertically, diagonally);
      psychophysiological state of pilots and drivers, the                    measurement of OMS responses to test signals with the
      professional suitability, the fatigue syndrome [10-16].

         *
             e-mail: pavlenko_vitalij@mail.ru
© The Authors, published by EDP Sciences. This is an open access article distributed under the terms of the Creative Commons Attribution License 4.0
(http://creativecommons.org/licenses/by/4.0/).
EPJ Web of Conferences 248, 01009 (2021) https://doi.org/10.1051/epjconf/202124801009
MNPS-2020
help of an eye-tracker; MTF calculation based on input- sections of the transient functions of the second and third
output experiment data. orders h2 [m, m], h3 [m, m, m], respectively [19-22]:
− Building a diagnostic model of OMS. The goal – the
formation of the feature space. Stages of implementation: m
MTF compression; determination of the diagnostic value y1[m] = h1[m] = ∑ w1[m − k1 ],
of symptoms; selection of the optimal system of signs – k1 =0
reduction of the diagnostic model. m m
− Building a classifier of the psycho-physiological state y 2 [m] = h2 [m, m] = ∑ ∑ w2 [m − k1 , m − k 2 ], (2)
k1 =0 k 2 =0
of the individual based on the OMS model. The goal is to
build a family of decision rules for optimal m m m
classification. Stages of implementation: building y3 [m] = h2 [m, m, m] = ∑ ∑ ∑ w3 [m − k1 , m − k 2 , m − k 3 ].
k1 =0 k 2 =0 k3 =0
decision rules based on OMS identification results –
training; assessment of the accuracy of the classification
Determination of subdiagonal intersections of
– the exam; optimization of the diagnostic model.
transient functions is based on the NDS test using L test
− Diagnostics psycho-physiological state of the
step signals with given amplitudes a i , i=1,2,…,L (L>=N,
personality. The goal is to assess the condition of the
N is the degree of the Volterra polynomial). In this case
individual. Stages of implementation: OMS
the responses of the NDS are denoted by y 1 [m], y 2 [m],
identification; evaluation of diagnostic signs;
…, y L [m]. Reviews of the Volterra model will be view
classification – the assignment of the investigated
individual to a particular class. ~
y i [m] = ai yˆ 1 [m] + ai2 yˆ 2 [m] + ai3 yˆ 3 [m], i = 1, L , (3)
2 Approximation Volterra model of the where yˆ1[m] = hˆ1[m], yˆ 2 [m] = hˆ2 [m, m], yˆ 3 [m] = hˆ3 [m, m, m] –
nonlinear dynamical system
obtained estimates of the partial components of the
The input-output ratio for a nonlinear dynamical system model – multidimensional transition functions.
(NDS) with an unknown structure (such as a "black To determine the transition functions
box") with a single input and a single output can be h1[m], h2 [m, m], h3[m, m, m] is used the method of least
represented by a discrete cubic Volterra polynomial in squares (LSM), which provides the minimum standard
the form [17]: error of the deviation of the model responses from the
3 m responses of the OMS to the same stimulus:
y[m] = ∑ yn [m] = ∑ w1[k1 ]x[m − k1 ] + 2
n =1 k1 = 0 L
N
J N = ∑ y j [m] − ∑ a nj yˆ n [m] → min . (4)
j =1
m m
+ ∑ ∑ w2 [k1 , k 2 ]x[m − k1 ]x[m − k 2 ] + (1) n =1
k1 = 0 k 2 = 0
The minimization of criterion (4) is reduced to
m m m
+ ∑ ∑ ∑ w3[k1 , k 2 , k3 ]x[m − k1 ]x[m − k 2 ]x[m − k3 ], solving a system of normal Gaussian equations, which in
k1 = 0 k 2 = 0 k3 = 0 vector-matrix form can be written as
where w 1 [k 1 ], w 2 [k 1 ,k 2 ], w 3 [k 1 ,k 2 ,k 3 ] – discrete weight A′Aŷ = A′ y , (5)
functions (Volterra kernels) of the 1st, 2nd and 3rd
orders; х[m], y[m] – input (stimulus) and output where A = α ij , α ij = aij , i, j = 1, N .
(response) function (signals) of the system, respectively;
y n [m] – partial components of the response (convolution
of n-th order sequences); m is a discrete time variable. 3 Computing of transient functions
The problem of identification is to choice test signals OMS
x[m] and develop an algorithm that allows based on the Information technology of the constructing a
responses received y[m] to identify partial components nonparametric dynamic model of the human OMS taking
y n [m], (n = 1, 2, 3) and determine on their basis into account its inertial and nonlinear properties based on
multidimensional Volterra kernels: w 1 [k 1 ], w 2 [k 1 ,k 2 ], the data of experimental studies input-output was
w 3 [k 1 ,k 2 ,k 3 ] [18]. developed. As a basic OMS model – the Volterra model
Taking into account the specifics of the studied is used in the form of multidimensional transition
OMS, test step signals are used for identification. If the functions.
test signal x[m]=θ[m], where θ[m] is a unit function Methods and tools for the identification of OMS have
(Heaviside function), then the partial components of the been developed using the help of eye tracking
response y 1 [m], y 2 [m], y 3 [m] will be equal to the technology, and building a features space and optimal
classification human states using machine learning. In
transient function of the first order h1[m] and diagonal
the Laboratory of Motion Analysis and Interface
2EPJ Web of Conferences 248, 01009 (2021) https://doi.org/10.1051/epjconf/202124801009
MNPS-2020
Ergonomics at the Lublin University of Technology The obtained results of measurements of the OMS
(Lublin, Poland), joint studies of the human OMS were responses at L=3 obtained with using the Tobii TX300
performed to obtain diagnostic information for solving eye tracker in one study cycle ("Horizontally") are
urgent problems in the neuro informatics and the shown in Figure 1. Transient process in the OMS
computational neuroscience. Experimental research was response to the test signal a 1 = 0.33 are illustrated on
carried out using eye tracking technology with the use of Figure 2.
the video based Tobii TX300 (300 Hz sampling rate) eye
tracker and appropriate software [16].
The following instrumental algorithmic and software 4 Results
tools are developed to achieve the goal of the research: The experiments were organized in order to classify
− Formation of test signals in the form of bright dots on subjects by the state of fatigue. The data for constructing
the computer monitor screen at different distances from the model – the OMS responses to the same test signals,
the initial position horizontally, vertically and were obtained using the Tobii Pro TX300 eye tracker at
diagonally. different times of the day: "In the Morning" (before
− Preprocessing (bringing the OMS responses to a work) and "In the Evening" (after work). The average
common start and rationing to one) and analyzing the values of the OMS responses obtained from the eye
data obtained from the eye tracker. tracker at various amplitudes of the test signals "In the
− Constructing an identification model of OMS in the Morning" and "In the Evening" are shown in Figure 3.
form of multidimensional transitional functions (integral
transformations of Volterra kernels).
− Visualization of data and processing results of
experimental research.
3.1 Experimental research of the OMS
When conducting experimental studies, such actions are
carried out:
− The test subject is placed in front of the computer so
that his eyes are at the center of the monitor at a distance
of 40-50 cm from him.
− The subject’s head is fixed in order to prevent its
movements during the study and to ensure the same
experimental conditions.
− On the subject’s readiness, the Signal Manager of the
Fig. 1. OMS responses at L=3 obtained using the Tobii TX300
test visual stimulus program is launched. eye tracker
− A red circle appears in the center (or from its edge) –
of the screen in the starting position.
− After a short pause (2-3 sec.), the circle in the
starting position disappears and a circle of a different
color appears at the point with the specified coordinates
– a visual stimulus (test signal), which is displayed in
this position for a specified duration (1-2 sec.) – the
action makes the eye move in the direction of the visual
stimulus.
− Then this stimulus circle disappears and a red circle
appears in the starting position – this makes the eye
move in the opposite direction to the starting position,
after these actions the experiment ends.
− Using the eye tracker, the coordinates of the pupil of
the eye are determined during its movement (reaction to
the visual stimulus) in the period between the starting
positions and the coordinate values are stored in the xls-
Fig. 2. Transition process in the OMS response to the test
file. signal: a 1 = 0.33
In the studies of each respondent, three experiments
were successively implemented for three amplitudes of
test signals in the horizontal direction. The distance
between the starting position and the test incentives is
equal to: 0.33 l x , 0.66 l x , 1.0 l x , where l x is the length of
the monitor screen. Coordinates of the starting position
(x = 0, y = 0.5 l y ), l y – mean the width of the monitor
screen.
3EPJ Web of Conferences 248, 01009 (2021) https://doi.org/10.1051/epjconf/202124801009
MNPS-2020
Fig. 3. Averaged OMS responses at various amplitudes of test Fig, 5. Responses of the OMS and the model at N = 3 at
signals "In the Morning" and "In the Evening" various amplitudes of the test signals "In the Morning"
According to averaged data of OMS responses on
visual stimuli with a different distance from the start 4.1 Deviation of the transient functions
position on the basis of formula (5) the functions of the
OMS were defined when approximation models of The variability (deviation) of the MTF of different orders
degrees N = 3 were used. Graphs of the transition n of the approximation model of OMS for the states of
functions estimates for the "In the Morning" and "In the the respondent "In the Morning" and "In the Evening" is
Evening" states of the subject based on model (1) are quantified using the indicator of ε nN – normalized
shown in Figure 4. standard deviation (6). The indicators deviation of the
MTF of different orders n of the OMS approximation
model for respondent states "In the Morning" and "In the
Evening" are given in Table 1 and are represented by
diagram in Figure 7.
1/ 2
M
∑ ( yˆ ne [m] − yˆ nm [m]) 2
ε nN = m=0 M , n = 1, N . (6)
∑
m=0
( yˆ nm [m]) 2
Fig. 4. Transition function estimates of the 1st, 2nd, and 3rd
orders (N = 3) for states of the test subject "In the Morning"
and "In the Evening"
Received responses with the help of calculations on
models at N = 3 from various amplitudes of test signals
"In the Morning". Graphs these are presented in
comparison with similar responses OMS in Figure 5.
Graphs of responses of the model OMS at N = 3 at
various amplitudes of the test signals "In the Morning"
and “In the Evening” are illustrated in Figure 6.
Fig. 6. The responses of the model at N = 3 at various
amplitudes of the test signals "In the Morning" and "In the
Evening"
4EPJ Web of Conferences 248, 01009 (2021) https://doi.org/10.1051/epjconf/202124801009
MNPS-2020
Table 1. The deviation indicators of multidimensional transient inverse to S i , |S i | – matrix determinant S i , λ max –
functions classification threshold that provides the highest criterion
probability of the correct recognition of objects in the
N ε1N ε2N ε3N
training sample.
1 0.019 – –
The analysis of the quality of the combination of
2 0.051 0.232 –
various features on base of the criterion probability of
3 0.04 0.199 0.322
the correct recognition (P) is made. Quality of selected
features combination from considered features set is
evaluated by the result of classification on examination
sample of data. A Bayesian classifier of a person's
fatigue state in the space of featurs x 1 and x 2 :
x1 = arg max h1' (t ), x2 = arg min h1' (t ) . (8)
t t
The estimation of the indicator of recognition
reliability is P = 0,9375.
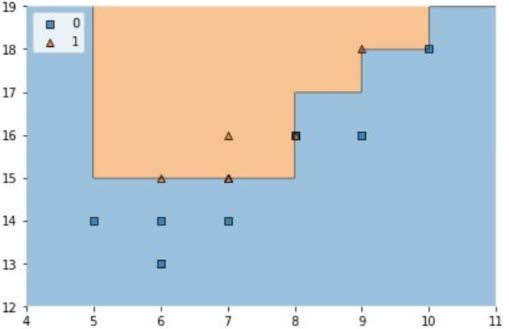
The classification of this data by the support vector
method (SVM) [26] with a quadratic separating function
in the space of features x 1 and x 2 gives the same value of
the probability of correct recognition (P = 0,9375). The
location of the objects of the training set in the space of
features x 1 and x 2 is shown in Figure 8.
Fig. 7. Diagram of deviations indicators ε nN
As can be seen from figure 5, the obtained transition
function of the 1st order for the "In the Morning" and "In
the Evening" are virtually independent of the status of
the subject. However, the diagonal cross section of the
transition functions of the second and third order change
significantly in magnitude and, therefore, can be
effectively used as the primary data source when
building models of classifiers of psychophysiological
conditions of the person using machine learning
4.2 Building a classifier of the fatigue
For estimate psycho-physiological state of the individual Fig. 8. The location of the objects of the training set in the
based on the OMS model conducted researchers: space of features x 1 and x 2
− Building a feature space for designing the status
classifier of a human using machine learning.
− Classifiers construction using deterministic and 5 Conclusions
statistical methods of learning the pattern recognition
Method and software have been developed for
based on the data obtained using eye tracking
constructing a nonparametric dynamical model of the
technology.
OMS human, taking into account its inertial and
On base of training sets of data for an object’s classes
nonlinear properties, based on experimental input-output
A ("In the Morning"), B ("In the Evening") there
data using test visual stimuli and innovative eye-tracking
successively calculate discriminant function d(x). To
technology. A nonlinear dynamic model in the form of a
separate the two classes (dichotomy case) it uses
Volterra polynomial was used. The developed model
discriminant function [23-25] of the form:
was tested on real datasets from an experimental study
1 of OMS.
d (x) = x ′(S −21 − S 1−1 )x + (S 1−1m 1 − S 2−1m 2 ) ′x + Test visual stimulus in the form of bright points that
2 (7) are consistently displayed at different distances from the
1 | S2 | starting position are used. This formally corresponds to
+ (m 1′ S 1 m 1 − m ′2 S 2 m 2 + ln
−1 −1
) + λ max the different amplitudes of the step test signals. The
2 | S1 |
transition functions of the 1st, 2nd, and 3rd orders are
where x=(x 1 ,x 2 ,…,x n )' – features combination, n – determined using LSM.
features space dimensionality, m i – mathematical The developed software tools for data processing of
expectation vector for a features of class i, i=1, 2; the eye-tracking are tested on real data from an
S i =M[(x-m i )(x-m i )'] – covariance matrix for class i (M[] experimental study of the OMS. Verification of the
constructed model confirms the adequacy model of the
– mathematical expectation operation), S i−1 – matrix
5EPJ Web of Conferences 248, 01009 (2021) https://doi.org/10.1051/epjconf/202124801009
MNPS-2020
investigated OMS – a practical coincidence (within an 21. V. Pavlenko, D. Salata, H. Chaikovskyi, Int. J. of
acceptable error) of the responses of the OMS and its Biology and Biomedical Engineering, 11 (2017)
model at the same test signal. 22. A. Fomin, M. Masri, V. Pavlenko, A. Fedorova,
The revealed variability of the transition functions of Eastern Eur. J. of Enterprise Technologies, 2/9(74)
the 2nd and 3rd orders for different psychophysiological (2015)
states of the respondent (level of fatigue) has observed. 23. О. Fomin, V. Pavlenko, MMAR-2015
Thus, they can be used in diagnostic studies in the field (Międzyzdroje, Poland) (Publisher IEEE, 2015)
of the neuroscience and psychology. 24. A. Medvedev, O. Fomin, V. Pavlenko,
V. Speranskyy, Proc. IDAACS’2017, 2 (Bucharest,
Romania, 2017)
References 25. O. Fomin, A. Medvedev, V. Pavlenko, Proc.
1. Y. Wamain, X. Corveleyn, L. Ott, Y. Coello, IDAACS’2015 (Warsaw, Poland, 2015)
Neuropsychologia, 132, 107121 (2019) 26. V. Vapnik, The Nature of Statistical Learning
2. M. Daoudi, M. Coello, P. Desrosiers, L. Ott, Proc. Theory (Springer-Verlag New York Inc., 2010)
FG 2018 (Xi'an, China, 2018)
3. F. Quesque, A.Mignon, Y. Coello, Consciousness
and Cognition (2017)
4. L.S. Lanata, F.Di Gruttola, S.Di Modica,
E.P. Scilingoб A. Greco1, Frontiers in Neuroscience,
13, 1431 (2020)
5. N. Gueugneau, L. Crognier, C. Papaxanthis, Brain
Research, 1187 (2008)
6. A. Guillot, C. Collet, Journal of Motor Behaviour, 37
(2005)
7. A. Guillot, C. Collet, Int. Review of Sport and
Exercise Psychology, 1 (2008)
8. A. Guillot, C. Collet, V.A. Nguyen, F. Malouin, C.
Richards, J. Doyon, Neuroimage, 41 (2008)
9. A. Guillot, M. Louis, C. Collet, In A. Guillot,
C. Collet (Eds), The neurophysiological foundations
of mental and motor imagery (Oxford University
Press, 2010)
10. M. El Haj, Y. Coello, D. Kapogiannis, K. Gallouj,
P. Antoine, J. of Alzheimer's Disease, 61(2) (2018)
11. X. Corveleyn, J. Blampain, L. Ott, I. Lavenu,
C. Delayen, A.Di Pastena, Y. Coello, Current
Alzheimer Research, 15(3) (2018)
12. D. Jansson, A. Medvedev, H Axelson, D. Nyholm,
Advances in Experimental Medicine and Biology,
823 (2015)
13. D. Jansson, O. Rosén, A. Medvedev, IEEE Trans.
control system technology, 23 (2015)
14. V. Bro, A. Medvedev, IEEE 56th Annual Conference
on Decision and Control (Melbourne) (2017)
15. I. Rigas, O. Komogortsev, R. Shadmehr, ACM
Trans. on Applied Perception, 13(2) (2016)
16. V.D. Pavlenko, M. Milosz, M. Dzienkowski, J. of
Physics: Conference Series, 1603 (IOP Publishing,
2020)
17. F.J. Doyle, R.K. Pearson, B.A. Ogunnaike,
Identification and control using Volterra models
(Springer Publ, 2002)
18. V. Pavlenko, S. Pavlenko, V. Speranskyy,
In.V. Haasz, K.. Madani (Eds.), Advanced Data
Acquisition and Intelligent Data Processing (River
Publishers, 2014)
19. V. Pavlenko, D. Salata, M. Dombrovskyi,
Y. Maksymenko, AIP Conf. Proc., 1872 (2017)
20. V. Pavlenko, I. Ivanov, E. Kravchenko, Proc.
IDAACS’2017, 2 (Bucharest, Romania, 2017)
6You can also read