Forecasting electricity consumption of Malaysia's residential sector: Evidence from an exponential smoothing model version 1; peer review: ...
←
→
Page content transcription
If your browser does not render page correctly, please read the page content below
F1000Research 2022, 11:54 Last updated: 07 JUN 2022

RESEARCH ARTICLE

Forecasting electricity consumption of Malaysia’s residential
sector: Evidence from an exponential smoothing model
[version 1; peer review: awaiting peer review]
Izzaamirah Ishak              1,   Nor Salwati Othman                2,   Nor Hamisham Harun2
1College of Energy Economics and Social Sciences, Universiti Tenaga Nasional, Putrajaya Campus, Selangor, 43000, Malaysia
2College of Business and Accounting, Universiti Tenaga Nasional, Muadzam Shah, Pahang, 26700, Malaysia

v1   First published: 17 Jan 2022, 11:54                                        Open Peer Review
     https://doi.org/10.12688/f1000research.74877.1
     Latest published: 17 Jan 2022, 11:54
     https://doi.org/10.12688/f1000research.74877.1                             Approval Status AWAITING PEER REVIEW

                                                                                Any reports and responses or comments on the

Abstract                                                                        article can be found at the end of the article.
Background: In Malaysia, residential electricity consumption has
shown a steady upward trend year by year. Due to this increase in
energy consumption, it is important to forecast the value of electricity
consumption until the year 2032 to accommodate the electricity
demand.
Methods: Three exponential smoothing models were compared to
identify the most appropriate model in forecasting electricity
consumption. The three exponential smoothing models are Simple,
Holt, and Brown exponential smoothing. To identify the most
appropriate model, a mean absolute percentage (MAPE) was chosen.
Results: The results show that Holt’s exponential smoothing has the
best performance with the lowest MAPE score of 2.299.
Conclusions: Consequently, it was found that electricity consumption
would substantially increase from 2647 ktoe (kilotonne of oil
equivalent) to 3873 ktoe within the period of 2019 to 2032.

Keywords
forecasting, electricity consumption, exponential smoothing, time
series

                This article is included in the IIARP Publications
                gateway.

                This article is included in the Energy gateway.

                                                                                                                          Page 1 of 12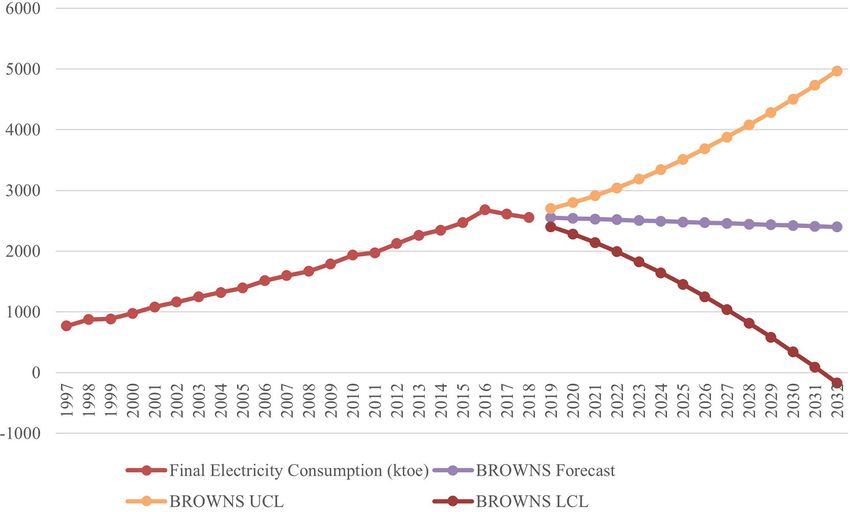
F1000Research 2022, 11:54 Last updated: 07 JUN 2022

Corresponding author: Izzaamirah Ishak (izza@uniten.edu.my)
Author roles: Ishak I: Conceptualization, Formal Analysis, Investigation, Methodology, Resources, Software, Visualization, Writing –
Original Draft Preparation; Othman NS: Data Curation, Project Administration, Validation, Writing – Review & Editing; Harun NH: Data
Curation, Project Administration, Supervision, Writing – Review & Editing
Competing interests: No competing interests were disclosed.
Grant information: This study was funded by TNB Seed Fund 2020 (U-TR-RD-20-01). We would like to thank UNITEN R&D for the
financial support of this project entitled Domestic Electricity Demand Model for TNB Regulation Strategy.
Copyright: © 2022 Ishak I et al. This is an open access article distributed under the terms of the Creative Commons Attribution License,
which permits unrestricted use, distribution, and reproduction in any medium, provided the original work is properly cited.
How to cite this article: Ishak I, Othman NS and Harun NH. Forecasting electricity consumption of Malaysia’s residential sector:
Evidence from an exponential smoothing model [version 1; peer review: awaiting peer review] F1000Research 2022, 11:54
https://doi.org/10.12688/f1000research.74877.1
First published: 17 Jan 2022, 11:54 https://doi.org/10.12688/f1000research.74877.1

                                                                                                                                Page 2 of 12
F1000Research 2022, 11:54 Last updated: 07 JUN 2022

Introduction
In Malaysia, energy is no longer viewed as a luxury as it is becoming a necessity in our everyday activities such as
in transportation, production, commercial activities, and residential anthropogenic activities.1 Energy consumption in
residential sectors grew up to 7% within the period 1978 to 2015.2 As one of the countries with the highest recorded
energy per capita and energy intensity over the years, electricity is considered as an important form of energy which drives
Malaysia’s economic development.3,4 The Malaysia Energy Information Hub (MEIH) revealed that electricity con-
sumption for the residential sector in 2018 was 2553 ktoe (kilotonne of oil equivalent), which is a slight decrease from
2017 with 2610 ktoe. However, in 2017 the World Energy Markets Observatory (WEMO) reported that electricity
consumption is projected to increase by 4.8% annually up to 2030.

Thus, it is important to conduct a forecast of electricity consumption as it is significant for economic development as
well as policy improvement.5,6 As a reliable and an important tool for making decisions, there are several forecasting
techniques that can be used. In fact, the accuracy of forecasting can be observed to obtain significant results in the
projection of electricity consumption.5 In this study, three different exponential smoothing models were utilised to
forecast electricity consumption: simple, Holt, and Brown’s exponential smoothing.

This aim of this research was to conduct a study in order to forecast electricity consumption in Malaysia until the year
2032. This research also attempts to identify the most appropriate exponential smoothing model in forecasting electricity
consumption.

Literature review
Lee et al.,7 conducted a study involving six different forecasting methods, which were used to predict electricity
consumption in Universiti Tun Hussein Onn Malaysia (UTHM), Malaysia. The study selected a mean absolute
percentage error (MAPE) as the measurement of error. Historical data were obtained monthly from 2011 until 2017
which generated a projection up until December 2018. From the six forecasting models, Holt-Winters’ exponential
smoothing was found to be the best technique implemented due to having the lowest MAPE. Similarly, Nazim and
Afthanorhan8 also found that Holt’s exponential smoothing was the best method to predict Malaysia’s population from
2004 to 2020. The study selected a mean square error (MSE) as a criterion to determine the best model. There were four
different techniques used which were single exponential smoothing (SES), double exponential smoothing (DES), Holt’s
exponential smoothing, and adaptive response rate exponential smoothing (ARRES). Lima et al.,9 claimed that economic
data could be forecasted using Holt-Winters’ exponential smoothing, which involves comparing additive and multipli-
cative practices. The results showed that multiplicative exhibited the best forecasting performance. Maçaira et al.,10
forecasted the best yearly projection for residential electricity consumption in Brazil by applying exponential smoothing.
All the studies mentioned above provided economic projection values together with consumption growth and were
validated by the accuracy of the forecast.

In contrast, Popeanga and Lungu11 found that the double moving average was the best technique in forecasting energy
consumption in Romania from quarter one until quarter four of 2014. The study used two different moving average
practices. Suresh12 used an autoregressive integrated moving average model (ARIMA) to analyse and forecast electricity
consumption in India. The proposed ARIMA with the neural network (NN) model provided the best future time-series
forecasting. A data set of 40 years of electricity consumption was analysed by Mahia et al.,13 using ARIMA methods.
Several steps were conducted, and the best model was selected based on the lowest Akaike Information Criterion (AIC).
Notably, the literature has specific reasons to conduct a moving average when the data set performs seasonally,
particularly throughout the study period.

From a business perspective, exponential smoothing is used in projecting sales. For example, Sidqi and Sumitra14 applied
the single and double exponential smoothing in a study with MAPE as the criterion to determine the accuracy of the
forecast model. As a result, the single exponential smoothing exhibited the lowest MAPE. In the agricultural sector,
Talwar and Goyal15 analysed and compared coriander prices in India using several exponential smoothing methods. The
results showed that the Holt-Winters’ trend adjusted model provided the best model with the lowest error measurement in
MSE. A study by Booranawong and Booranawong16 in Thailand showed that the double exponential smoothing method
provided better performance in predicting Thai chilli and lemongrass prices. The study utilised MAPE to determine the
minimum error measurement from other methods such as multiplicative Holt-Winters’ (MHW) and additive Holt-
Winters’ (AHW). The forecasted prices of the agricultural products were from October 2016 to December 2019.
Regardless of the sector, exponential smoothing is very suitable to conduct forecasting together with the least error of
measurement, such as MAPE.

                                                                                                                           Page 3 of 12
F1000Research 2022, 11:54 Last updated: 07 JUN 2022

Based on previous literature, exponential smoothing has been widely used, and this technique captures the time series that
may change its behaviour, and the model parameters should adapt to that change in behaviour as well.17 Currently, studies
that provide exponential smoothing as a mechanism to predict the electricity consumption of the residential sector are
limited. Therefore, this study selected this method as it is considered an appropriate technique to conduct a forecasting of
the residential electricity consumption in Malaysia.

Methods
Three exponential smoothing models were used to forecast electricity consumption in this study: simple exponential
smoothing, Holt’s exponential smoothing, and Brown’s exponential smoothing. Yearly data from 1997 to 2018 was
obtained from the Malaysia Energy Information Hub (MEIH). The forecasting period started from the year 2019 until
2032. Details on the function and formula of the simple exponential smoothing, Holt’s exponential smoothing, and
Brown’s exponential smoothing are explained in the following sections.

Simple exponential smoothing
Simple exponential smoothing is the most widely used model in forecasting if there are no cyclic variation patterns or
consistent growing patterns involved.14 The formula for this method is as follows18:

                                                  F tþm ¼ αyt þ ð1  αÞF t                                              (1)

where:

F tþm : simple exponentially forecast value in period m, for m ¼ 1,2, 3,…t; yt : actual value in time t;

α: unknown smoothing constant to be determined for value between 0 and 1;

F t : forecast value at period t.

Holt’s exponential smoothing
Holt’s exponential smoothing can be used in forecasting when there is a linear trend in the historical data of the forecast.
According to Alias,19 this method requires three equations which are exponential smoothed series, trend estimate, and
forecast.

Exponential smoothed series:

                                             St ¼ αyt þ ð1  αÞðSt1 þ T t1 Þ                                          (2)

Trend estimate:

                                             T t ¼ βðSt  St1 Þ þ ð1  βÞT t1                                         (3)

Forecast for m period:

                                                    F tþm ¼ St þ T t  m                                                (4)

where:

St : exponential smoothed series;

T t : trend estimates;

F tþm : forecast for m-step-ahead period.

Brown’s exponential smoothing
This method is also known as the double exponential smoothing and can be used if there is a linear trend in the data.
The trend is a smoothed estimate of average growth at the end of each period.17 The formula for Brown’s exponential
smoothing is as follows:

                                                  F tþm ¼ αyt þ ð1  αÞF t                                              (5)

                                                                                                                           Page 4 of 12
F1000Research 2022, 11:54 Last updated: 07 JUN 2022

                                                         at ¼ 2St  St 0                                                   (6)

                                                              α
                                                      bt ¼       ðSt  St 0 Þ                                              (7)
                                                             1α

                                                     St ¼ αyt þ ð1  αÞSt1                                                (8)

                                                   S0t ¼ αSt þ ð1  αÞS0 t1                                               (9)

where:

St : exponentially smoothed value of yt at time t;

S0t : double exponentially smoothed value of yt at time t;

at : computes the difference between the exponentially smoothed values;

bt : computes the adjustment factor;

F tþm : forecast for m-step-ahead period.

Accuracy of forecast
According to Kalekar,17 the forecasting model should be validated. Here, an error measurement such as mean absolute
percentage error (MAPE), relative mean square error (RMSE), or mean absolute error (MAE) is needed. The selection of
an error measurement has a significant effect in determining the most accurate forecasting method. In this study, MAPE
was selected to verify the model because it is the most suitable measurement to compare the accuracy of the forecasting
methods, as it measures relative performance.7,14,20 A low MAPE score indicates that the forecasting model has a good
performance.21 The range of the MAPE score is shown in Table 1.

Results
An analysis of the historical data was conducted to examine the pattern of electricity consumption trend (kilotonne of oil
equivalent, ktoe) from 1997 until 2018 for the residential sector in Malaysia.

Based on Figure 1, the trend pattern in this time series is linear and no seasonality is involved. In addition, the graph shows
a constant increase in the pattern. In 2016, a total of 2679 ktoe of electricity was consumed as the highest value. The
consumption value gradually decreased from 2017 to 2018 with values of 2610 ktoe and 2553 ktoe respectively as shown
in Table 2. Thus, all three exponential smoothing methods, namely simple, Holt’s and Brown exponential smoothing
were capable of forecasting electricity consumption. The lowest MAPE was compared to identify the most appropriate
exponential smoothing model.

Simple exponential smoothing
The simple exponential smoothing was analysed using SPSS version 26 (IBM SPSS Statistics, RRID:SCR_019096)
starting from the year 2019. Referring to Figure 2, the three lines represent the limit of the forecast values for the forecast
year: yellow indicates the upper limit of electricity consumption, purple indicates the best prediction of electricity
consumption, and brown indicates the lower limit of electricity consumption at a particular year. This means that the
expected electricity consumption could fall between the green and brown dotted lines.

Table 1. Significance of MAPE score.

 MAPE                                                           Significance
 50%                                                           Bad forecasting ability

                                                                                                                              Page 5 of 12
F1000Research 2022, 11:54 Last updated: 07 JUN 2022
Figure 1. Electricity consumption (ktoe) residential increases over time. (Source: Malaysia Energy Information
Hub, https://meih.st.gov.my/statistics.)
Table 2. Electricity consumption (ktoe) residential increases over time.
Year Final electricity consumption (ktoe)
Residential
1997 770
1998 874
1999 885
2000 975
2001 1,081
2002 1,161
2003 1,248
2004 1,319
2005 1,395
2006 1,514
2007 1,598
2008 1,668
2009 1,792
2010 1,937
2011 1,974
2012 2,126
2013 2,262
2014 2,346
2015 2,471
2016 2,679
2017 2,610
2018 2,553
Page 6 of 12F1000Research 2022, 11:54 Last updated: 07 JUN 2022
Figure 2. Simple exponential smoothing. UCL: upper confidence level (upper limit); LCL: lower confidence level
(lower limit).
Based on Table 3, the year 2019 recorded the best forecasted electricity consumption, which is 2553 ktoe; the
consumption maintains this value until 2032. However, this method also predicted a wide range of possible values until
2032. For example, the electricity consumption in 2032 is predicted to be between 3345 ktoe as the upper limit and 1760
ktoe as the lower limit, but the best value generated is 2553 ktoe.
Table 3. Forecasting result: simple exponential smoothing.
Year Forecast value (ktoe) Upper limit (ktoe) Lower limit (ktoe)
2019 2553 2773 2333
2020 2553 2864 2242
2021 2553 2934 2172
2022 2553 2993 2113
2023 2553 3044 2062
2024 2553 3091 2015
2025 2553 3134 1972
2026 2553 3175 1931
2027 2553 3212 1894
2028 2553 3248 1858
2029 2553 3282 1824
2030 2553 3314 1792
2031 2553 3345 1761
2032 2553 3345 1761
Table 4. Model fit statistics for simple exponential smoothing.
Error measurement Score
RMSE 105.677
MAPE 5.678
MAE 92.504
Page 7 of 12F1000Research 2022, 11:54 Last updated: 07 JUN 2022
The accuracy of the forecasting value was measured via model fit statistics. As shown in Table 4, there are three error
measurement scores generated by SPSS version 26: relative mean square error (RMSE), mean absolute percentage error
(MAPE), and mean absolute error (MAE). For simple exponential MAPE, the score is 5.678.
Holt’s exponential smoothing
Figure 3 shows Holt’s exponential smoothing method, which was conducted. It is expected that the electricity
consumption value would fall between the pink and brown dotted lines for the forecast year, but the width is narrower
compared to the previous method. It can be observed that the forecast has a considerable upward trend from 2019 until
2032.
The value of the best forecasted electricity consumption was 2647 ktoe for 2019 and 3873 ktoe for 2032 as shown
in Table 5. In 2032, the predicted electricity consumption value would be between 3360 and 4386 ktoe whereas the
Figure 3. Holt's exponential smoothing. UCL: upper confidence level (upper limit); LCL lower confidence level
(lower limit).
Table 5. Forecasting result: Holt’s exponential smoothing.
Year Forecast value (ktoe) Upper limit (ktoe) Lower limit (ktoe)
2019 2647 2783 2511
2020 2742 2934 2549
2021 2836 3072 2600
2022 2930 3203 2658
2023 3024 3329 2720
2024 3119 3453 2785
2025 3213 3574 2852
2026 3307 3694 2921
2027 3402 3812 2992
2028 3496 3929 3063
2029 3590 4044 3136
2030 3685 4159 3210
2031 3779 4273 3285
2032 3873 4386 3360
Page 8 of 12F1000Research 2022, 11:54 Last updated: 07 JUN 2022
Table 6. Model fit statistics for Holt’s exponential smoothing.
Error measurement Score
RMSE 65.235
MAPE 2.299
MAE 42.664
Figure 4. Brown’s exponential smoothing. UCL: upper confidence level (upper limit); LCL: lower confidence level
(lower limit).
best projected value is 3873 ktoe. Table 6 shows the accuracy of the forecasting where the score measured by MAPE is
2.299.
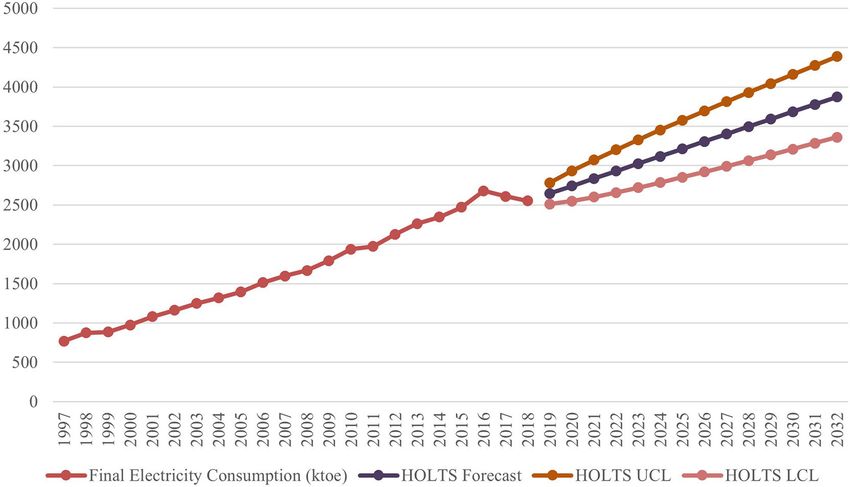
Brown’s exponential smoothing
The last forecasting method is Brown’s exponential smoothing (Figure 4). This method enjoys a very wide range of
forecasting values where the upper and lower limit values experienced a steep trend. In 2019, the forecasted electricity
consumption value is 2402 ktoe. However, the value gradually decreases year by year until 2032 with a consumption
value of 2399 ktoe as presented in Table 7. In 2032, the predicted electricity consumption value would be within 4967
ktoe as the maximum value and 90 ktoe as the minimum value; the best projected value is 2399 ktoe. Table 8 shows the
MAPE score for Brown’s exponential smoothing, which is 3.125. The lower the MAPE score, the higher the accuracy of
the forecast.
Discussion
Table 9 shows the summary of all smoothing methods using MAPE as the measurement. Holt’s exponential smoothing is
the most suitable method to predict the electricity consumption of the residential sector in Malaysia. This is because this
method has the lowest MAPE score which is 2.299 compared to the other two methods. The result is consistent with Omer
et al.22 where they used MAPE to identify the most appropriate prediction model. Therefore, in this study, Holt’s
exponential smoothing is the best method to forecast future electricity consumption in Malaysia.
Table 5 lists the forecasting values from 2019 until 2032 generated by Holt’s exponential smoothing. In 2032, the
maximum electricity consumption is 4386 ktoe and the minimum consumption is 3360 ktoe. However, the best predicted
value is 3873 ktoe.
Page 9 of 12F1000Research 2022, 11:54 Last updated: 07 JUN 2022
Table 7. Forecasting result: Brown exponential smoothing.
Year Forecast value (ktoe) Upper limit (ktoe) Lower limit (ktoe)
2019 2553 2702 2403
2020 2541 2799 2282
2021 2529 2914 2144
2022 2517 3043 1991
2023 2505 3187 1824
2024 2494 3343 1645
2025 2482 3511 1453
2026 2470 3690 1251
2027 2458 3879 1038
2028 2447 4079 815
2029 2435 4288 582
2030 2423 4506 341
2031 2411 4733 90
2032 2400 4968 169
Table 8. Model fit statistics for Brown’s exponential smoothing.
Error measurement Score
RMSE 72.041
MAPE 3.125
MAE 51.085
Table 9. Summary of the results of the exponential smoothing models.
Method MAPE
Simple exponential smoothing 5.678
Holt’s exponential smoothing 2.299
Brown exponential smoothing 3.125
Conclusion
The aim of the study was to forecast the total electricity consumption in Malaysia until the year 2032 and to identify the
most appropriate exponential smoothing model to predict this consumption. Based on the results and discussion, Holt’s
exponential smoothing was found to be the most appropriate model in forecasting electricity consumption in Malaysia.
Generally, electricity consumption in residential sectors comes from electrical appliances. Hence, based on the predicted
consumption growth, energy efficiency regulations by electrical manufacturers should be revised. Campaigns for less
energy demand in households should also be implemented. This can benefit both parties by maximising energy efficiency
and minimising electricity consumption. As a suggestion for further study, moving average methods can also be applied
to predict electricity consumption. There are various types of moving average method including the integrated model
such as autoregressive–moving-average (ARMA), autoregressive integrated moving average (ARIMA), autoregressive
integrated moving average- neural network (ARIMA-NN), or the hybrid model. These methods can be used by future
researchers to further expand on this study.
Data availability
All data underlying the results are available as part of the article and no additional source data are required.
Page 10 of 12F1000Research 2022, 11:54 Last updated: 07 JUN 2022
Acknowledgments
This study was funded by TNB Seed Fund 2020 (U-TR-RD-20-01). We would like to thank UNITEN R&D for the
financial support of this project entitled Domestic Electricity Demand Model for TNB Regulation Strategy.
References
1. Bekhet HA, Othman NS: The role of renewable energy to validate 12. Suresh M: Analyzing and Forecasting of Electricity Consumption
dynamic interaction between CO2 emissions and GDP toward by Integration of Autoregressive Integrated Moving Average
sustainable development in Malaysia. Energy Econ. 2018; 72: Model with Neural Network on Smart Meter Data. Turk. J.
47–61. Comput. Math. Educ. 2021; 12(11): 1986–1997.
Publisher Full Text Publisher Full Text
2. Bekhet HA, Harun NH: Determining the dynamic linkages 13. Mahia F, Dey AR, Masud MA, Mahmud MS: Forecasting electricity
between renewable electricity generation and its determinants consumption using ARIMA model. 2019 International Conference
toward sustainable energy in Malaysia. World Review of Science, on Sustainable Technologies for Industry 4.0 (STI). IEEE; 2019,
Technology and Sustainable Development. 2018; 14(4): 295–329. December; pp. 1–6.
Publisher Full Text 14. Sidqi F, Sumitra ID: Forecasting product selling using single
3. Chandran VGR, Sharma S, Madhavan K: Electricity consumption– exponential smoothing and double exponential smoothing
growth nexus: the case of Malaysia. Energy Policy. 2010; 38(1): methods. IOP Conference Series: Materials Science and Engineering.
606–612. IOP Publishing; 2019, November; Vol. 662(No. 3): p. 032031.
Publisher Full Text 15. Talwar A, Goyal CK: A comparative study of various exponential
4. Pusat Tenaga Malaysia: National Energy Balance 2004 Malaysia. smoothing models for forecasting coriander price in Indian
Selangor: Pusat Tenaga Malaysia; 2004. commodity market. International Bulletin of Management and
5. Nguyen VH, Vo CV, Nguyen KT, et al.: Forecast on 2030 Vietnam Economics Volume 2019.
electricity consumption. Engineering, Technology & Applied Science 16. Booranawong T, Booranawong A: Double exponential smoothing
Research. 2018; 8(3): 2869–2874. and Holt-Winters methods with optimal initial values and
Publisher Full Text weighting factors for forecasting lime, Thai chili and
6. Ozoh P, Abd-Rahman S, Labadin J, et al.: A comparative analysis of lemongrass prices in Thailand. Eng. Appl. Sci. Res. 2018; 45(1):
techniques for forecasting electricity consumption. Int. 32–38.
J. Comput. Appl. 2014; 88(15): 8–12. 17. Kalekar PS: Time series forecasting using holt-winters
Publisher Full Text exponential smoothing. Kanwal Rekhi school of information
7. Lee YW, Tay KG, Choy YY: Forecasting electricity consumption Technology. 2004; 4329008(13): 1–13.
using time series model. Int. J. Eng. Technol. 2018; 7(4): 218–223. 18. Muniroh MF, Ismail N, Lazim MA: Combination of forecasts with
Publisher Full Text an application to unemployment rate. Pertanika J. Sci. Technol.
8. Nazim A, Afthanorhan A: A comparison between single 2017.
exponential smoothing (SES), double exponential smoothing 19. Lazim A: Introductory business forecasting: A practical approach.
(DES), holt’s (brown) and adaptive response rate exponential 3rd ed. University Publication Centre (UPENA), UiTM 2005, 2007,
smoothing (ARRES) techniques in forecasting Malaysia 2011. 2011.
population. Glob. J. Math. Anal. 2014; 2(4): 276–280. 20. Lewis CD: Industrial and Business Forecasting Methods. London:
Publisher Full Text Butterworths; 1982.
9. Lima S, Gonçalves AM, Costa M: Time series forecasting using 21. Chang PC, Wang YW, Liu CH: The development of a weighted
Holt-Winters exponential smoothing: An application to evolving fuzzy neural network for PCB sales forecasting.
economic data. AIP Conference Proceedings. AIP Publishing LLC; Expert Syst. Appl. 2007; 32(1): 86–96.
2019, December; Vol. 2186(No. 1): p. 090003. Publisher Full Text
10. Maçaira PM, Souza RC, Oliveira FC: Modelling and forecasting the 22. Omer A, Blbas H, Kadir D: A Comparison between Brown’s
residential electricity consumption in Brazil with pegels and Holt’s Double Exponential Smoothing for Forecasting
exponential smoothing techniques. Procedia Comput. Sci. 2015; Applied Generation Electrical Energies in Kurdistan Region.
55: 328–335. World energy markets observatory (WEMO). A strategic Cihan Univ.-Erbil Sci. J. 2021; 5(2): 56–63.
overview of the global energy markets. 2017,”2017. Publisher Full Text
11. Popeangă J, Lungu I: Forecasting Final Energy Consumption
using the Centered Moving Average Method and Time Series
Analysis. Database Syst. J. 2014; 5(1): 42–50.
Page 11 of 12F1000Research 2022, 11:54 Last updated: 07 JUN 2022
The benefits of publishing with F1000Research:
• Your article is published within days, with no editorial bias
• You can publish traditional articles, null/negative results, case reports, data notes and more
• The peer review process is transparent and collaborative
• Your article is indexed in PubMed after passing peer review
• Dedicated customer support at every stage
For pre-submission enquiries, contact research@f1000.com
Page 12 of 12You can also read