Impacts of Fire Management on Aboveground Tree Carbon Stocks in Yosemite and Sequoia & Kings Canyon National Parks - James A Lutz
←
→
Page content transcription
If your browser does not render page correctly, please read the page content below
National Park Service
U.S. Department of the Interior

Natural Resource Stewardship and Science

Impacts of Fire Management on Aboveground Tree
Carbon Stocks in Yosemite and Sequoia & Kings Canyon
National Parks
Natural Resource Report NPS/SIEN/NRR—2015/910
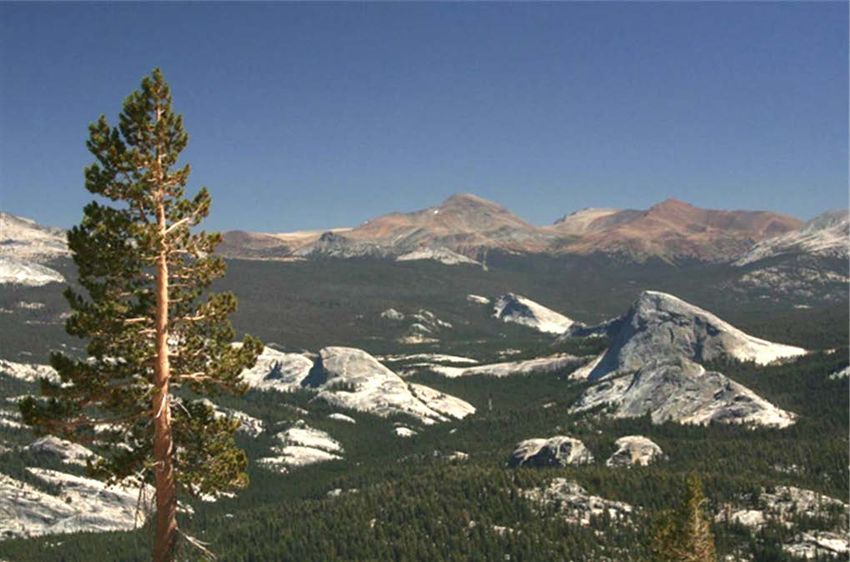
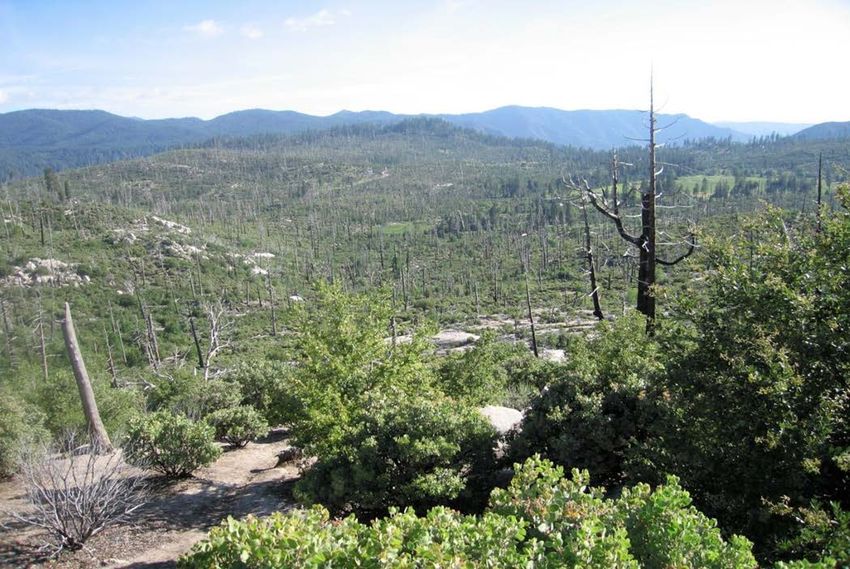
ON THIS PAGE
Photograph of the aftermath of a high severity fire in Yosemite National Park, (Foresta area)
Photograph by Leland Tarnay

ON THE COVER
Photograph of high elevation landscape as seen looking northeast from Mt Hoffman, Yosemite NP
Photograph by Leland Tarnay
Impacts of Fire Management on Aboveground Tree
Carbon Stocks in Yosemite and Sequoia & Kings
Canyon National Parks
Natural Resource Report NPS/SIEN/NRR—2015/910

John R. Matchett1, James A. Lutz2, Leland W. Tarnay3, Douglas G. Smith3, Kendall M.L. Becker2,
and Matthew L. Brooks1

1
 U.S. Geological Survey
Western Ecological Research Center
Yosemite Field Station
40298 Junction Dr, Suite A
Oakhurst, CA 93644

2
 Utah State University
Wildland Resources
5230 Old Main Hill
Logan, UT 84322-5230

3
 National Park Service
Yosemite National Park
5083 Foresta Road
El Portal, CA 95318

January 2015

U.S. Department of the Interior
National Park Service
Natural Resource Stewardship and Science
Fort Collins, Colorado
The National Park Service, Natural Resource Stewardship and Science office in Fort Collins,
Colorado, publishes a range of reports that address natural resource topics. These reports are of
interest and applicability to a broad audience in the National Park Service and others in natural
resource management, including scientists, conservation and environmental constituencies, and the
public.

The Natural Resource Report Series is used to disseminate comprehensive information and analysis
about natural resources and related topics concerning lands managed by the National Park Service.
The series supports the advancement of science, informed decision-making, and the achievement of
the National Park Service mission. The series also provides a forum for presenting more lengthy
results that may not be accepted by publications with page limitations.

All manuscripts in the series receive the appropriate level of peer review to ensure that the
information is scientifically credible, technically accurate, appropriately written for the intended
audience, and designed and published in a professional manner.

This report received formal peer review by subject-matter experts who were not directly involved in
the collection, analysis, or reporting of the data, and whose background and expertise put them on par
technically and scientifically with the authors of the information.

Views, statements, findings, conclusions, recommendations, and data in this report do not necessarily
reflect views and policies of the National Park Service, U.S. Department of the Interior. Mention of
trade names or commercial products does not constitute endorsement or recommendation for use by
the U.S. Government.

This report is available in digital format from Yosemite and Sequoia & Kings Canyon National
Parks, and the Natural Resource Publications Management website
(http://www.nature.nps.gov/publications/nrpm/). To receive this report in a format optimized for
screen readers, please email irma@nps.gov.

Please cite this publication as:

Matchett, J. R., J. A. Lutz, L. W. Tarnay, D. G. Smith, K. M. L. Becker, and M. L. Brooks. 2015.
Impacts of fire management on aboveground tree carbon stocks in Yosemite and Sequoia & Kings
Canyon national parks. Natural Resource Report NPS/SIEN/NRR—2015/910. National Park Service,
Fort Collins, Colorado.

NPS 104/127729, 102/127729, January 2015

                                                    ii
Contents
Page
Figures.................................................................................................................................................... v
Tables .................................................................................................................................................... vi
Appendices ............................................................................................................................................ vi
Abstract ................................................................................................................................................ vii
Introduction ............................................................................................................................................ 1
Methods.................................................................................................................................................. 4
Plot Dataset..................................................................................................................................... 4
Field Data Collection ...................................................................................................................... 4
Allometric Equations ...................................................................................................................... 5
Analyses ......................................................................................................................................... 6
Assigning Forest Types ............................................................................................................. 6
Density and Total Carbon .......................................................................................................... 6
Fire History and Carbon Density ............................................................................................... 8
Carbon Stock Stability ............................................................................................................... 8
Comparison with Another Carbon Accounting Effort .............................................................. 9
Results and Discussion ........................................................................................................................ 10
Error Propagation and Sources of Uncertainty ............................................................................. 10
1. Uncertainty embedded within allometric equations ............................................................ 10
2. Site-specific tree morphology.............................................................................................. 10
3. Lack of equations for large-diameter trees .......................................................................... 10
4. Landscape heterogeneity ..................................................................................................... 10
5. Vegetation type mapping error ............................................................................................ 11
Aboveground Tree Carbon ........................................................................................................... 12
Fire History and Tree Carbon Density ......................................................................................... 15
Yosemite Carbon Stability Using Fire Return Interval Departure ............................................... 16
Comparisons with NASA–CASA Biomass Estimates ................................................................. 18
Potential for Overestimating Losses Due to Fire: the Rim Fire of 2013 ................................. 21
Approach and Scope Limitations ................................................................................................. 21
iiiContents (continued)
Page
Conclusions .......................................................................................................................................... 23
Recommendations for Future Carbon Accounting .............................................................................. 23
Deliverables and Project Completion Plan .......................................................................................... 23
Peer-reviewed manuscripts ...................................................................................................... 24
Presentations ............................................................................................................................ 24
Education and outreach ........................................................................................................... 24
Literature Cited .................................................................................................................................... 26
ivFigures
Page
Figure 1. Comparisons of uncertainties in total carbon estimates for 6 forest types in
Sequoia & Kings Canyon (SEKI) and Yosemite (YOSE) national parks. .......................................... 11
Figure 2. Aboveground tree carbon densities (means and 95% confidence intervals) for
vegetation types in Yosemite (YOSE) and Sequoia & Kings Canyon (SEKI) national
parks. .................................................................................................................................................... 13
Figure 3. Aboveground tree carbon totals (means and 95% confidence intervals) for
vegetation types in Yosemite (YOSE) and Sequoia & Kings Canyon (SEKI) national
parks. .................................................................................................................................................... 14
Figure 4. Distribution of carbon densities for red fir forest plots in Yosemite. Red line is
the simple mean, blue line is the median, and green line is mean of log-transformed
values. .................................................................................................. Error! Bookmark not defined.
Figure 3. Aboveground tree carbon totals (means and 95% confidence intervals) for
vegetation types in Yosemite (YOSE) and Sequoia & Kings Canyon (SEKI) national
parks. .................................................................................................................................................... 16
Figure 6. Aboveground tree carbon stored in forest types at fire regime interval
departures within Yosemite National Park. ......................................................................................... 17
Figure 7. NASA–CASA total carbon estimates versus total aboveground tree carbon
estimates from this study for various vegetation types in Yosemite National Park............................. 18
Figure 8. NASA–CASA aboveground carbon and its relationship to fire history. ............................. 19
Figure 9. Scheme for changes in tree carbon in response to fire severity. .......................................... 20
Figure 10. Total aboveground tree carbon within the Rim Fire footprint within Yosemite
National Park. ...................................................................................................................................... 21
vTables
Page
Table 1. Number of sampling plots located within each vegetation type. ............................................ 4
Table 2. Numbers of newly established plots by park, forest type, and burn history. .......................... 4
Table 3. Tree carbon density and fire history model comparisons...................................................... 15
Appendices
Page
Appendix A. Allometric equations. ................................................................................................... A-1
Appendix B. Community type assignments....................................................................................... B-1
Appendix C. Forest type carbon summaries. ..................................................................................... C-1
viAbstract
Forest biomass on Sierra Nevada landscapes constitutes one of the largest carbon stocks in
California, and its stability is tightly linked to the factors driving fire regimes. Research suggests that
fire suppression, logging, climate change, and present management practices in Sierra Nevada forests
have altered historic patterns of landscape carbon storage, and over a century of fire suppression and
the resulting accumulation in surface fuels have been implicated in contributing to recent increases in
high severity, stand-replacing fires. For over 30 years, fire management at Yosemite (YOSE) and
Sequoia & Kings Canyon (SEKI) national parks has led the nation in restoring fire to park
landscapes; however, the impacts on the stability and magnitude of carbon stocks have not been
thoroughly examined.
The purpose of this study is to quantify relationships between recent fire patterns and aboveground
tree carbon stocks in YOSE and SEKI. Our approach focuses on evaluating fire effects on 1) amounts
of aboveground tree carbon on the landscape, and 2) rates of carbon accumulation by individual
trees. In 2010, we compiled a database of existing plot data for our analyses. In 2011, our field crews
acquired vegetation data and collected tree growth cores from 105 plots. In 2012, we completed an
interpretive component and began data analyses. In 2013, processing of tree cores began. In 2014,
final processing of tree cores, data analyses, and manuscript preparation was conducted. The work
for this project was facilitated through an interagency agreement between the National Park Service
and the U.S. Geological Survey, and through a Cooperative Ecosystems Studies Unit (CESU)
agreement with the University of Washington.
In order to accurately quantify landscape-level carbon stocks, our analyses accounted for major
sources of measurement errors, propagating those errors as we scaled plot-based carbon density
estimates up to landscape-level totals. Using Monte Carlo simulation methods, we found that
vegetation type mapping error was the largest source of uncertainty, while measurement uncertainties
contributed by tree diameter measurements and tree diameter–biomass allometry equations were
relatively minor.
For some forest types, we found differences in aboveground tree carbon densities between burned
and unburned areas. For example, mean carbon density in burned red fir forests was estimated to be
~29% lower versus unburned areas. Alternative measures of fire history, such as time since fire and
number of times burned, were poorly related to carbon densities.
Within YOSE, we evaluated the stability of landscape carbon pools by quantifying carbon stocks in
areas of varying degrees of departure from historic fire return intervals. Of the ~25 Tg of total
aboveground tree carbon in YOSE, ~10 Tg is contained within relatively stable areas (the next fire is
unlikely to be high severity and stand-replacing), ~10 Tg occurs in areas deemed moderately stable,
and the remaining ~5 Tg within relatively unstable areas.
We compared our landscape carbon estimates in YOSE to remotely-sensed carbon estimates from the
NASA–CASA project and found that the two methods roughly agree. Our analysis and comparisons
suggest, however, that fire severity should be integrated into future carbon mapping efforts. We
viiillustrate this with an example using the 2013 Rim Fire, which we estimate burned an area containing
over 5 Tg of aboveground tree carbon, but likely left a large fraction of that carbon on the landscape
if one accounts for fire severity.
viiiAcknowledgments
Funding was provided by the National Park Service’s Climate Change Adaptation Program; the
National Park Service’s Fire and Aviation Management Research Fund; and the US Geological
Survey’s Terrestrial, Freshwater, and Marine Ecosystems Program. Remotely-sensed carbon stock
data was provided by Chris Potter with the NASA–CASA program. Jan Van Wagtendonk, Phil Van
Mantgem, Nate Benson, and Patrick Gonzalez provided critiques of early versions of this report,
greatly improving the quality of the final document. Any use of trade, product, or firm names is for
descriptive purposes only and does not imply endorsement by the US Government.
ixIntroduction
The conversion of atmospheric carbon into biological matter is a process called biosequestration.
This is in contrast to other forms of carbon sequestration involving physical (e.g. burial or deep
ocean deposition) or chemical (e.g. mineral carbonation) processes. The distribution and abundance
of biologically sequestered carbon on western North American landscapes is of crucial importance to
land management issues involving fire (Hurteau and Brooks 2011) and climate (Swann et al. 2012).
Carbon sequestration rates are also fundamental to understanding global gradients of ecosystem
productivity (Chisholm et al. 2013). However, detailed carbon storage estimates have many sources
of variation that are difficult to quantify for any particular landscape. In the Sierra Nevada,
heterogeneity of carbon across landscapes is influence by multiple factors, such as species
composition (Lutz et al. 2010), productivity gradients (Larson et al. 2008), history and magnitude of
fire and wind (van Wagtendonk and Lutz 2007, Lutz and Halpern 2006, Lutz et al. 2011, North et al.
2007), fuels treatment and management (Hurteau and North 2009), dispersal and post-disturbance
forest development (Halpern and Lutz 2013), and effects of insects and pathogens. Of these, fire is
perhaps the most influential within Sierra Nevada forested ecosystems.
Fire—whether ignited naturally, accidentally, or purposely—is an indispensable tool for
manipulating forest composition, structure, and function within Yosemite (YOSE) and Sequoia &
Kings Canyon (SEKI) national parks. Wildfire suppression—starting 150 years ago and becoming
very effective in the early 1900s (van Wagtendonk 2007)—has altered fuel structure, fire behavior,
and fire regimes in ways that ultimately increase risks of damage to infrastructure, natural and
cultural resources, watershed function, tourism, and local economies. Fire regimes in Sierra Nevada
mixed-conifer forests prior to European settlement were characterized by low- and mixed-severity
fires with short return intervals, while high-severity fires with long return intervals dominate
contemporary regimes (Scholl and Taylor 2010). During the past three decades, fire has been
systematically reintroduced—either by allowing naturally-ignited fires to burn under specified
conditions or by management-ignited fires—into fire-adapted forests of YOSE and SEKI in an effort
to reestablish historic regimes. The general objectives of these managed fires are to reduce surface
and ladder fuels, minimize crown fires, restore pre-suppression era fire regimes, and increase
resiliency of forests to projected climate change (YOSE and SEKI fire management plans 1). In lower
montane forests of the Sierra Nevada, the focus within national parks has been on increasing fire
frequency, increasing overall landscape heterogeneity in burned areas (Hessburg et al. 2005), and
restoring pre-suppression era fuels and fire regime characteristics.
Although fire is an important factor in forest carbon dynamics, the effect of contemporary fire
regimes on carbon stocks has not been sufficiently evaluated. Fires convert large amounts of forest
biomass into greenhouse gases—both immediately through combustion and over time as dead trees
decompose—however, post-fire vegetation growth re-sequesters carbon (Hurteau and Brooks 2011).
1
Available online at http://www.nps.gov/yose/parkmgmt/fireplan.htm and
http://www.nps.gov/seki/naturescience/fic_ffmp.htm
1The net change in carbon contained on the landscape relative to pre-fire levels depends on time since
burning, fire severity, and the vegetation types that grow back (Hurteau 2013). It may take centuries
for a forest experiencing high-severity fire to reach pre-fire carbon storage levels, while forests
burned at lower severities can replace lost biomass within decadal timescales. The differing
productivities of forests and their attendant regrowth rates (Larson et al. 2008), coupled with the
characteristic fire return interval of each forest type, make it difficult to determine the conditions
under which fires result in a net emission or assimilation of carbon at decadal and sub-decadal
timescales. At broader spatial scales and multi-decadal timescales, recent research has shown
frequent fire appears to create forest stands that are less dense, contain larger diameter trees, and
store a greater mass of carbon per unit land area than the stands they replace (Fellows and Goulden
2008). In lower elevation forests of YOSE, high-severity fire may be associated with loss of large-
diameter trees, whereas low- and moderate-severity fires do not cause noticeable declines in large-
diameter tree density (Collins et al. 2011, Lutz et al. 2009). Additionally, forests composed of large-
diameter, fire-resistant species have complex structure, which often includes high height-to-live-
crown values, thus making them less susceptible to stand-replacing crown fires and promoting
stability in long-term carbon storage (Hurteau et al. 2008).
In 2006 California passed the Global Warming Solutions Act (California Assembly 2006), which
mandated statewide greenhouse gas emissions be reduced to 1990 levels. The California Air
Resources Board was charged with developing and implementing a methodology for quantifying and
monitoring greenhouse gas emissions from different industrial sectors, including the forestry sector.
The immediate emissions from large wildfires can approach magnitudes equivalent to total annual
emissions from medium to large cities, leading to the perception that such fires are significant threats
to landscape carbon sequestration capacity. Even though this view only accounts for immediate and
short-term fire effects, it still leads to the possibility that using fire as a management tool may be
significantly limited if regulations restricting wildfire carbon emissions are implemented. However,
if limitations on fire use result in further accumulation of surface and ladder fuels that increase the
potential for high severity fire and thus unstable carbon stocks, such regulations may be
counterproductive for long-term carbon management.
A more comprehensive and realistic view of forestry-sector carbon dynamics requires that initial
losses from fire be placed in the context of longer-term forest productivity and stability, which could
actually result in net gains in carbon stocks—or at least reduced potential for high-severity, stand-
replacing fire—depending upon the amounts and types of biomass growing back post-fire (Hurteau
and Brooks 2011, Hurteau 2013). Because forest regrowth can take decades to centuries, it is difficult
to determine whether fires cause a net loss or gain of carbon over these longer timescales. Ultimately,
the Earth’s energy balance depends on how much carbon dioxide accumulates in the atmosphere over
time. Year-to-year variations in annual emission budgets at small spatial scales (relative to the
vegetated area of the planet) matter less than net accumulation of carbon dioxide and other
greenhouse gases over decades, and any permanent diminishment of the amount and stability of
carbons stocks in fire-adapted forest ecosystems has the potential to exceed sequestration gains made
in other sectors by orders of magnitude. Protecting the characteristic composition, structure, and
carbon dynamics of these potentially volatile and sensitive carbon pools must therefore be a high
2priority for any comprehensive strategy that seeks to lessen the accumulation of atmospheric
greenhouse gases.
In an effort to enhance our understanding of forest carbon dynamics in Sierra Nevada national parks
and the influence of contemporary fire management, our objectives for this project were to 1)
evaluate the relationships between fire and the aboveground tree carbon pool within YOSE and
SEKI, and 2) quantify tree carbon assimilation rates and their relationships to fire. We addressed
objective 1 by compiling existing vegetation plot data, collecting vegetation data in new plots,
utilizing recent vegetation and fire history mapping data, compiling a set of species-specific biomass
allometric equations, and developing a statistical analysis technique to assess uncertainties in
landscape-scale carbon estimates. We are addressing objective 2 by using tree cores and dendro-
chronological methods to document tree growth patterns and rates of carbon assimilation for five
years before and after fires of low- to moderate-severity. Field data collection for objective 2 is
complete, but laboratory analyses are still in progress, therefore the methods and results for that
objective will be presented in a future manuscript.
3Table 1. Number of sampling plots located
Methods within each vegetation type.
Plot Dataset Forested Vegetation Type # Plots
We compiled a dataset of ground-based tree Deciduous Oak Forest and Woodland 88
measurements using data collected by various Douglas-fir Forest 7
vegetation projects throughout the parks. These Evergreen Oak Forest and Woodland 110
projects included natural resource inventories
Foothill Pine Woodland 11
(Peggy Moore, Ecologist, USGS Yosemite Field
Foxtail Pine Forest 58
Station and Sylvia Haultain, Plant Ecologist,
Giant Sequoia Forest 42
Sequoia/Kings Canyon National Park personal
High Woodland 89
communications), vegetation mapping (Keeler-
Jeffrey Pine Forest 111
Wolf et al. 2012; Sylvia Haultain, Plant Ecologist,
Lodgepole Pine Forest 190
Sequoia/Kings Canyon National Park personal
Mountain Hemlock Forest 38
communication), fire effects monitoring (Gus
Pinyon Pine Woodland 27
Smith, Fire Ecologist, Yosemite National Park and
Ponderosa Pine Forest 123
Tony Caprio, Fire Ecologist, Sequoia/Kings
Ponderosa Pine Woodland 13
Canyon National Park personal communications),
fuels studies (van Wagtendonk and Moore 2010), a Red Fir Forest 116
Smithsonian-affiliated demography study (Lutz et Riparian Forest 87
al. 2012, 2013), and this project. Plots in forested Riparian Shrub 23
vegetation types were primarily 0.1 ha in size, Shrub 258
within which tree species and diameter at breast Western White Pine Forest 27
height (DBH) were recorded. Our compiled dataset Western White Pine Woodland 4
consisted of 2590 total plots, with 1646 plots White Fir - Sugar Pine Forest 224
within the forested vegetation types we used in our Total 1646
analysis (Table 1). Plot measurement years ranged from 1982 to 2011.
Field Data Collection
We supplemented the pre-existing plot data by establishing 105, 0.1-ha circular plots in YOSE (67
plots) and SEKI (48 plots). The plot locations were stratified by five different forest types (white fir–
sugar pine, red fir, lodgepole pine, Jeffrey pine, and ponderosa pine) and two fire histories (burned at
low to moderate severity since 1984, or unburned in recorded history; Table 2). The new plots were
selected from adjacent portions of forests that had been either burned or unburned in an attempt to
control for local variation. Plot locations were selected by GIS analysis to achieve maximum areal
coverage given the labor allocated (i.e., more over-dispersed than random), with slightly lower
representation in those areas far from roads. Additionally, the new plots were positioned >50 m
Table 2. Numbers of newly established plots by park, forest type, and burn history.
White Fir Red Fire Lodgepole Pine Jeffrey Pine Ponderosa Pine
Park B1 U2 B U B U B U B U Total
YOSE 11 15 4 4 4 0 4 5 9 11 67
SEKI 1 0 10 8 3 1 10 2 2 1 38
Total 12 15 14 12 7 1 14 7 11 12 105
1
B = burned; 2U = unburned
4inside the mapped boundary of the intended forest type and burn patch, on slopes between 0° and
35°, and >100 m from roads, streams, and trails. Upon arriving at a site, field crews assessed the
intended forest type and burn status, and relocated the plot if it did not meet the intended
specifications. Plots were also relocated if there were fewer than 10 trees >8 cm DBH within 46.5 m
of the plot center.
Field crews visited plots between June and September 2011. They recorded plot center coordinates
(measured with consumer-grade GPS receivers), slope, aspect, topographic position (slope position:
low, mid, upper slope; level position: low, mid, or high level; hydrology: inter-fluvial, channel, wall,
basin floor) and slope configuration (convex or concave). Additionally, two plot photos (north and
south view) and a panoramic video were taken from the plot center. Crews ocularly estimated canopy
cover by species for each plot quadrant. They recorded percentage cover by shrub species for any
species occupying ≥1% of one plot quadrant. Species and DBH of all live trees and snags >15 cm
DBH were recorded within the entire plot, and species and DBH were recorded for all live trees and
snags between 2.5 cm and 15 cm DBH in at least one plot quadrant.
Allometric Equations
In order to calculate tree biomass, we compiled a set of allometric equations developed by prior
studies. For each tree species, we first examined existing equations and selected the most appropriate
equation(s) by considering the tree species, location of the original study, tree age range (where
reported), tree diameter range, site productivity, site climate, and sample size. When available, we
used species-specific equations from studies geographically closest to our study region (e.g.,
Westman 1998 for fir). None of the allometric equations were developed from trees within the parks.
If a species-specific equation wasn’t available, we chose an equation from a species with a similar
growth form or used one of the generalized equations developed by Jenkins et al. (2003). In some
cases, such as high elevation woodlands, the Jenkins et al. (2003) generalized equations may not be
appropriate because of the compact and stunted morphology of high elevation pine and hemlock
species. In many cases, the diameter range of trees used to develop an equation did not extend
throughout the diameter range of trees in our dataset. YOSE and SEKI contain some of the largest
known individuals of ponderosa pine, sugar pine, white fir, red fir, and giant sequoia (Van Pelt
2001). Because destructive sampling is generally enjoined in the parks, allometric equations using
large diameter trees do not exist. For these situations we created blended equations using the species-
specific equations over the diameter range of trees from which the equation was developed, then
switched to equations from similar species and growth forms that covered the necessary diameter
range. Appendix A provides a detailed listing of equations used for each species.
All biomass equations were originally expressed in, or converted to, the form
ln(biomass) = a + b × ln(DBH), with biomass expressed in kg and DBH in cm. Each equation
included a standard error of the estimate (SEE), which is the standard deviation of the normally-
distributed error around the predicted biomass while expressed on a log scale. The SEE can be used
to calculate a bias correction factor when exponentiating the log-scaled biomass to an arithmetic
value. Tree carbon mass was assumed to be 50% of biomass based on the proportion of carbon found
in cellulose, hemicellulose, and lignin, but without regard for the various proportions of carbon
5present in species-specific complex organic compounds (e.g. polyphenols and extractives). Although
the proportion of carbon differs by species and tissue (wood, bark, and foliage), conifer species have
a mean wood carbon value variously reported as 50.8% (Thomas and Martin 2012), or 47–55%
(Lamlom and Savidge 2003). The 50% figure provides an acceptable average—generally, firs (Abies
spp.) have carbon content slightly less than 50%, pines (Pinus spp.) slightly greater than 50%, and
cedars (Cupressaceae family) around 52%. However, similar to the situation with allometric
equations, very few carbon analyses have been done on the species prevalent in YOSE and SEKI.
Analyses
Assigning Forest Types
Although the number of plots in the study was large, the number of plots in many mapped vegetation
community types was small. In order to increase sample sizes and improve our carbon density
estimates within a given forest type, we aggregated mapped community types based on tree species
composition, tree morphology, and characteristic fire regime. For example, there were several high
elevation woodland communities which all have a very long fire return interval and characteristic
tree morphology (short, compact boles of Sierra juniper, whitebark pine, and mountain hemlock),
therefore we assigned a single forest type to those vegetation communities (see Appendix B for
community–forest type assignments). We assigned plots to forest types by spatially intersecting their
locations with the vegetation maps. We inspected these assigned forest types and plot species
composition, and discovered that in some cases there were incorrect assignments, presumably
because plot geographic coordinates were incorrect or the map polygon was incorrectly classified.
We then identified potentially misclassified plots by conducting a k-means clustering of plots using
their tree species composition, assigning the resulting clusters to our aggregated forest types, then
looking for mismatches between the mapped-based and cluster-based forest types. When a mismatch
was found, we manually assessed the plot’s species composition and assigned it to the appropriate
forest type.
Density and Total Carbon
We estimated tree carbon density (kg/m2) and total carbon (Tg) for each forest type within each park.
Our definition of trees included living trees and standing snags. In addition to the typical uncertainty
in estimated statistical parameters arising from sampling a population, we also explored the influence
of various other measurement errors on carbon estimates and their uncertainties. These measurement
errors included repeatability in tree diameter measurements, uncertainties in allometric equation
diameter–biomass relationships, and classification accuracies in vegetation maps. We developed a
Monte Carlo simulation that repeatedly calculated carbon densities and total carbon while taking into
account those uncertainties. For tree diameter, a normally-distributed error with mean 0 and standard
deviation 0.027 (based on the root mean squared error of duplicated tree diameter measurements
reported by Gonzalez et al. [2010]) was added to each tree DBH measurement. Tree biomass—on a
log scale—was calculated using the assigned allometric equations plus a normally-distributed error
with mean 0 and standard deviation equal to the equation’s standard error of the estimate. Typically,
when making a single prediction using a log–log equation, a bias correction is added to the value so
that when it is exponentiated it is closer to the arithmetic mean (the arithmetic values tend to be log-
normally distributed and exponentiating the log value without bias correction will place the
6prediction closer to the distribution’s median; Baskerville 1972). However, during a Monte Carlo
simulation, the distribution of multiple arithmetic predictions will realize the lognormal distribution,
so a bias correction is not needed. Log-scaled tree biomass values were exponentiated, multiplied by
the carbon content value (0.5), summed within a plot, and divided by the plot area to produce a
carbon density value (kg/m2). A bootstrapped sample (a random sample with replacement equal in
size to the original sample) of all plots was taken in order to incorporate uncertainty from statistical
sampling. We then fit a linear regression model to predict carbon density (log + 1 transformed) using
forest type, forest canopy cover class, and their interaction as explanatory variables. Forest canopy
cover classes were taken from the forest type maps, where each mapped polygon had been assigned a
canopy cover class during photo interpretation. Three forest types (Douglas-fir Forest, Foothill Pine
Woodland, and Western White Pine Woodland) did not have enough plots across a range of canopy
covers, so their carbon estimates are a simple mean. These steps for predicting carbon densities
utilized plots pooled across all parks.
We used the park vegetation maps to calculate the total areas for each combination of forest type and
canopy cover class. To take into account uncertainties in vegetation mapping, we used the accuracy
assessment matrices to generate uncertainties in forest type areas. The vegetation type assigned to
each polygon was randomly assigned using the numbers of ground-based truth plots as weights. For
example, if a particular vegetation type had 100 ground-based accuracy assessment plots with 70
determined to be the correctly classified type, 20 determined to be another type, and 10 determined to
be a third type, then the probabilities of vegetation type assignment for that polygon were randomly
assigned to the three types based on the proportions 0.7, 0.2, and 0.1, respectively. If a vegetation
type had four or fewer accuracy assessment plots, we did not randomly reassign types. We then
cross-walked the polygon vegetation types to our forest types, summed the total areas for each
combination of forest type and canopy cover class, and multiplied by the predicted carbon densities
to produce estimates of total carbon (Tg). These steps were done separately for each park, including
using the park-specific accuracy assessment matrix (Keeler-Wolf et al. 2012; USGS–NPS Vegetation
Characterization Program), in order to produce park-specific carbon estimates. Estimates of mean
carbon densities for individual forest types (without regards to canopy cover) were calculated by
taking a weighted average of the canopy cover class-specific estimates, with the weights equal to the
total area of each canopy cover class.
We also explored simplifying the incorporation of allometric equation errors. Since individual trees
within a plot are summed together to calculate carbon density, individual tree errors can also be
summed together to produce a plot-level error. Tree biomass errors are expressed, and normally
distributed about the prediction, while on a log-scale; however, they can be approximately converted
to an arithmetic scale (equation 9 in Baskerville 1972). There are then two options for summing the
resulting tree errors: a simple sum and a sum in quadrature (the square root of the sum of squared
errors). If errors are assumed to be random and independent of each other, then summing in
quadrature is appropriate, whereas the simple sum is a more conservative approach if independence
cannot be assumed. Tree errors within a plot are likely dependent—for example a tree with a smaller-
than-predicted bole biomass likely has smaller-than-predicted branch and leaf biomasses; or, tree
biomasses in a plot might all be higher than predicted if wood density tends to be greater due to
7slower growth at a low-productivity site. More importantly, the allometric equations we used were
developed from tree sub-populations outside the parks (sometimes from a considerable distance
away), and it is very likely that the tree morphologies differ between the sample location and the
parks, forming a consistent (but unknown) bias in the allometric equations. For these plot-level
summaries, tree biomass was calculated using a bias correction factor since only a single prediction
is being made. The benefit of using plot-level errors is that in each Monte Carlo realization random
errors need only be generated for thousands of plots as opposed to hundreds of thousands trees,
greatly reducing computation time.
Carbon density and total carbon estimates, plus their standard errors and 95% confidence intervals
(CI), were based on the means, standard deviations, and 2.5 and 97.5 percentiles of the distributions
from a Monte Carlo simulation of 10,000 realizations. The simulations were programmed in R (R
Core Team 2013), graphs developed using ggplot (Wickham 2009) and base R graphics packages,
spatial data managed using PostGIS (PostGIS Development Team 2013), and maps produced using
QGIS (QGIS Development Team 2013).
Fire History and Carbon Density
We investigated the influence of fire history on carbon density for forest types that experience
regular, natural wildfire and for which we had sufficient sample sizes—specifically red fir, white fir–
sugar pine, ponderosa pine, Jeffrey pine, and lodgepole pine forests. We intersected plots within
those forest types with fire history polygon data (~1920 to present) from each park and derived three
fire history metrics for each plot: 1) burned vs. unburned, 2) years since the last fire, and 3) number
of times burned. For plots without a recorded history of fire, we set years since last fire to 100. We
evaluated potential relationships between each of those burn metrics and forest type carbon density
by developing a set of statistical models and comparing them using an information-theoretic
approach. We defined seven candidate models: one model having just forest type as an explanatory
variable, and six others that included one of the three burn history metrics either in addition to or
interacting with forest type as explanatory variables (Table 3). Carbon density (log + 1 transformed)
was the response variable. Model AIC scores (adjusted for sample size) were used to compare the
predictive performances of the candidate models. For the best model, we estimated model parameter
values, carbon densities, and compared differences in predicted responses to fire history using a
Markov Chain–Monte Carlo procedure. These models didn’t incorporate tree biomass measurement
uncertainties (arising from tree diameter and allometry equation errors) because, as we discuss
below, those uncertainties were negligible compared to the uncertainties due to statistical sampling.
Carbon Stock Stability
We evaluated relative carbon stock stabilities in relation to wildfire risk by overlaying our carbon
density map with a fire regime interval departure (FRID) map (van Wagtendonk et al. 2002). FRID is
the number of fires missed (relative to the expected number of fires given a historically natural fire
regime) at a particular point in the landscape over a given time span. An area with a high FRID has
burned less frequently than expected under natural conditions, and the resulting build-up of surface
and ladder fuels presumably increases the risk of intense, stand-replacing crown fire. We calculated
the amount of carbon within each forest type within various FRID levels (specifically median FRIDs)
8using the 2012 YOSE FRID map (Kent van Wagtendonk, YOSE Fire GIS specialist, personal
communication). A FRID map for SEKI has not been developed; therefore, our carbon stability
summaries are applicable to only YOSE.
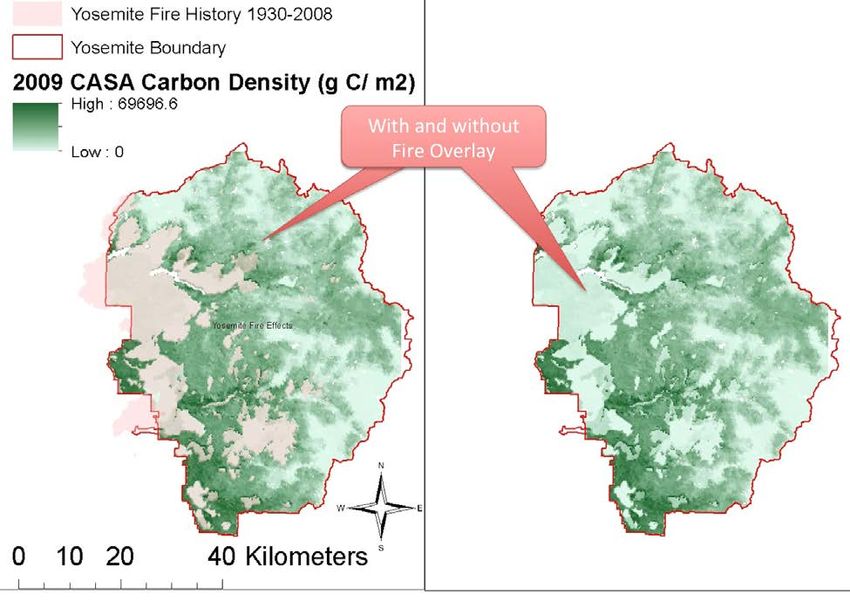
Comparison with Another Carbon Accounting Effort
The NASA–CASA program has developed a 250-m resolution, California-wide product that
estimates current carbon stocks by applying remotely-sensed net primary productivity estimates to
baseline biomass stocks (Potter 2010). Within YOSE, we compared our carbon estimates to the
NASA–CASA estimates and evaluated potential limitations in how the NASA–CASA method
accounts for carbon losses due to wildfire, using 2013’s Rim Fire as a specific example.
9Results and Discussion Error Propagation and Sources of Uncertainty Carbon estimates rely on plot-based tree allometry equations linking biomass to tree diameter measurements, then scaling them up to the landscape level. There are uncertainties associated with every step in these measurement and scaling processes. For a given forest type, tree inventories are converted to areal carbon estimates using allometric equations, and landscape level values are calculated based on the area of that forest type. It is therefore just as important to understand the aggregate uncertainties of carbon estimates, as it is to understand their mean values. Specifically, there are five potentially large sources of error associated with this process: 1. Uncertainty embedded within allometric equations The existing tree allometric equations themselves have error associated with them because they are typically derived from a small number of trees (usually
level estimates of carbon must be based on a sufficient number and distribution of plots to capture the
range of these conditions.

5. Vegetation type mapping error
The vegetation maps used to scale-up carbon estimates for forest types contain their own degree of
error associated with vegetation cover assignment. Georeferencing uncertainties between plot
locations (e.g., poor plot location information from older GPS units, difficult topography, or
multipath GPS reception cause by high tree density) and vegetation cover polygons (e.g., poor aerial
photograph georectification, incorrect vegetation type identification, or polygon edge error during
data input) can add further error.

We evaluated the relative contribution of these five sources of error, and found that in general
uncertainties associated with repeated measurements of tree diameters and choice of diameter–
biomass allometric relationships had very little effect on the standard errors and confidence intervals
of tree carbon density and total carbon estimates (however, better allometric equations constructed
from dissections of large numbers of individual trees may reduce these uncertainties). The widths of

Figure 1. Comparisons of uncertainties in total carbon estimates for 6 forest types in Sequoia & Kings
Canyon (SEKI) and Yosemite (YOSE) national parks.

                                                   11
the 95% confidence intervals for total carbon in several major forest types within both parks differed
only slightly among the different methods of accounting for allometry error (Figure 1). The typical
uncertainty arising from sampling a population—especially a very heterogeneous one—appears
much more important for our dataset.
Forest type classification uncertainties, however, were an important component of uncertainty in total
carbon estimates. We observed that Monte Carlo-estimated areas differed from observed mapped-
based areas for several forest types. For example, a single summation of red fir forest polygons from
YOSE’s vegetation map yields 41,315 ha, while the Monte Carlo estimate is ~13% lower at
36,052 ha (95% CI: 34,655–37,723), suggesting that this forest type is currently over-mapped. Other
forest types appear to be under-mapped, for example the high woodland type, which occurs on
26,602 ha in YOSE according to the vegetation map, while the Monte Carlo estimate is ~9% higher
at 28,995 ha (95% CI: 28,307–29,953). These differences in area estimates noticeably affected total
carbon estimates for some forest types, and usually widened the total carbon confidence intervals,
although can also narrow the confidence intervals in some types (for example red fir) because the
reduction in total area of the type leads to lower total carbon and confidence intervals generally
become more narrow as the estimate gets smaller.
Given these responses, the Monte Carlo simulation used to produce the carbon estimates throughout
the remainder of this report used the ‘plot error simple sum’ method to propagate error and
incorporate allometric uncertainty (mainly as a conservative approach, because this method tended to
produce the widest 95% confidence intervals) and incorporated the vegetation mapping uncertainty.
A bootstrapped sample of plots was taken in each Monte Carlo realization to incorporate sampling
uncertainty.
Aboveground Tree Carbon
Accounting for the uncertainties as described above, we estimate total aboveground tree carbon in
YOSE to be 25 Tg (95% CI: 23–27 Tg) and for SEKI to be 20 Tg (95% CI: 18–21 Tg). The total
across both parks is about 4.1% of the total standing carbon estimated in the Sierra Nevada (Potter et
al. 2010). Over the area (YOSE has an area of 3,052 km2 and SEKI has an area 3,503 km2) of both
parks, the range of aboveground tree carbon is 41–48 Tg (mean of 45 Tg), which is nearly 10% of the
total standing wood in the Sierra Nevada (Potter et al. 2010).
Densities of aboveground tree carbon varied from a low of nearly 0 kg/m2 in shrub vegetation types
to over 55 kg/m2 in giant sequoia forests (Figure 2). Although the carbon densities for vegetation
types were very similar between parks, the total carbon in many vegetation types differed
substantially since the areal extents of the vegetation types differed (Figure 3). For example, in SEKI
the namesake giant sequoia forests alone account for 10–17% of total tree carbon, while in YOSE
they account for 0.2–0.4%. Red fir forest accounted for ⅓ of total tree carbon in both parks (32–36%
in SEKI; 37–42% in YOSE), with YOSE (8.8–11.5 Tg) having nearly double the amount of carbon
in its red fir than SEKI (5.7–7.6 Tg). White fir–sugar pine forests for both parks accounted for about
19–22% of their respective total tree carbon (3.5–4.7 Tg for SEKI; 4.4–5.7 Tg for YOSE). Further
summaries for each forest type are provided in Appendix C.
12Figure 2. Aboveground tree carbon densities (means and 95% confidence intervals) for vegetation types
in Yosemite (YOSE) and Sequoia & Kings Canyon (SEKI) national parks.
Here we should note a fundamental uncertainty and decision point in estimating carbon stocks: the
plot carbon values that underpin total landscape carbon estimates within each vegetation type are not
normally distributed. A small proportion of plots have very high carbon—probably because of large-
diameter trees—and this skews the calculated mean. For example, Figure 4 shows the cumulative
distribution of carbon densities for 116 red fir plots in YOSE. The red line is the simple mean, the
blue line is the median, and the green line is the mean calculated using log-transformed values that
are then exponentiated back to arithmetic values. The different means for this extremely important
forest type can vary by ~7 kg/m2 depending upon how they are calculated. Taken over the area of
YOSE covered by red fir, this variation in estimated carbon density can result in a ~4 Tg swing in
total carbon for the park. The same principle applies to other vegetation types with large, old-growth
trees (e.g., white fir–sugar pine and giant sequoia forests), although they cover less area and therefore
contribute less to potential differences in total tree carbon.
Though problematic from a computational and statistical standpoint, there is a growing body of
literature suggesting that this skewed distribution toward large trees is a valuable and desired forest
13Figure 3. Aboveground tree carbon totals (means and 95% confidence intervals) for vegetation types in
Yosemite (YOSE) and Sequoia & Kings Canyon (SEKI) national parks.
characteristic (e.g., Hurteau et al. 2011, Lutz et al. 2012, 2013) from a carbon, fire management, and
a forest function perspective. For example, Lutz et al. (2012) found that although large-diameter live
trees (≥100 cm DBH) accounted for 1.4% of the individuals, they comprised 49.4% of total biomass
(white fir and sugar pine comprised 93% of large-diameter trees at their study site). Kane et al.
(2013) demonstrated that fires “thin from below” by removing much of the canopy area in the 2–8 m
canopy strata. Thus, while fire removes biomass from forests, it disproportionately removes the
understory at lower fire severity, leaving the large-diameter trees containing a greater proportion of
carbon. These large-diameter trees are perhaps the defining feature of these two parks. They are
uniquely able to withstand all but the highest severity fires, and are of considerable ecological and
social interest (including giving rise to the name of Sequoia National Park itself). Dendro-
chronological evidence confirms that these large trees developed under frequent fire regimes, with
high severity fire patches limited in extent (Scholl and Taylor 2010). The resilience of large-diameter
trees to damage from fires characteristic of the pre-suppression era suggests that their preservation is
important to overall forest composition and structure, and most probably will continue to be so even
under projected climate change scenarios (e.g. Lutz et al. 2010).
14Fire History and Tree Carbon Density
The statistical model containing forest type,
whether a plot was burned or unburned, and
burning’s interaction with forest type had the
greatest support (lowest AIC value) out of our
seven candidate models (Table 3). However, the
statistical support for that model was only slightly
greater than the model containing only forest type
(AIC difference of only being ~3). The other
candidate models using the other burn history
metrics (number of times burned and years since
most recent fire), either alone or interacting with
forest type, did not have much support.
Figure 4. Distribution of carbon densities for red fir
forest plots in Yosemite. Red line is the simple
Aboveground tree carbon density estimates using
mean, blue line is the median, and green line is
the best model (forest type + burned + forest type mean of log-transformed values.
× burned) indicated the burn history effect was
inconsistent across forest types (Figure 5). The most substantial difference was in red fir forest,
where carbon density was ~29% lower if burned (absolute difference of 8.9 kg/m2 with a 95% CI of
0.4–16.9). Carbon densities were ~15% lower in burned versus unburned within ponderosa pine
(difference 2.6 kg/m2; 95% CI -1.8–7.0) and white fir–sugar pine (difference 3.9 kg/m2; 95% CI -
1.8–9.4) forests, while Jeffrey pine forests had ~40% higher density within burned areas (difference
2.0 kg/m2; 95% CI -0.2–4.4). Those differences included 0 within their 95% confidence intervals,
and thus are not strongly significant. Burned lodgepole pine forests also appeared to have slightly
higher carbon density (difference 2.4 kg/m2; 95% CI -0.6–6.3), but there was substantial uncertainty
around the burned estimate, primarily because of small sample size.
This analysis of fire history impacts on forest carbon storage is admittedly simplistic, and a more
sophisticated view would account for fire severity and its effect on carbon accumulation rates (e.g.,
Hurteau and North, 2012). In addition, it should be noted that the context of our burned versus
unburned contrast was for plots that were sampled with medians ranging from 14–16 years since last
fire, with very few plots having >30 years since last fire. General effects of fire at longer times since
burning could not be addressed with the data on hand. We are currently examining fire severity and
carbon dynamics relationships (to be published in Becker, K.M.L., Smith, D.G., and Lutz, J.A. In
prep. Trends and variability in the effects of fire on forest structure in the Sierra Nevada). Given the
Table 3. Tree carbon density and fire history model comparisons.
Model Effects AIC AIC – Minimum AIC
forest type 1698.6 2.97
forest type + burned 1699.6 3.93
forest type + burned + forest type x burned 1695.7 0.00
forest type + times burned 1700.6 4.96
forest type + times burned + forest type x times burned 1698.7 2.98
forest type + years since fire 1699.9 4.26
forest type + years since fire + forest type x years since fire 1696.7 1.01
15Figure 5. Aboveground tree carbon totals (means and 95% confidence intervals) for vegetation types in
Yosemite (YOSE) and Sequoia & Kings Canyon (SEKI) national parks.
limited number of plots and range of fire severity within each vegetation type, preliminary results do
not point to a large and statistically significant effect of low- to moderate-severity fire. The results
presented in the current report therefore focus on the burned/unburned alternatives on which policy is
currently based, and whether that metric provides any useful information on the effects of fire on
carbon stocks. The work still in progress will help bound the effects of low severity fire on forest
composition and structure.
Additionally, our analysis potentially underestimates carbon losses in cases where fire caused a
drastic change in vegetation composition. For example, if a plot classified as a shrub community
(according to its composition and the vegetation map) had been a forest community prior to a fire,
then the change in tree carbon following fire for that plot wouldn’t be part of the estimated change
for the forest community because there is no way of knowing the plot’s pre-fire vegetation
classification. This situation most likely occurs following high-severity fire; therefore, our estimated
differences in burned versus unburned carbon densities are most applicable for low- to moderate-
severity fires.
Yosemite Carbon Stability Using Fire Return Interval Departure
How much of the Yosemite carbon stock is at risk? One proxy for the risk of carbon loss in fire is the
fire return interval departure (FRID), which indicates the degree to which the recent fire return
interval for a given stand deviates from the expected fire return interval under a naturally occurring
fire regime (van Wagtendonk et al. 2002). Forest stands that have not experienced a fire for a longer
16You can also read