INDIA GROWTH STORY : DISBALANCING THE INEQUALITY & POVERTY
←
→
Page content transcription
If your browser does not render page correctly, please read the page content below
OCCASIONAL PAPER 6

        INDIA GROWTH STORY :
DISBALANCING THE INEQUALITY & POVERTY

 I have now travelled all over India. but alas! It was agony to
 me, my brothers, to see with my own eyes the terrible
 poverty and misery of the masses, and I could not restrain
 my tears.

                                              Swami Vievkanand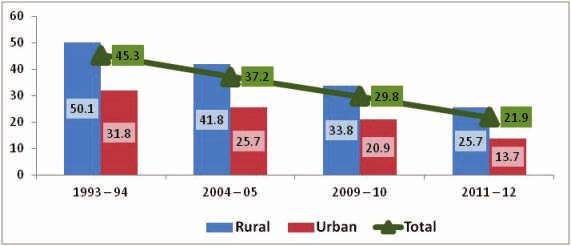
OCCASIONAL PAPER 6

        INDIA GROWTH STORY :
DISBALANCING THE INEQUALITY & POVERTY

               Dr. Rahul Singh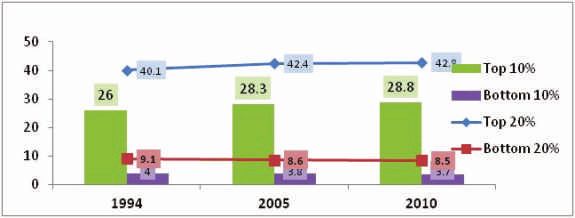
No part of this publication can be reproduced, stored in a retrieval
system or transmitted in any form or by any means, electronic,
mechanical, photocopying, recording or otherwise, without the prior
permission of the publishers.

Published by :
India Policy Foundation
D-51, Hauz Khas, New Delhi-110016 (India)
Tele: 011-26524018
Fax: 011-46089365
E-mail: indiapolicy@gmail.com
Website: www.indiapolicyfoundation.org

Edition:
First : April, 2014
ISBN : 978-81-925223-5-7
© India Policy Foundation

Price :
Rupees Fifty only (Rs. 50.00)

Printed at : I'M World-09312431409
Executive Summary

The primary difference between growth, inclusion and redistribution is
qualitative in nature, apart from unidimensional income parameter. In India’s
case it is the matter of utmost priority to opt for redistribution unhesitatingly;
considering lives of millions of people are on stake due to pervasive nature of
absolute poverty and extreme inequality. Growth does not guarantee
inclusion and inclusion does not necessarily translate into equity. India’s
standing in Human Development Index (HDI) has become a matter of global
shame in the last decade.

More so, due to rapid economic growth in corresponding period, this growth
had mostly fuelled inequality and bred crony capitalism and corruption. In
recent times many claims and counterclaims have been made pertaining to
number of poor people in India. It is tragedy of extreme kind where State has
been perpetually indulging in reducing number of fringed people by
calibrating poverty line rather sincerely empowering people. The ‘density
effect’ can hide numbers but not reality. The income inequality, which is the
most obvious kind of disparity, is also on rise. The top quintile of population
has increased their share of income than bottom quintile in last decade.

The paradox of plenty and penury has become more stark in recent times in
context of record food grain production and prevalent hunger. The Global
Hunger Index (GHI) ranking of India is a sad commentary on its claim of
emerging super power. This dreadful reality stares at face when almost half of
its population under the age of five is malnourished and suffers micronutrient
deficiency; worse than Sub-Saharan countries. At last, the question which
bites hard is of forthrightness of intentions of ruling Government in the last
decade; considering dismal records of human development at the same time,
amidst dual scourge of inflation and corruption.
Contents

I.     Growth, Inclusion and Redistribution:             06
       Question of Priority
II.    Manifestation of Malaise:                         09
       Poverty and Inequality
III.   The Curious Case of Declining poverty :           12
       An Art of Artificial Calibration
IV.    Islands of Proserity                              17
V.     Hungry People, Dying Farmers and Rotting Grains   21
VI.    Unconscientious Intentions                        25
Growth,
Inclusion and
I Redistribution:
QUESTION OF PRIORITY
T he paradox of growth could be aptly summarized in the statement Emilio
Medicin, in 1971 as head of state of Brazil on being asked by a visiting dignitary
about economic situation of the country, he replied “the economy is doing fine,
but people are not”. The growth paradigm in India in last decade mirrors this intriguing
paradox. Since India’s fast economic growth in the same period is often celebrated, for
numerous good reasons, its limited impact on fringed section of society evokes
concern. The disingenuousness behind the promises of ruling elite in last six decades
seems to appear strikingly conspicuous, when ‘tryst with destiny’1 bypassed millions
of common citizens.
On the more serious note, as the earlier euphoria around rapid economic growth seems
vanishing, with dismal Gross Domestic Product (GDP) growth rate in last couple of
years; what remains in perpetual constancy is lamentation around inequality and
poverty. So what is meant by inclusion, when it is sold out, every now and then, on any
nook and corner of policy Bazaar? What is the centrality of the idea? How it is different
in Indian case, where extreme exclusion and inequality are pervasive and runs deep?
06INDIA GROWTH STORY : DISBALANCING THE INEQUALITY & POVERTY
Inclusiveness is not a mitigating act, as described by Ali and Jhuang2 , but a way of
engagement in the social production (growth) process and settlement of claims on the
products on fair basis; “growth is inclusive when it allows all members of society to
participate in and contribute to the growth process in equal basis regardless of their
individual circumstances”. Ravallion and Chen3 defined growth as pro-poor simply if
it reduces poverty and inclusive growth, on the other hand, is defined as growth which
is not associated with an increase in inequality.
Kanbur and Runiyar4 made insightful distinction between growth, pro-poor growth,
inclusive growth and inclusive development. Growth has much simplistic, tight and
well accepted meaning related to increase in real per capita income, however pro-poor
growth signifies reduction in income poverty. In continuation, inclusive growth
signifies growth accompanied by lower income inequality in which income accrues
disproportionately to those with lower income. So growth could well be pro-poor but
not necessarily will be translated into poor, meaning poverty reduction will bring
concomitant inequality. While inclusive development breaks the rigid parameter of
income and adopts wider conception of human well being on various parameters like
education, health and enhancement of choices, like Millennium Development Goals
(MDGs).
As growth is unidimensional measure of performance, however pro-poor growth,
inclusive growth and inclusive development are better and nuanced yardsticks to
gauge authentic well being of masses. On extending definitional framework, when
inclusive development indicators are sought, for validating claims of ruling parties, it
boils down to economic growth with employment opportunities, social inclusion and
social protection, as well as good governance and institutions, on which it is based.
The more specified inclusive growth indicators were enumerated as a set of 35
indicators by Asian Development Bank of (i) poverty and inequality (income and no
income), (ii) economic growth and employment, (iii) key infrastructure endowments,
(iv) access to education and health, (v) access to basic infrastructure utilities and
services, (vi) gender equality and opportunity, (vii) social safety nets, and (viii) good
governance and institutions5.
India Policy Foundation 07‘Faster, More Inclusive, Sustainable Growth’ is the title of volume one 12th 5-Year Plan, prepared by Planning Commission. The 11th Plan volume one titled “inclusive growth”. The frequency with which the words like inclusive, equitable and sustainable are appearing in major policy documents, intentions to attain same is nowhere getting manifested in action and outcome. Planning commission seems clueless about what it means by inclusion and sustainability and ways and means to integrate it into policy cycle6. The often opted policy approach to inclusion, till now, has been characterized by lack of clarity, confusion, uncertainty, ad-hocism, and no regard for sustainability. As equality is the universally acclaimed value and is generally affirmed as basic human right but the question is “equality of what” famously asked by Amartya Sen? The answer to question had to be significant for identifying and enacting policy variables and prescription for alleviating poverty and ensuring equality7. 1 http://www.svc.ac.in/files/TRYST%20WITH%20DESTINY.pdf 2 Ali and Jhuang, Inclusive Growth towards Prosperous Asia, 2007 3 Ravallion, Martin & Chen, Shaohua, 2003. "Measuring pro-poor growth," Economics Letters, Elsevier, vol. 78(1), pages 93-99, January 4 Kanbur, Ravi and Rauniyar, “Conceptualizing Inclusive Development: With Application to Rural Infrastructure and Development Assistance”, June 2009 5 “Framework of Economic Growth Indicators: Key Indicator for Asia and the Pacific”, 2011, Asian Development Bank 6 Is Sustainability Truly Built into the 12th Plan? — Ashish Kothari, Kalpavriksha Environment Action Group 7 Dr. Amartya Sen rightly points out the diversity of characteristics possessed by human beings (e g, age, gender, general abilities, inborn talents, proneness to disease, physical and mental capabilities) and external circumstances (such as ownership of assets, residential locations, social background and so on) so you cannot have equality for everything and policy space for remedial action has to be identified and acted upon 08
INDIA GROWTH STORY : DISBALANCING THE INEQUALITY & POVERTY
Manifestation
II of Malaise:
POVERTY & INEQUALITY
T he correlation between economic growth and equitable development has been
contested one. This is not to say that growth is irrelevant, rather it is
prerequisite; but translating growth into a tool to enhance human capital of
nation or enhancing human capabilities for all around development is much trickier
than simply imagined. The famous trickle down approach, especially in the Indian
context has had limited success. Disparity and inequality has increased and percolated
deep across various economic groups. The post reform period saw accelerated pace of
inequality between top and bottom quintile of population in terms of per capita
income8. The broad based upliftment in social, economic and political sphere, which is
the hallmark of democracy, cannot be judged singularly on GDP growth per se.
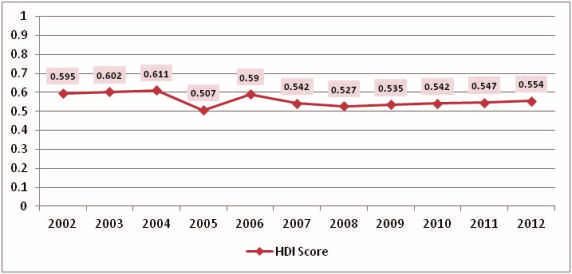
(Figure 1)
Figure 1: Human Development Index Ranking: India9
India Policy Foundation 09The Human Development Index (HDI) is a composite index measuring average
achievement in three basic dimensions of human development—long and healthy life,
Knowledge and a decent standard of living. These are the three bare necessities
prerequisite for any discourse on human development, which is all about conscious
enlargement of choices, as explained by late Pakistani economist and also regarded as
father of HDR, Mahbub-al-Haq and noble laureate Amartya Sen. As an alternative way
to gauge the status of living standard, India has notoriously being walloping in the
bottom of this index for a long period of time. The human development index released
in 2013 ranks India 136 out of 187 countries. It serves to confront the challenges and
boasted claims vis-à -vis shocking reality of India’s sorry human development status.
(Figure 2)
Figure 2: Human Development Index Ranking: India10
2012 136
2009 134
2006 126
2003 127
120 125 130 135 140
It is very obvious from graph that in the last decade the HDI score of India has been
stagnated, if scrutinize more closely than it declined. It happened in the period which is
touted as the golden decade as far as rapid economic growth is concerned. India
consistently figured among bottom fifty nations in the comity of 180 plus nations. The
HDR has deteriorated nine points in nine years from 2003 to 2012. When we see this
pathetic human development record of India vis a vis growth pattern of GDP, it
reinforces the belief in the grand failure of trickle-down effect and inequality brought
by disproportionate distribution of wealth created during this type of growth.
As economic growth sans equity was not enough, the scourge of high inflation hit the
lower strata of society very hard. The price rise of common commodity has had
10INDIA GROWTH STORY : DISBALANCING THE INEQUALITY & POVERTY
debilitating effect on the consumption basket of common people. In the most cases
they had to compromise with their nutritional security as relentless price rise of
common commodities, like pulses, milk, egg and meat has increased the cost of living
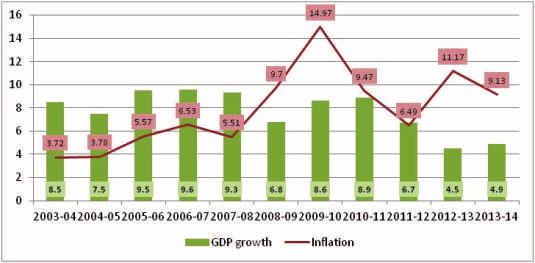
and impacted adversely on mass deprivation and poverty11. (Figure 3)
Figure 3: GDP Growth Rate and Inflation12
(CPI)
And now with the slowdown in economy and concomitant job market volatility (in
terms of job creation and stability of tenure) and stagnant wage rate has put the life and
livelihood of millions of people in peril. As half of India's $1.85-trillion economy is
informal, with 55%, only sub-Saharan Africa has a larger unorganised economy than
India's and as much as 84% of the non-farm workforce in India is informal13.
8 Majumdar, Rajshi, “Growth and Development: The Indian Experience” 2005
9 Human Development Reports, 2002 to 2012, accessible at http://hdr.undp.org/en/countries/profiles/IND
10 Ibid
11 http://www.thehindu.com/opinion/Readers-Editor/battling-food-inflation-state-people-and-
media/article106619.ece
12 Central Statistical Organisation(CSO) Estimates
http://www.inflation.eu/inflation-rates/india/historic-inflation/cpi-inflation-india-2013.aspx
http://www.livemint.com/Politics/p1HXxTk6vMf3A4a3oZ1p0O/India-slightly-lowers-FY14-growth-forecast-to-
49.html
13 http://articles.economictimes.indiatimes.com/2013-10-25/news/43395491_1_neelkanth-mishra-india-fall-
informal-economy
India Policy Foundation 11The Curious Case of
III Declining poverty:
AN ART OF
ARTIFICIAL CALIBRATION
W hile replying to Supreme Court query in the first affidavit dated 10th May
2011, whether planning commission imposed a uniform cap of 37.2% of
population as eligible beneficiary; planning commission responded by
saying a cap is needed for non universal benefit system. Later SC expressed certain
reservations based on computation on 2004-05 prices and passed directive “may
revise the norms of per capita account looking to the price index of May 2011 or any
subsequent dates14.” In pursuance of direction of SC, Planning commission in its
second affidavit to the Supreme Court on 20th September put the poverty line at Rs 965
per capita per month (Rs 32 per day) for urban areas and Rs 781 per capita per month
(Rs 26 per capita per day) in rural areas by taking the price levels of June 201115.
When taken in perspective in terms of family budget, the pertinent question is
appropriateness of Rs. 4, 824 per family per month in urban areas and Rs. 3,905 in rural
areas? It could be seen in a wider perspective of resulting in an exercise of exclusion of
families otherwise deserving social assistance. This meager and lower threshold level
of poverty line in light of spiraling food inflation is a poor commentary on level of
sensitivity and concern in the higher policy echelon. It also reflects poorly on how
ponderous institution like planning commission had become out of sync with ground
reality. This issue also highlighted the blatant ignorance and apathetic attitude
displayed by certain section of political class like Raj Babbar and Rasheed Masood
made insensitive remarks about cost of food.
12INDIA GROWTH STORY : DISBALANCING THE INEQUALITY & POVERTY
“Even today in Mumbai city, I can have a full meal at Rs. 12. No no, not vada paav (snack).
So much of rice, daal saambhar and with that some vegetables are also mixed," Mr
Babbar said. After Raj Babbar said a hearty meal in Mumbai can be bought for Rs. 12,
another Congressman, Rasheed Masood, has said Rs. 5 in Delhi is sufficient for the
same". “You can eat a meal in Delhi in Rs. 5, I don't know about Mumbai. You can get a
meal for Rs. 5 near Jama Masjid," Mr Masood said16.
The comments by two prominent congress leaders culminated into widespread public
outcry and condemnation poured in from all corners. This was not all enough when
Farooq Abdullah jumped the apathy bandwagon and said “The question is that you can
fill your stomach by spending Re 1 and cannot fill it even with Rs. 100. The question is
what you want to eat. We want the country to progress. These things are necessary to
take a country forward 17.”
The next twist in the saga of belittling gravity of issue like absolute poverty came from
Planning Commission again. In July 2013, the data released by PC claimed that the
percentage of the population living below the poverty line in India decreased to 22% in
2011-12 from 37% in 2004-05. Traditionally poverty in India is measured as the head-
count ratio of the population living below the official ‘poverty line’, which is calculated
using the methodology recommended by the Expert Group on Methodology for
Estimation of Poverty appointed by the Planning Commission for arriving at the
threshold consumption level of both food and non-food items. By this methodology
Poverty figures in India are obtained every five years as Consumer Expenditure Survey
(CES) is conducted by National Sample Survey Organization (NSSO). The Committee
calculated poverty levels for the year 2004- 05. Poverty levels for subsequent years
were calculated on the basis of the same methodology, after adjusting for the difference
in prices due to inflation. (Figure 4)
So has poverty waned as rapidly as claimed by Planning Commission, or has it been an
act of fine window dressing? Have 138 million people moved out of poverty during
2004-05 as claimed by Planning Commission?
India Policy Foundation 13Figure 4: National poverty estimates (% below poverty line) (1993 – 2012)18 Dr. Amartya Sen and Dr. jean Dreze in their book ‘An Uncertain Glory: India and its Contradictions’ demystifies the shrinking below poverty line population by attributing it to “density effect : the fact that many people are just a little below the poverty line, so that the small increase in per capita expenditure is enough to lift them above poverty line. And then density effect in turn reflects that the official poverty line abysmally low”. In fact, counting poor people in India has always been an exercise which often culminates into high decibel controversy. The discourse revolves more around poverty line than focusing on poor. In between, unanimity and consensus on ‘who are below poverty line’ usually remains conspicuous by its absence. The Arjun Sengupta committee, which was constituted by Ministry of Micro, Small and Medium Enterprise (MSME) for recommending support solutions to problems confronting unorganized sector has quantified the number of unorganized or informal workers - as those who do not have employment security, work security and social security - to 92% of total workforce. And based on an empirical measurement, the high congruence between this segment of the workforce and 77 percent of the population with a per capita daily consumption of up to Rs. 20 (in 2004-05) who are called "poor and vulnerable". 14
INDIA GROWTH STORY : DISBALANCING THE INEQUALITY & POVERTY
The number of persons belonging to this group increased from 811 million in 1999-00
to 836 million in 2004-05. The report scathingly remarked on the condition of informal
worker in growing economy “Such buoyancy in the economy did lead to a sense of
euphoria by the turn of the last century. However, a majority of the people, who did not
have even Rs. 20 a day for consumption, were not touched by this euphoria. About 79
per cent of the informal or unorganized workers belonged to this group without any
legal protection of their jobs or working conditions or social security, living in abject
poverty and excluded from all the glory of a shining India”19.
Dr. N.C. Saxena Committee was set up by the Ministry of Rural Development to advise it
on the suitable methodology for BPL Census and not for estimation of poverty.
However, in the Report submitted by the Expert Group on 21st August 2009, it was
mentioned that the percentage of people entitled to BPL status should be revised
upwards to at least 50%20. On this estimate N. C Saxena added “This is a step away from
the narrow definition of poverty we have been using, where the line is really what I call
a ‘kutta-billi’ line; only cats and dogs can survive on it”. 21
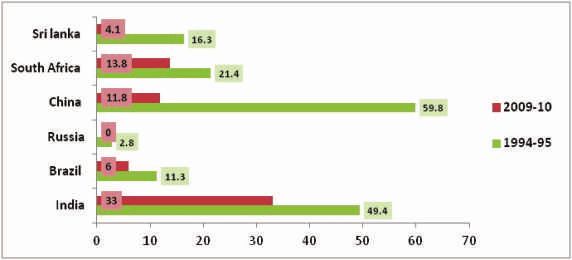
Figure 5: Poverty Headcount Ratio at $1.25 a Day (PPP) (% of population)22
India Policy Foundation 15The basic question which comes to mind that why does India not subscribe to internationally accepted $1.25 per day per person as threshold income for determining the below poverty line population? Rather it depends more on data chicanery and empty oratory to present itself as world emerging superpower. The real concern lies- despite keeping low benchmark (Rs 32 for Urban and Rs 26 for Rural per person per day) - 269.7 million people still live below it. How are these people supposed to live? This terrifying but hidden nature of mass poverty, the questions on dignity of life of these folks, the debate on appalling living conditions in which they endure, the tale of precariousness of daily survival and multiple deprivations suffered, rarely get noticed in the corridors of policy palaces and media towers. When seen in international perspective, in the last 15 years or so India has fared poorly when compare to another members of BRICS (Brazil, Russia, India, China and South Africa) in pulling out people out of absolute poverty net. It is obvious from the table that while China managed to reduce number of people who earn less than $1.25 a day from staggering 59.8% (1995 )to 11.8% (2009), India despite shouting ‘Garibi Hatao’23 from rooftop in 70s failed miserably to ensure social justice to its citizen. In south Asia, Sri Lanka despite being torn up due to civil war fared much better than India. 14 http://planningcommission.nic.in/aboutus/speech/spemsa/pr_dch0309.pdf 15 http://www.downtoearth.org.in/content/planning-commission-sc-rs-26-person-day-adequate-poverty-line 16 http://archive.indianexpress.com/news/after-raj-babbar-row-another-congressman-says-can-have-meal-in- delhi-for-less-than-rs-5/1146682/ 17 http://ibnlive.in.com/news/re-1-enough-to-fill-your-stomach-it-depends-on-what-you-eat-says- farooq/409486-37-64.html 18 Press Note on Poverty Estimates, 2011 – 12, Planning Commission 19 Report of the Expert Group to Review the Methodology for Estimation of Poverty (2009) Planning Commission 20 “ Report of the Expert Group to Advise the Ministry of Rural Development on the Methodology for conducting Below Poverty Line Census for 11th Five Year Plan, August 2009”, Chairman N C Saxena 21 http://www.thehindu.com/news/national/beyond-the-debate-govt-accepts-65-indians-are- poor/article4948698.ece 22 The World Bank (http://data.worldbank.org/indicator/SI.POV.DDAY/countries?page=3) 23 https://www.google.co.in/search?q=garibi+hatao&ie=utf-8&oe=utf-8&aq=t&rls=org.mozilla:en- US:official&client=firefox-a&channel=sb&gfe_rd=cr&ei=b8EFU8jvEazW8gf374CIDQ 16
INDIA GROWTH STORY : DISBALANCING THE INEQUALITY & POVERTY
IV Islands of Prosperity
F amous economist Simon Kuznets (1955) initiated the idea that the inequality
characterizing income distribution exhibits a non monotonic trend along the
process of economic development: it appears to widen during a society’s
transition from a pre industrial to an industrial system, it remains stable for a while and
narrows as more mature stages of growth are reached.24 Thus income distribution
along a country’s development path became known as the Kuznets Curve an inverted U
shape relationship between income per capita and personal income inequality;
needless to emphasize the inapplicability of this model in India’s case, where income
inequality became glaringly obscene with economic growth.
The measurement of inequality in India is not done through income but on
consumption expenditure as computed by the National Sample Survey Organization
(NSSO). Wage inequality has driven more general income inequality; India has
increasingly became unequal over the last two decades—India's Gini coefficient, the
official measure of income inequality, has gone from 0.32 to 0.38, with 0 being the ideal
score and 1 being worst.25
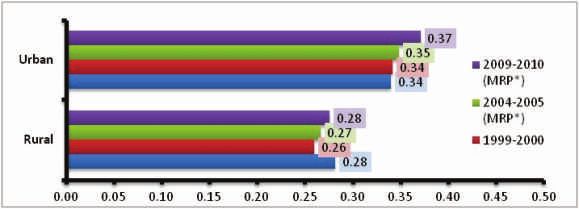
And the most worrisome trend emerging recently has been increase in inequality in
rural areas - the coefficient rose to 0.280 in 2011-12 from 0.267 in 2004-05 and to an
all-time high of 0.37 from 0.35 in urban areas - it was 1993-94 when Gini coefficient
touched 0.28- as it has risen for the first time since 1977-78, when there was a rise in
the coefficient from 0.27 in 1973-74 to 0.34 in 1977-78.26(Figure 6)
India Policy Foundation 17Figure 6:
Gini Coefficient of Distribution of Consumption: 1993-94 to 2009-10 27
It is evident from the graph that in last decade and half, instead of decreasing, the
inequality has embedded firmly and increased. The bottom 10% of people’s share of
income decreased from 4% in 1994 to 3.7% in 2010 while top 10% of people has seen
rise in the income simultaneously. (Figure7)
Figure 7: Percentage share of income 28
18INDIA GROWTH STORY : DISBALANCING THE INEQUALITY & POVERTY
The disappointing trend is testified by bottom 20% and top 20% people’s share of
wealth. This nullifies the models of top down approach of wealth distribution and
authenticates glaring income disparity.
The careful analysis of mean per capita monthly consumption expenditure data from
NSSO quinquennial surveys of household consumption over thirty year, disaggregated
across deciles allows us to get a glimpse into the inequality of such consumptions. The
share of the poorest 20% population in terms of the monthly per capita consumption
expenditure in total consumption (i.e consumption accounted for by the poorest one
fifth of the population) in the rural areas declined from 9.6% in 1993-94 to 9.5% in
2004-05 based on (Uniform Reference Period – URP method) and NSS 2009-10
(Modified Reference period – MRP method) reported a slightly increased level i.e.
9.8%. In the urban areas the share of the poorest 20% population, declined from 8% in
1993-94 to 7.3% in 2004-05 and to 7.1% in 2009-10.
This decrease in the share of consumption expenditure for the poorest quintile is
indicative of growing inequities, particularly in the urban areas. It can be concluded
that average consumption of bottom 20% of urban India has stagnated or increased
only marginally in the period of boom economy between 1993-94 to 2009-10, while
the consumption of the top decile increased by 30% in the same time. While in rural
India this gap remained same. It is a sharp contrast to urban area where the gap in
income and consumption between richest and poorest decile steeped sharply. 30
Table 1:
Share of poorest quintile in national consumption29
1993-94 2004-05 2009-10
(URP) (URP) (MRP)
Rural 9.6 9.5 9.8
Urban 8 7.3 7.1
India Policy Foundation 19The level of disproportionate wealth distribution can be fathomed out from a recently released WEALTH-X report on Ultra High Net worth (UHNW) individuals (those having net asset $30 million. It presents genuine commentary on income inequality of India. As number of UNHW stand 7,850 in India with combined wealth of $935 billion (half of India’s GDP), and number of people with more than $1 billion stand 103, holding $180 billion. The regional distribution of this wealth is also skewed with 50% UHNW individuals are based in the metros of Mumbai and Delhi, and more than 90% in top 10 cities. Highlighting massive urban rural divide as far as wealth distribution is concerned.31 Christine Lagarde, Managing Director of International Monetary Fund (IMF) remarked that “the net worth of Indian billionaire community has soared 12 fold in 15 years- enough to eliminate absolute poverty twice over in the country, where income inequality is also on the rise”. 32 24 Kuznets (1955) formulates his proposition using available data from the industrialization period for the United States, England and Germany http://www.wiwi.uni-frankfurt.de/~elsas/On%20Growth%20and%20Income%20distribution- final%20version.pdf 25 SAARC development Goals, India Country Report, August 2013, p 38 26 http://www.business-standard.com/article/economy-policy/rich-poor-gap-widens-in-india- 113081000072_1.html 27 *MRP - Mixed Reference Period [Source : Estimates of Planning Commission; NSSO 61st Round 2004-05, 66th Round 2009-10] http://planningcommission.nic.in/data/datatable/ S no 49 Note: Gini coefficient is calculated assuming that all individuals within each state have gross income equal to per capita GSDP. 28 The World Bank accessible at (http://data.worldbank.org/indicator/SI.POV.DDAY/countries?page=3) 29 NSS report 538: Level and Pattern of Consumer Expenditure, Alternatively accessible at Millennium Development Goals, India Country Report 2014, Social, Statistics Division, Ministry of Statistics and Programme Implementation, Government of India 30 http://www.thehindubusinessline.com/opinion/columns/c-p-chandrasekhar/consumption-inequality-in- india/article3569657.ece 31 WEALTH-X : Connecting you to Wealth http://www.wealthx.com/wealthxubswealthreport/ 32 http://www.deccanchronicle.com/140204/news-businesstech/article/income-inequality-rise-countries-india- imf 20
INDIA GROWTH STORY : DISBALANCING THE INEQUALITY & POVERTY

                               Hungry People,

          V                    Dying Farmers and
                               Rotting Grains

T      he heart wrenching Indian story of privation, hunger, and under nutrition is
       notorious across all the continents. The tale of silent suffering is real and even
       more distasteful if observed from close quarters. India had witnessed
innumerable famines in last 200 years; few were unparalleled in magnitude and scale
of human sufferings, like famine of Bengal in 1943 in which unspeakable human
tragedy unfolded and swept away 6-7 million people.33 In recent times, the famines
stopped passing by, but loss of life and vitality in form of extreme hunger is widespread
and recurring. In most of the cases it even passes unnoticed and untraced of public
graze and media scrutiny. Till 1970s most of the hunger deaths were the outcome of
chronic scarcity of foodgrains, but Green Revolution helped us to wipe out the blot of
being leveled grain importing country. In subsequent years, foodgrain production
increased almost four-fold from about 50 million at Independence to more than 198
million metric ton in 1996-9734 to 263.20 million metric ton in 2012-13. 35 Despite
registering record production India continued to languish far behind in emerging
countries with the rank of 63 out of 78 countries in Global Hunger Index (GHI)
rankings.36 The GHI was designed by International Food Policy Research Institute
(IFPRI), which measures and track hunger globally uses three major indicators viz.
undernourishment, child underweight, and Child mortality.37

It is a sad commentary but India performs deplorable on all the indicators. It says that
19 countries still have level of hunger that is still alarming; from Asia, India is the only
country. India and Timor Leste have both more than 40% of children under 5 are
underweight with high prevalence of hunger. 38

                                                                        India Policy Foundation   21
According to UNICEF, India fares worst than sub-Saharan country in malnutrition, one
in every three malnourished children in the world lives in India and 47% are
underweight and at least 16% are wasted. It is needless to add that many of these
children are severely malnourished. It is scientifically proven that malnourishment
impinges cognitive, physical, social and emotional growth of children and by UNICEF
estimation about 50 percent of all childhood deaths in India are attributed to
malnutrition.
On the top of that, there are 74 per cent of children under the age of three and 90 per
cent of adolescent girls and than 50 per cent of women are anemic in India, Anaemia -
which has a debilitating effect on growth and development of children, also puts
innocent children’s life in peril.39
This extremely worrying and disturbing trend on malnutrition was also highlighted by
“The Hunger and Malnutrition (HUNGaMA)” report by the Naandi Foundation in 2011.
The report had found that as many as 42 per cent of under-fives are severely or
moderately underweight and that 59 per cent of them suffer from moderate to severe
stunting, meaning their height is much lower than the median height-for-age of the
reference population. It also found that of all the stunted children, about half are
severely stunted and about half of all children are underweight or stunted by the time
they are two years.40 Unfortunately this report was released by PM which dubbed
malnutrition as national shame but serious commitment on this front still has to see
light of day.
Table 2: India’s Position in Different Indicators of GHI41
Proportion of Prevalence of Under 5
undernourished in undernoorishment in mortality rate
the population (%) children under 5 years (%)
1990-92 26.9 59.5 11.4
1994-96 25.2 45.9 10.1
1999-01 21.3 44.4 8.8
2004-06 20.9 43.5 7.5
2010-12 17.5 40.2 6.1
22INDIA GROWTH STORY : DISBALANCING THE INEQUALITY & POVERTY
So, what explains the criminal paradox of plenty and penury, surely it is not the
availability but distributional challenge associated with food management, is where
our country as whole is failing, despite very effective Public Distribution System
models working in states like Chattisgarh; which showed remarkable promise by
reducing leakages to zero42 and delivering near universal supply at very low price by
implementing slew of structural and legal reform coupled with serious focus on
governance.43
Figure 8: Trend in estimated Per Capita Calorie Intake 44
The sad reality of nutritional intake in India is revealed by NSSO surveys on Nutrition,
in both urban and rural areas, declining trend has been observed in the estimated and
per capita calorie intake per day during and there was nearly 6% decline in 2009-10 in
both rural and urban areas compared to 1993-94. Further, the declining trend in per
capita calorie intake per day during 2004-05 to 2009-10 was reported both in rural and
urban Areas however the trend of decline was more in urban.
It’s all a question of priority as food has never been on top of national agenda list. While
the production soared, government turned blind eye to storage and distribution issues.
Massive procurement with imprudent planning only worsened the situation in which
foodgrains rotted in open while million slept starved.
In an RTI reply, it came to light that at least 17,546 tonnes of foodgrains was damaged
between 2009-10 and July 2012 in Food Corporation of India (FCI) godowns.45 In the
past few years, the United Progressive Alliance has made massive investment in
building 2.5 lakh panchayat ghars these structures have been provided with a
India Policy Foundation 23computer link-up and are also being dotted with solar power. Isn’t it strange that while the government has the resources to build panchayat ghars, it has no money to construct warehouses across the country meanwhile, since 2004-05, UPA has doled out Rs 32 lakh-crore by way of tax exemptions to corporate and business houses. This category is dubbed as ‘revenue foregone’ in budget document which stood Rs 5.73 lakh crore in 2013-14.46 The poverty and debt within farming community of India has one harrowing tale to share. The country has witnessed over a quarter of a million farmers’ suicides between 1995 and 2010. The National Crime Records Bureau’s (NCRB) latest report on ‘Accidental Deaths & Suicides in India’ places the number of farmer’s suicide for 2010 at 15,964. The cumulative figure of 16-year total from 1995 to 2012, when the NCRB started recording farm suicide data, stands 2,56,913. It is one of the most deplorable records of suicides of this kind in modern human history. As many as 1,35,756 farmers killed themselves in the 2003-10 period. For 1995-2002, the total was 1,21,157. On average, this means the number of farmers killing themselves each year between 2003 and 2010 is 1,825 higher than the numbers that took their lives in the earlier period. 47 33 Dreze, J. and Sen, A. (1989), “Hunger and Public Action” (Clarendon, Oxford) 34 http://pib.nic.in/feature/feyr98/fe0798/PIBF2107983.html 35 http://www.thehindu.com/news/national/at-26320-million-tonnes-this-year-foodgrain-production-touches-a- record-high/article5691292.ece 36 Global Hunger Index Report, 2013 37 http://www.ifpri.org/ghi/2013/concept-global-hunger-index 38 Global Hunger Index Report, 2013, p.16 39 http://www.unicef.org/india/children_2356.htm 40 HUNGAMA survey 2011 Report, Accessible at http://hungamaforchange.org/ 41 2013 Global Hunger Index, Appendix B, data Underlying the Calculation of the 1990/95, 2000/ 05, and 2013 GHI Scores p 51 42 http://www.livemint.com/Opinion/TTLqU0Cg2iF4hYtJSHtMRI/PDS-a-story-of-changing-states.html 43 http://ibnlive.in.com/news/how-the-pds-is-changing-in-chattisgarh/137153-7.html 44 NSS report 538: Level and Pattern of Consumer Expenditure, Alternatively accessible at Millennium Development Goals, India Country Report 2014, Social, Statistics Division, Ministry of Statistics and Programme Implementation, Government of India 45 http://timesofindia.indiatimes.com/india/Over-17000-tonnes-of-grains-wasted-in-3- years/articleshow/22056182.cms 46 http://www.rediff.com/news/column/indias-food-crisis-rotting-food-grains-hungry-people/20130401.htm 47 National Crime Record Bureau (NCRB) Data, also available at http://www.thehindu.com/multimedia/archive/00820/Farm_Suicides__All__820602a.pdf 24
INDIA GROWTH STORY : DISBALANCING THE INEQUALITY & POVERTY

       VI                     Unconscientious
                              Intentions

    “A gift consists not in what is done or given, but in the
    intention of the giver or doer” 48

I   t is not that the malaise of poverty and inequality are incurable here. But what
    intrigues most that why in the last 10 years, when growth momentum was on its
    peak, Government relied more on grandiose talk and innumerable ineffective
schemes than systematic approach. The evils of crony capitalism and corruption with
potent mix of policy indecisiveness in many sectors hampered growth to the hilt. The
spate of scams ranging from spectrum to coal has undermined the credibility and
questioned intention in public policy makers. The democracy in definition survived,
but its practice, which is its essence, remained lost throughout last decade.

The institution of Central Bureau of Investigation (CBI) has gradually degenerated into
arm twisting tool for political expediency than being federal investigative agency. In
May 2013, the Supreme Court openly questioned the credibility of CBI probe into the
coal scam and in turn scathingly indicted CBI by calling it a "caged parrot speaking in its
master's voice" and “It's a sordid saga that there are many masters and one parrot".49
The apex court also remarked that "The heart of the report was changed on suggestions
of Government officials,”. 50

                                                                       India Policy Foundation   25
Causative Factors and Manifestations of Poverty and Inequality
Causative
Manifestations
Failed Trickle -Down Effect
Jobless Gro wth, Pervasive Hunger, Malnutrition,
Unemployment Public Service
Inaccessible Quality Inaccessibility to Quality
Education Education, Skill Deficit
Corruption in Public Voicelesness and
Services Delivery choicelessness
Poverty
Unremunerative Agriculture and Agricultural indebtness and
Inequalit Farm suicides
Historical Causes (Casteism, y
Forced migration,
Colonialism etc) regionalism
Crony Capitalism
Urban slums, Lack of
Sanitation and Disease
Financial Exclusion Environmental Degradation
Lack of Political Willpower
26INDIA GROWTH STORY : DISBALANCING THE INEQUALITY & POVERTY
It raises serious questions on the independence of CBI and obnoxious level of political
interference into probe of such serious scam. It also reflects the distressing reality on
how an institution of national importance could be tamed to show subservience to its
political masters.
Another sign of deceptive intention was reflected in the manner in which Lokpal issue
was handled, even Narayan Murthy expressed his sadness in one interview over
handling of this issue by PM and Sonia Gandhi.51 Even whole country poured in one the
street protesting over brazen corruption of UPA Government. In CNN-IBN State of the
Nation Survey, conducted by Centre for the Study of Developing Societies (CSDS),
which explicitly portrayed the mood of nation, confirmed that corruption has become
more pervasive and big factor with the aam aadmi, both in urban and rural areas, but
more so among the educated classes.
A decisive 60 percent of those surveyed felt that the UPA was running a “Very corrupt”
or “Somewhat corrupt” Government, with urban respondents showing an even higher
percentage of disgust at 66 percent. That’s two out of three people. As many as 71 %
college educated people agreed with above statement. 52
The India cannot turn a blind eye to the corruption that keeps people poor. Corruption
and poverty unfortunately go hand-in-hand, threatening the lives of too many people.
It aggravates more when people are forced to bribe to get essential services like health
and water the toll can be horrifying. The effects of corruption are personal and they are
devastating.
Corruption leaves children without mothers, families without healthcare, people
without food, the elderly without security, and businesses without capital.53
Transparency International has established through their research that less
corruption means less maternal mortality, better literacy among young people and
better access to sanitation.
There is no gainsaying that the wedge between shining India and suffering India will
keep growing unless strong systemic reforms are initiated for promoting sustainable
and inclusive growth not very similar to what has been done since 1991. There could
not have been better summation of all what has been written above that “societies
India Policy Foundation 27cannot have both, perfect equality and perfect efficiency and must choose how much of one is to sacrifice for other.” 54 Another crucial intervention which must be resorted to without any delay is to dismantle existing poverty line and fix minimum threshold income which should not be sustenance based. Rather it should be kind of empowerment line. In a recent report by McKinsey Global Institute,55 released in February 2014, a new Empowerment Line has been proposed which takes a more holistic measure of Income deprivation. The Empowerment Line considers minimum economic cost of household which is required to fulfill eight basic needs: food, energy, housing, drinking water, sanitation, healthcare, education and social security. It calculates the level of consumption required to meets these needs in India, assuming availability of infrastructure and access point at efficient cost. This line provides for a new national vision for standard of living for all citizens. It is worth mentioning that the minimum standards of consumption are 1.5 times higher than those mentioned in official poverty line. 48 Seneca, Moral Essays, Volume III: de Beneficiis 49 http://www.thehindu.com/news/national/cbi-urges-supreme-court-to-free-the-agency-from-being-a-caged- parrot/article5391613.ece 50 http://timesofindia.indiatimes.com/india/CBI-a-caged-parrot-heart-of-Coalgate-report-changed-Supreme- Court/articleshow/19952260.cms 51 http://www.ndtv.com/article/india/upa-s-handling-of-lokpal-issue-sad-narayana-murthy-112605 52 http://www.firstpost.com/politics/stench-of-corruption-has-stuck-to-upa-all-india-survey-2-57473.html 53 http://www.huffingtonpost.com/huguette-labelle/to-end-poverty-you-have-t_b_4396930.html 54 http://www.economist.com/news/finance-and-economics/21597931-up-point-redistributing-income-fight- inequality-can-lift-growth-inequality 55 From Poverty to Empowerment: India’s Imperative to Jobs, Growth, and Effective Basic Services, February 2014, McKinsey Global Institute 28
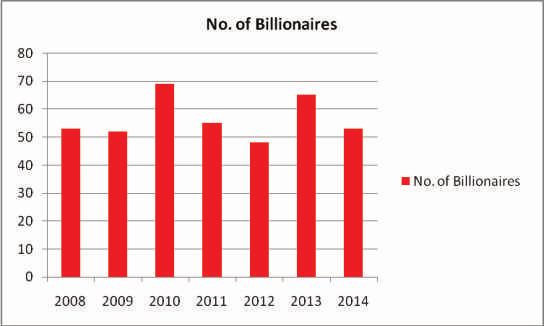
List of Indians who are Billionaires

                                  INDIA
                               GDP: $1.9 Tln
                             Population: 1.2 Bln
                     Total Net Worth: $191.5 Bln
World Rank     Name                                Net Worth
40.            Mukesh Ambani                       $18.6 bln
52.            Lakshmi Mittal                      $16.7 bln
61             Azim Premji                         $15.3 bln
82.            Dilip Shanghvi                      $12.8 bln
102.           Shiv Nadar                          $11.1 bln
191.           Kumar Birla                          $ 7.0 bln
244.           Sunil Mittal & family                $ 5.7 bln
281.           Anil Ambani                          $ 5.0 bln
281.           Micky Jagtani                        $ 5.0 bln
295            Savatri Jindal & family              $ 4.9 bln
295.           Cyrus Poonawalla                     $ 4.9 bln
295.           Shashi and Ravi Ruia                 $ 4.9 bln
396.           Uday Kotak                           $ 3.8 bln
446.           Adi Godrej & family                  $ 3.5 bln
446.           Jamshyed Godrej & family             $ 3.5 bln
506.           Desh Bandhu Gupta                    $ 3.2 bln
551.           Kushal Pal Singh                     $ 3.0 bln
580.           Anil Agarwal                         $ 2.9 bln
609.           Gautam Adani                         $ 2.8 bln
731.           Brijmohan Lall Munjal                $ 2.4 bln
731.           Pankaj Patel                         $2.4 bln
764.           Indu Jain                            $ 2.3 bln
796.           Kalanithi Maran                      $ 2.2 bln
828.           Malvinder & Shivinder Singh          $ 2.1 bln
931.           Subhash Chandra                      $ 1.9 bln
931.           Chandru Raheja                       $ 1.9 bln
973.           Rahul Bajaj                         $ 1.85 bln
973.           Ajay Kalsi                          $ 1.85 bln
988.           Rashid Naoroji                      $ 1.80 bln
988.           Ravi Pillai                         $ 1.80 bln

                                                                India Policy Foundation   29
World Rank Name Net Worth
988. Sunny Varkey $ 1.80 bln
988. MA Yusuf Ali $ 1.80 bln
1046. NR Narayan Murthy $ 1.70 bln
1092. Venugopal Dhoot $ 1.60 bln
1092. Mangal Prabhat Lodha $ 1.60 bln
1143. Benu Gopal Bangur $ 1.55 bln
1154. Murali Divi $ 1.50 bln
1154. Senapathy Gopalkrishnan $ 1.50 bln
1154. Ravi Japuria $ 1.50 bln
1203. Ajay Parimal $ 1.45 bln
1210. Nandan Nilekani & Family $ 1.40 bln
1210. Ranjan Pal $ 1.40 bln
1284. Baba Kalyani $ 1.30 bln
1356. Ashwin Dani $ 1.25 bln
1372. Rakesh Jhunjhunwala $ 1.20 bln
1372. Nirav Modi $ 1.20 bln
1372. Mofatraj Munot $ 1.20 bln
1442. Brij Bhushan Singh $ 1.15 bln
1465. Yusuf Hamied $ 1.10 bln
1465. Lachhman Das Mittal $ 1.10 bln
1540. K Dinesh & family $ 1.05 bln
1540. Vikram Lal $ 1.05 bln
1565. Harinderpal Banga $ 1.00 bln
1565. TS Kalyanaraman $ 1.00 bln
1565. BR Shetty $ 1.00 bln
1565. Jitendra Virwani $ 1.00 bln
Source : Forbes India, April 4, 2014 Issue
00
30Source : Forbes India, April 4, 2014 Issue
http://theanksden.wordpress.com/2008/03/06/the-indian-billionaires-forbes-2008/
http://forbesindia.com/article/web-special/india-has-52-billionaires;-mukesh-ambani-richest/7192/1
http://www.forbes.com/lists/2010/77/india-rich-10_Indias-Richest_Rank.html
http://www.forbes.com/sites/naazneenkarmali/2011/03/10/the-worlds-billionaires-2011the-india-story/
http://wiseinvestmentideas.blogspot.in/2012/03/48-indian-billionaires-from-forbes-list.html
India Policy Foundation 31IPF’s Publications
1. Terrorism and Indian Media 80.00
2. vkradokn vkSj Hkkjrh; ehfM;k 80.00
3. Deceptive Equality (Deconstructing the Equal Opportunity Commission) 50.00
4. Hkzked lekurk ¼leku volj vk;ksx dh leh{kk½ 50.00
5. Census 2011: Blinkered Vision, Fragmented Ideas 50.00
6. tux.kuk 2011% ckf/kr n`f"V fo[kafMr fopkj 50.00
7. U;w ehfM;k% pqukSfr;k¡ vkSj laHkkouk,¡ 50.00
8. The Issue of Enemy Property and India’s National Interest 50.00
9. jk"Vªh;rk dk ;{k iz'u\ ¼'k=q laifÙk ij lkaiznkf;d jktuhfr½ 35.00
10. vtht cuhZ dh iqLrd Þvkj,l,l dh lkft'k&26@11 ¼lp ;k >wB dk iqfyank\½ 50.00
11. "kM+;a= fl)kar ds [kyuk;d csudkc 50.00
12. phuh foLrkjokn ¼Hkkjrh; lhek dk vfrØe.k½ 50.00
13. yksdra= ij izgkj ¼ukxfjd vf/kdkjksa dk guu½ 50.00
14. lkaçnkf;d ,oa yf{kr fgalk fo/ks;d
¼yksdra=] la?kokn] iaFkfujis{krk ij çgkj½ 30.00
15. Hole in the Bucket
(Examining Prevention of Communal & Targeted Violence Bill-2011) 30.00
16. NAC’s Hindu Apartheid Law
(Prevention of Communal & Targeted Violence Bill-2011) 25.00
17. The Dragon Tale (Dubious Design, Dangerous Liaison) 60.00
18. jk"Vªh; lykgdkj ifj"kn cuke jk"Vªh; ,drk ifj"kn
¼lkaiznkf;d ,oa yf{kr fgalk fo/ks;d ij Vdjko½ 20.00
19. Cross Purposes 80.00
20. Hkzked mís'; 80.00
21. ledkyhu lekt esa cqf)thoh 30.00
22. Intellectuals in Contemporary Society 30.00
23. Assam: Bending Over Backwards
(Trespassing Causes Demographic Damage) 30.00
24. Judiciary, Gender & Uniform Civil Code 50.00
25. Predicament of Minorities in Pakistan 100.00
26. ikfdLrku esa vYila[;d! 80.00
27. Hindus Betrayed (Religious Cleansing in Bangladesh) 80.00
28. ckaXykns'k esa fgUnqvksa ij laxfBr fgalk 80.00
32Dr. Rahul Singh is an Associate Professor at
Birla Institute of Management Technology (BIMTECH),
Greater Noida (U.P.)ISBN : 978-81-925223-5-7
D-51, First Floor, Hauz Khas, New Delhi - 110016
I'M - 9312431409
Tel.: 91+11-26524018
Fax: 91+11-46089365
E-mail: indiapolicy@gmail.com
Website: indiapolicyfoundation.org
Price : Rs. 50/-You can also read