INFLUENCE OF NANO VC ON THE STRUCTURAL AND MAGNETIC PROPERTIES OF MNALC ALLOY
←
→
Page content transcription
If your browser does not render page correctly, please read the page content below
www.nature.com/scientificreports
OPEN Influence of nano‑VC
on the structural and magnetic
properties of MnAlC‑alloy
Vitalii Shtender1*, Henry Stopfel2,3, Daniel Hedlund2, Dennis Karlsson1,
Rajasekhar Pothala3, Björn Skårman4, Fredrik Olsson4, Hilmar Vidarsson4,
Gabriella Andersson3, Peter Svedlindh2 & Martin Sahlberg1
Alloys of Mn55Al45C2 with additions of VC nano-particles have been synthesized and their properties
evaluated. The Mn55Al45C2(VC)x (x = 0.25, 0.5 and 1) alloys have been prepared by induction melting
resulting in a high content of the ferromagnetic τ-phase (> 94 wt.%). Powder X-ray diffraction indicates
that nano-VC can be dissolved in the alloy matrix up to 1 at.%. On the other side, metallography
investigations by scanning electron microscopy and scanning transmission electron microscope
show inclusions of the nanosized additives in the microstructure. The effect of nano-VC on the grain
and twin boundaries has been studied by electron backscattering diffraction. The magnetization has
been measured by magnetometry up to 9 T while the domain structure has been studied using both
magnetic force microscopy as well as Kerr-microscopy. For nano-VC contents above 0.25 at.%, a clear
increase of the coercive force is observed, from 57 to 71 kA/m. The optimum appears to be for 0.5 at.%
nano-VC which shows a 25% increase in coercive force without losing any saturation magnetization.
This independent increase in coercivity is believed to originate from the nano-VC reducing the overall
magnetic domain size. Overall, we observe that addition of nano-VC could be an interesting route to
increase the coercive force of MnAl, without sacrificing saturation magnetization.
The mechanical-to-electrical energy conversion or vice versa is a key technology for the renewable energy and
electro-mobility markets. The generators and converters used for example in electric cars or wind turbines require
the use of permanent magnets. The permanent magnet market nowadays is roughly comprised of hexagonal
ferrites and the rare-earth neodymium-based magnets, where Alnico and SmCo5 based magnets only play a
minor role. After the rare-earth crisis in 20111, increasing attention has been placed on finding the so-called
gap permanent m agnets2 with performance exceeding those of hexagonal ferrites. One potential candidate is
MnAl, which has enough anisotropy3 to be a permanent magnet of gap performance, i.e. to be able to supersede
hexagonal ferrites but not rare-earth magnets. In the Mn–Al phase diagram4, there is only a single ferromagnetic
phase, τ-MnAl, which is metastable5. The compound was discovered by Kono in 19586 and found to be ferro-
magnetic by Koch7 in 1960 but has still not been realized as a commercial product despite promising properties
such as high saturation magnetization ( MS ), high Curie temperature (TC ), high magnetocrystalline anisotropy
( K1) and a good maximum theoretical energy product ((BH)max).
There are mainly two reasons why MnAl has not yet been commercialized. One is that before the rare-earth
crisis, there was little to no incentive to develop gap magnets. The other is a more fundamental material issue
on the microstructural level. The celebrated Brown’s paradox8 on the coercive force ( Hc ) of a material gives
insight on why the coercive force never reaches even nearly the upper limit of the anisotropy field. According
to Kronmüller’s e quation9,
2αK1
Hc = − Deff MS,
µ0 MS
this is mainly due to the microstructure’s ability to pin and nucleate the field. In Kronmüller’s equation α is a
dimensionless factor (for most materials
www.nature.com/scientificreports/
has been placed on achieving phase pure samples through a viable synthesis method. This can be done through,
for instance, drop synthesis10, strip casting11, gas atomization12 and melt spinning13. It is possible to stabilize the
metastable τ-phase and thus improve purity through extra alloying with for instance C14 or Ga15. For a general
overview of synthesis methods see e.g. Chaturvedi et al.16. Two recent studies about phases in the Mn–Al–C
systems were presented by Bajenova et al.17,18.
In a recent study, nanoparticles of rare earths (RE) were added in MnAl (but without carbon) as
(Mn0.5+xAl0.5-x)100-yREy (0.01 ≤ x ≤ 0.09, 0.1 ≤ y ≤ 1.0)19,20, which created nanoprecipitates of ~ 20 nm size that
helped to pin domain walls and thus realizing a coercivity as large as 420 kA/m (5.43 kOe). We therefore, chose
Mn55Al45C2 as base material for our investigations since it is more stable and the performance is more promising
compared to the C-free τ-MnAl. The goal was to prepare Mn55Al45C2 with well dispersed nanoparticles to create
pinning sites for domain walls. To achieve this, we added different amount of nano-VC to the M n55Al45C2 base
compound to elucidate its effect on the microstructure and magnetic properties.
Experimental details
Mn55Al45C2(VC)x (x = 0, 0.25, 0.5, 1 and 3.5) alloys (~ 15 g each) were synthesized by induction melting. High
purity raw materials have been used as starting materials for synthesis of the Mn55Al45C2(VC)x alloys: Mn pow-
der (Mn powder from Höganäs AB, purity 99.9%), Al (Gränges SM, purity 99.999%), C (Highways interna-
tional, purity 99.999%), VC nanopowder (High purity VC nanopowder from INSCX exchange, purity > 99%,
size 80–100 nm). Firstly, powders of Mn and nano-VC were weighed, well mixed and pressed into pellets in a
glovebox. Appropriate amounts of Al and C were put together with the Mn55(VC)x-pellets in an Al2O3-crucible.
Afterwards the crucible was transferred to a high frequency induction furnace and vacuum pumped for 1 h.
The melting was done by introducing 5 N Ar gas to have an atmosphere of 400 mbar. At the highest temperature
(1300–1500 °C) the temperature was kept for 1–3 min to form a homogeneous solution. Finally, the furnace
was switched off, followed by natural cooling to room temperature. The total mass loss during synthesis was
less than 2 wt.%. In the event of larger losses, more Mn was added to compensate as for these alloys only Mn
evaporates during melting.
All samples were characterized using a Bruker D8 powder X-ray diffractometer with a Lynx-eye position
sensitive detector and Cu-Kα radiation on a zero-background single crystal Si sample holder. Phase analysis
and Rietveld refinements of the X-ray data were done with the GSAS suite software21. For the Rietveld refine-
ment of the PXRD we have used following information from literature14: the main τ-phase is a tetragonal L 10
superstructure (P4/mmm, AuCu-Ι type) with interstitial of C at [1/2 1/2 0], γ2 phase (R3m, Al8Cr5-type) and
VC (Fm-3m, NaCl-type).
Microstructural evaluations were carried out using scanning electron microscopy (SEM), energy-dispersive
X-ray spectrometry (EDS), electron backscattering diffraction (EBSD), magnetic force microscopy (MFM) as
well as magneto-optical Kerr effect (MOKE) microscopy. Samples were cut in an Accutom-50 and subsequently
mounted in Levofast resin and bakelite PhenoCure™, grinded and polished down to 1 µm by a standard process.
The polishing was done with OPS-S non-drying colloidal silica suspension for 5 min in order to improve plane-
ness and for relief polishing. Before etching, the samples were analyzed with a light optical microscope (LOM) in
a Zeiss Axio Imager M2m microscope. They were afterwards etched in a diluted modified Keller’s reagent: with
HCl 6 ml, HNO3 3 ml, HF 1 ml and H2O 290 ml. Samples were analyzed in a field emission scanning electron
microscope (FE-SEM) Hitachi SU6600 equipped with an EDS system (Bruker EDX XFLASH 5010). Furthermore,
the EBSD experiment was done using a Zeiss Merlin equipped with a Nordlys Max detector and evaluated by
the AZtec HKL software. Characterization at high magnification was done using an FEI Titan Themis 200 scan-
ning transmission electron microscope (STEM) equipped with SuperX EDS and spherical aberration corrector.
The TEM specimen was prepared by the in-situ lift-out technique in a Zeiss Crossbeam 550 focused ion beam
scanning electron microscope (FIB-SEM). The surface was protected with Pt and a final polishing step using a
5 kV ion beam was utilized to minimize beam damage from the preparation.
Magnetic force microscopy (MFM) was performed using a Bruker Dimension Icon system. Images were pro-
cessed by the software G WYDDION22 using background correction and flattening. Magnetic hysteresis curves
were measured at 300 K using a Quantum Design PPMS with a maximum applied field of 9 T. The samples were
corrected for demagnetizing effects.
An evico magnetics Kerr microscope, with motion correction since the forces on the samples are rather
strong, was used for magnetic domains observation. Room temperature Kerr microscopy studies were carried
out in longitudinal geometry, i.e. applying an in-plane magnetic field parallel to the plane of incidence. In this
configuration, out-of-plane components are dominating the magnetic c ontrast23.
Results and discussion
Synthesis and phase analysis. Previous investigations on the carbon stabilized τ-Mn55Al45 phase
( Mn55Al45C2 made by drop synthesis)10,24,25 showed great purity and promising magnetic properties. However,
despite being able to obtain close to 100% phase pure τ-MnAl the material still has challenges, mainly in terms
of its microstructural properties which need to be improved to compete with ferrites. In this investigation,
nano-VC additive has been selected in an attempt to achieve this. It should be taken into account that all sam-
ples in this work were synthesized by direct induction melting and all further investigations were done on the
as-prepared samples. The M n55Al45C2 alloy has been made as a reference for comparison. Investigation of the
quality of Mn55Al45C2(VC)x alloys has been done by powder X-ray diffraction (PXRD). Figure 1 presents a com-
parison of PXRD patterns for the M n55Al45C2, Mn55Al45C2(VC)0.25, Mn55Al45C2(VC)0.5, Mn55Al45C2(VC)1 and
Mn55Al45C2(VC)3.5 samples. Notably, peaks of VC are not visible by PXRD up to a concentration of 1 at.% of VC.
A complete phase analysis of the synthesized and processed samples is presented in Table 1.
Scientific Reports | (2021) 11:14453 | https://doi.org/10.1038/s41598-021-93395-2 2
Vol:.(1234567890)
www.nature.com/scientificreports/
Figure 1. Comparison of the PXRD patterns for the as synthesized M
n55Al45C2(VC)x (x = 0, 0.25, 0.5, 1 and 3.5)
alloys.
Phase analysis Magnetometry data
τ-phase parameters τ-phase parameters
No Sample V (Å3) c/a Phase abundance (wt.%) M(kA/m) HC(kA/m)
1 Mn55Al45C2 27.599(3) 1.3039 85.0 τ + 15.0 γ2 541 57
2 Mn55Al45C2(VC)0.25 27.617(3) 1.3055 97.5 τ + 2.5 γ2 565 57
3 Mn55Al45C2(VC)0.5 27.620(4) 1.3049 94.0 τ + 6.0 γ2 544 71
4 Mn55Al45C2(VC)1 27.630(1) 1.3040 96.3 τ + 3.7 γ2 499 69
5 Mn55Al45C2(VC)3.5 27.816(1) 1.3060 86 τ + 5 γ2 + 9 VC - -
Table 1. Phase analysis, magnetization at 9 T and coercivity values of the studied Mn55Al45C2(VC)x (x = 0,
0.25, 0.5, 1 and 3.5) alloys. Abbreviations used in the table: τ-Mn55Al45C2 and γ2-Mn5Al8.
From the Rietveld refinement it was found that Mn55Al45C2 has 85 wt.% of τ-phase purity while doped
n55Al45C2(VC)x (x ≤ 1) alloys have greater purity (see in Table 1). From PXRD, the relative content of the τ-phase
M
in the Mn55Al45C2(VC)x alloys is very close to the drop synthesized10. Using C is thus important for stabilization
of the τ-phase even when introducing nano-dopants. One sample with larger content of nano-VC (3.5 at.%) has
been prepared to verify the solubility limit. Additionally, one alloy without carbon (sample not presented here)
but with nano-VC has been made. However, the purity of the C-free sample dropped drastically (65 wt.% of
τ-phase). It should be noted that the chosen additive even promotes and amplifies in combination with carbon
the stabilization/formation of the τ-phase alloys.
Microstructural analysis. SEM/LOM/EDX/STEM. The Mn55Al45C2(VC)1 alloy was selected for detailed
microstructural analysis. SEM observations on this etched sample (see Supplementary information Fig. S1a)
show that there exist clusters (regions) of striations aligned along preferential directions. Before etching, images
were collected by LOM. The polarized LOM image (Figure S1b) gives a good insight into the grain size, orienta-
tions and its distribution, which is difficult to observe by ordinary LOM/SEM even after etching. The matrix
(τ-phase) that exists in all samples is very homogeneous without large agglomerates of VC.
EDX analysis cannot confirm the existence of nano-VC in the alloy, since the particles are too small in
comparison with the resolution of the instrument. However, EDX mapping reveals a homogeneous distribu-
tion of V and a few Al-rich regions within the τ-phase (Figure S2). In addition, the average contents of Mn and
Al measured by EDX is M n55Al45 (Mn-rich region) and M n39Al61(Al-rich region) are in agreement with the
τ-Mn0.55Al0.45C0.02 and γ2-Mn5Al8 phases, respectively. This is in good agreement with the results from PXRD.
The presence of VC particles in the τ-phase was further investigated in the TEM. Figure 2 shows a magni-
fied image of the τ-phase, where it can be seen that particles are present within the grain. The particles are
elongated in one direction, forming needle-shaped precipitates with a length of around 200 nm and width
of around 20–30 nm. These are rich in V and C, indicating the presence of nanocrystalline VC. As have been
described earlier, these particles are found in preferential orientations according to the LOM and SEM images.
The preferential orientation could also be seen in the TEM cross section, where the red line in Fig. 2 indicates
Scientific Reports | (2021) 11:14453 | https://doi.org/10.1038/s41598-021-93395-2 3
Vol.:(0123456789)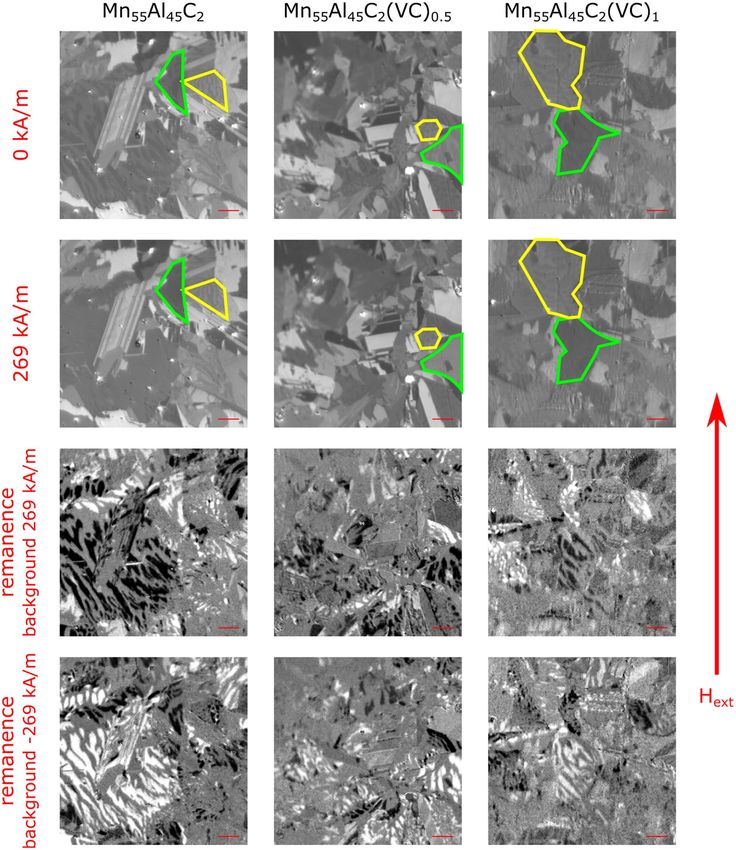
www.nature.com/scientificreports/
Figure 2. STEM image of the Mn55Al45C2(VC)1 sample, showing V-, C-rich precipitates forming in the τ-phase.
The inset shows an electron diffraction pattern, indexed with the τ-phase oriented in the[1–21] zone axis. The
red line indicates the [103] direction.
the [103] direction. From these results, it is suggested that the particles have a preferred orientation in regard
to the τ-phase, but the same orientation relationship was seen across twin boundaries in the TEM (Figure S3).
Due to the high melting point of VC, it is expected that the added nanoparticles are distributed in the liquid
phase, but remain as solid particles due to the high melting point and acting as nucleation sites for the τ-phase.
Further investigation of this phenomenon is required to understand the solidification behavior of the alloy with
VC, but is outside the scope of this study.
EBSD. Figure 3 shows the EBSD results for the Mn55Al45C2, Mn55Al45C2(VC)0.5 and Mn55Al45C(VC)1 samples.
It can be seen in Fig. 3a,d,g that all samples contain a combination of the τ-phase (shown in red) with some γ2-
phase (shown in blue) randomly distributed within the samples. Figure 3b,e,h,c,f,i show EBSD orientation maps
of the τ-phase and the γ2-phase for the three samples. The τ-phase is randomly oriented, but all individual grains
of the γ2-phase appear to be oriented in similar directions, which could originate from solidification if the γ2-
phase solidifies with a preferred orientation in regard to the thermal gradient. In the last few years, much work
has been done to elucidate certain features of the microstructure and its effect on the performance of τ-MnAl
such as anti-phase d efects26, dislocations27,28, interfaces29 and t wins26,27,30. As many of these features are coexist-
ing, often together with a difference in tetragonality (c/a ratio) of the τ phase, it is still not fully resolved which of
these features have a negative impact on magnetic properties like magnetization, remanence and coercivity. Very
recently, two studies27,31 were presented which show that for instance the coercivity can be negatively affected by
twinning and that dislocations instead improve the coercivity.
Figure 4 a-c shows the distribution of grain boundaries in the M n55Al45C2, Mn55Al45C2(VC)0.5 and
Mn55Al45C(VC)1 samples, respectively. It can be seen that a large amount of low angle grain boundaries (almost
50%) are formed in the sample without nano-VC, as well as a large fraction of grain boundaries with angles
of 75˚ and 85˚ corresponding to and twins. With the addition of nano-VC, the amount of small
angle grain boundaries decreases significantly to 17% and 14% for 0.5 at.% and 1 at.% respectively. Figure 4d–f
show the distribution of the 75˚ and 85˚ twin boundaries in blue and red, respectively. Figure 4 g–i
show the local misorientation for the M n55Al45C2, Mn55Al45C2(VC)0.5 and M n55Al45C(VC)1 samples, respectively.
Furthermore, the coherent boundaries in the twins are illustrated in Fig. 4j,k for the 75° and 85°
twins, respectively.
Magnetic characterization. Magnetic measurements. Hysteresis measurements were performed up to
7200 kA/m (9 T) on samples of Mn55Al45C2, Mn55Al45C2(VC)0.25, Mn55Al45C2(VC)0.5 and M n55Al45C2(VC)1 to
investigate the magnetic properties. All curves were corrected for demagnetizing effects. The results can be seen
in Fig. 5 and Table 1.
To start with, there is no strong correlation between the magnetization measured in an applied magnetic field
of 9 T and the amount of τ-phase. Compare for instance M n55Al45C2(VC)0.5 and Mn55Al45C2(VC)1, where first
one has slightly less concentration of τ-phase compare to the last one (94.0 vs. 96.3 wt%, respectively). However,
measured magnetization values show opposite trend (544 kA/m and 499 kA/m, cf. Table 1). Increasing the C
content of ( Mn0.54Al0.46)100Cx increases saturation m agnetization14 slightly from carbon free to some carbon
Scientific Reports | (2021) 11:14453 | https://doi.org/10.1038/s41598-021-93395-2 4
Vol:.(1234567890)
www.nature.com/scientificreports/
Figure 3. Phase maps with the τ-phase in red and the γ2-phase in blue obtained from EBSD measurements for
the Mn55Al45C2 (a), Mn55Al45C2(VC)0.5 (d) and M
n55Al45C(VC)1 (g) samples. Figures (b,e,h) show orientation
maps for the τ-phase, and (c,f,i) show orientation maps for the γ2-phase.
added, while too much decreases the saturation magnetization. This is however further complicated by the fact
that the c/a ratio varies between the samples, which is also known to affect magnetization32. The τ-phase in all
Mn55Al45C2(VC)x (x = 0.25, 0.50 and 1.0) alloys has higher c/a ratio than in M n55Al45C2, which also has been
seen to affect both HA and TC. This increase in c/a ratio is most probably due to differences in the C content of
the samples.
The vanadium carbide seems to have more pronounced effect on the coercive force, which is varying between
57–71 kA/m. The optimum appears to be for 0.5 at.% nano-VC which shows a 25% increase in coercive force
(from 57 to 71 kA/m) without losing any saturation magnetization.
MFM and Ker microscopy. We performed magnetic force microscopy (MFM) studies on the as-cast samples
for Mn55Al45C2, Mn55Al45C2(VC)0.5 and Mn55Al45C2(VC)1 to investigate the influence of added precipitates on
the magnetic microstructure. The as-cast samples were polished in the same way as it had been done for the
SEM studies. The measurements were performed on a Dimension Icon system from Bruker. Each sample was
investigated at different positions and one representative result is shown in Fig. 6.
Qualitatively, smaller domains can be seen for the samples with VC precipitates, to investigate the domain
rocedure33. For the stereological procedure, arbitrary line profiles are
size quantitatively we use the stereological p
drawn through the domain image and the changes of the domain state along each line is recorded. The domain
width is calculated as follows:
2 × line length
domain width =
π × number of domain changes
Applying this procedure to each domain image and averaging the results for one sample yield the domain
width distributions presented in Fig. 7.
Scientific Reports | (2021) 11:14453 | https://doi.org/10.1038/s41598-021-93395-2 5
Vol.:(0123456789)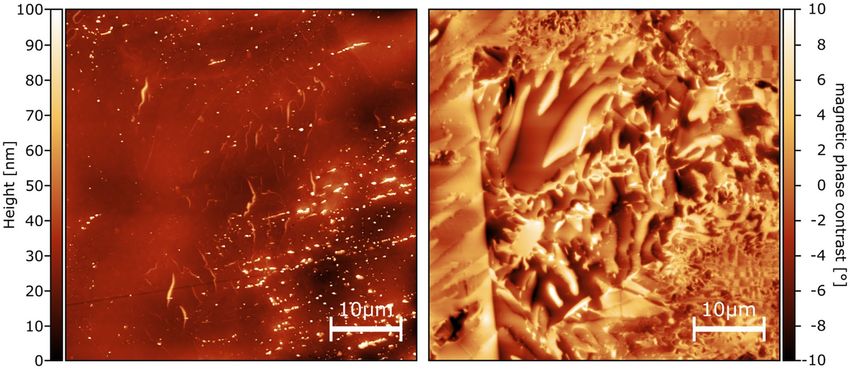
www.nature.com/scientificreports/
Figure 4. (a–c) show the grain boundary distribution for the Mn55Al45C2, Mn55Al45C2(VC)0.5 and
Mn55Al45C(VC)1 samples and (d–f) show the corresponding 75˚ and 85˚ twins in red and blue.
(g–i) show the local misorientation for the Mn55Al45C2, Mn55Al45C2(VC)0.5 and Mn55Al45C(VC)1 samples.
(j,k) illustrate the 75° and 85° twin boundaries, respectively. For simplicity, an atomic ratio of
Al:Mn = 1:1 was assumed; red atoms (corners) are Al while blue atoms (center) are Mn.
Comparing the distributions of Mn55Al45C2, Mn55Al45C2(VC)0.5 and Mn55Al45C2(VC)1 it can be seen that the
samples with VC precipitates have a reduced domain width, verifying the more qualitative observations based
on Fig. 6.
Investigating the M n55Al45C2(VC)1 sample in more detail, we noticed at different locations a correlation
between the domain appearance and precipitates visible in the topography. Figure 6 shows such a correlation
between striations of precipitates in the topography measurement and the smaller domains in the magnetic
domain image. The STEM study (Fig. 2) has shown that the lines of particles are indeed the VC precipitates.
Comparing the location of the smaller and larger domains in the magnetic contrast image in Fig. 8 with the
location of the precipitates in the topography, a clear correlation between smaller domain sizes and the loca-
tion of precipitates can be drawn. This further corroborates the beneficial effect of the VC precipitates on the
magnetic properties.
To investigate the domain structure under applied field we performed Kerr microscopy studies on the polished
surface of the as-cast pieces of Mn55Al45C2, Mn55Al45C2(VC)0.5 and Mn55Al45C2(VC)1. The measurements were
performed using the polar and longitudinal magneto-optical Kerr effect (MOKE); therefore, we are sensitive to
Scientific Reports | (2021) 11:14453 | https://doi.org/10.1038/s41598-021-93395-2 6
Vol:.(1234567890)
www.nature.com/scientificreports/
600
Mn55Al45C2(VC)x
400 0.00
0.25
Magnetization (kA/m)
200 0.50
1.00
300
0 250
Magnetization (kA/m)
200
150
-200 100
50
0
-400 -50
-100 -50 0
Inner field (kA/m)
-600
-5000 -2500 0 2500 5000
Inner field (kA/m)
Figure 5. Magnetic hysteresis curves for M
n55Al45C2, Mn55Al45C2(VC)0.25, Mn55Al45C2(VC)0.5 and
Mn55Al45C2(VC)1.0. Inset shows behavior near the coercive field.
Figure 6. Representative results from MFM measurements of Mn55Al45C2, Mn55Al45C2(VC)0.5 and
Mn55Al45C2(VC)1. First row shows the topography of the measured sample, while the second row represents the
magnetic contrast illustrating the magnetic domain structure at the measured position.
magnetization components both out-of- plane and parallel to the applied in-plane magnetic field. The investigated
as-cast samples have various orientations of the grains. Hence, a preferred anisotropy axis could not be identified
and each grain had an almost unique response to the applied magnetic field. Figure 9 shows representative loca-
tions for each of the three samples. While the first row illustrates the MOKE images without any applied field,
the second row shows the same location under the maximum applied field of 269 kA/m. The microstructure of
the samples is dominating these images, but in several grains the domain structure can be identified. In each
Scientific Reports | (2021) 11:14453 | https://doi.org/10.1038/s41598-021-93395-2 7
Vol.:(0123456789)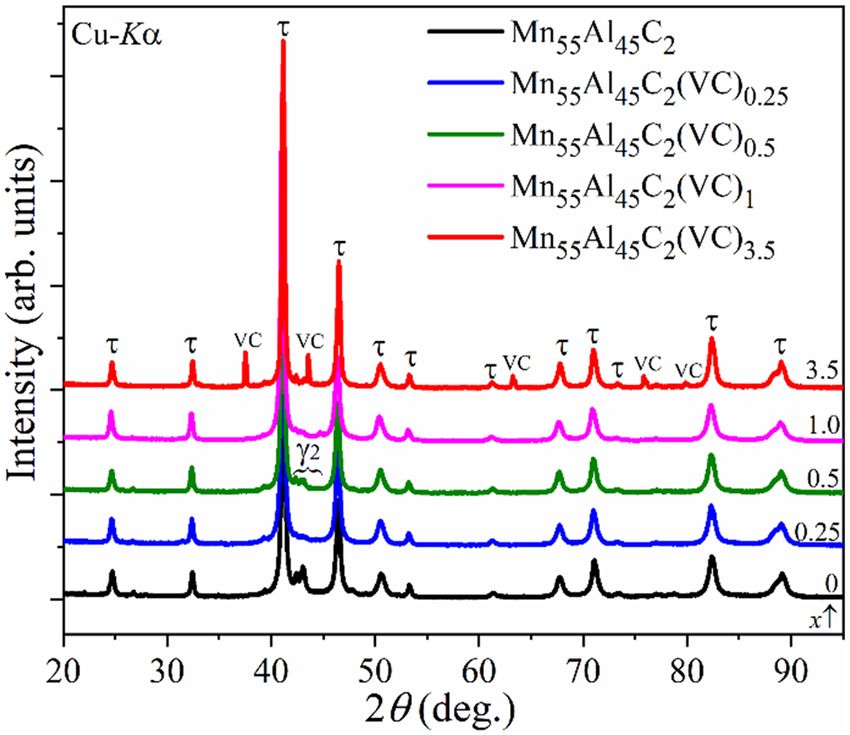
www.nature.com/scientificreports/
Figure 7. Domain width distributions for Mn55Al45C2, Mn55Al45C2(VC)0.5 and Mn55Al45C2(VC)1. A clear peak
shift to lower domain width is visible in both the samples with 0.5% and 1% VC precipitates.
Figure 8. Magnetic force microscopy measurement of the M n55Al45C2(VC)1 sample. Left image shows the
topography with clear visible lines of precipitates. The right image illustrates the magnetic domains and a
correlation between small domains and the location of the precipitates can be seen.
of the three samples, grains could be identified which saturated with the applied field of 269 kA/m. Examples
are marked with a green border around that specific grain. Additionally, there are also grains which could not
completely be saturated, which are marked by yellow borders. A plausible reason for this vastly different behavior
is the random orientation of the grains in the as-cast samples. Therefore, the anisotropy axis within saturated
grains is more or less aligned with the applied field direction.
Another observation based on the microstructure is that the grain size seems to be reduced for the samples
Mn55Al45C2(VC)0.5 and M n55Al45C2(VC)1 in comparison with M n55Al45C2. But this observation cannot be quanti-
fied using the Kerr microscopy studies, as the domain structure visible in the images will interfere in any grain
size analysis.
The lower two rows in Fig. 9 are typical domain contrast images recorded with a Kerr microscope. To receive
a clear domain contrast, the Kerr image at a certain applied magnetic field is subtracted from the image at a dif-
ferent field. The resulting image illustrates the changes in the domain structure between the two applied fields.
Scientific Reports | (2021) 11:14453 | https://doi.org/10.1038/s41598-021-93395-2 8
Vol:.(1234567890)www.nature.com/scientificreports/
Figure 9. Kerr microscopy investigation of as-cast M n55Al45C2, Mn55Al45C2(VC)0.5 and Mn55Al45C2(VC)1 alloys.
The first row are measurements taken at 0 kA/m, while the second row shows images taken at an applied field
of 269 kA/m. In all samples, grains can be identified which can be saturated (marked green) and which cannot
be saturated (marked yellow). Row three and four illustrate the domain changes coming from 269 kA/m to 0
kA/m (third row) and coming from -269 kA/m to 0 kA/m (fourth row). As expected the domains in the grains
are reversing their orientation (black to white and vice versa), but no obvious pinning sites can be identified. The
images are cut-outs of the bigger measurements and represent 90 × 90 µm2, i.e. the same size as the MFM images
in Fig. 8; the red scale bar illustrates 10 µm.
Scientific Reports | (2021) 11:14453 | https://doi.org/10.1038/s41598-021-93395-2 9
Vol.:(0123456789)www.nature.com/scientificreports/
Therefore, we can investigate the domain dynamics by applying the magnetic field step wise. While increasing it
from 0 kA/m up to 269 kA/m, we notice in all three samples that the domains change similarly. After reaching
the maximum applied field at 269 kA/m we reduce the field stepwise, first down to remanence (0 kA/m) and
then continuing to -269 kA/m, and ending the hysteresis loop again at 0 kA/m. Videos of these measurements
can be found in the Supplementary materials. The third row in Fig. 9 shows the corresponding domain changes
going from 269 kA/m to 0 kA/m, while the fourth raw illustrates the domain changes going from -269 kA/m to 0
kA/m. It is obvious that the black and white domains in row 3 are inverted in row 4. But at a closer examination
of the domain change structure, it becomes clear that there is no evidence of strong pinning in the investigated
samples, as there is no complete inversion of the domains. Only the expected reversing of the domain preference
is visible, revealing more white than black domains.
These results from the domain dynamics are expected, as there are no big differences between the samples
in the magnetization measurements for the available field range of the Kerr microscope (Fig. 5 and Table 1).
Conclusions
The effects of the nano-VC on the microstructure and magnetic properties of Mn55Al45C2 have been investigated
by various techniques. It was shown that the nano-VC containing Mn55Al45C2(VC)x (x = 0.25, 0.50 and 1.0)
samples were purer in τ-phase in comparison to the reference (≥ 94 wt.% vs. 85 wt.% of -phase, respectively).
Metallography studies demonstrate a microstructure with nanometer sized inclusions of carbides. The addition of
nano-VC significantly decreases the amount of small angle grain boundaries as compared to Mn55Al45C2. In rela-
tion to this, the presence of twin boundaries with angles of 75˚ and 85˚ corresponding to and twins,
respectively, increases with the addition of nano-VC.
For nano-VC contents above 0.25 at.%, a clear increase of the coercive force is observed, from 57 to 71
kA/m. The optimum appears to be for 0.5 at.% nano-VC which shows a 25% increase in coercive force without
losing any saturation magnetization. This independent increase in coercivity is believed to originate from the
nano-VC reducing the overall magnetic domain size. Also, as there is a weaker than usual correlation of τ-phase
purity and magnetization in these alloys, it is concluded that saturation magnetization is here not only deter-
mined by the amount of τ-phase, but also the amount of carbon, which has been reported to have effects on
saturation magnetization14,32. Comparing carbon free τ-phase MnAl to carbon substituted τ-phase MnAl show
that some amount of carbon is beneficial for saturation magnetization, while too much lowers the saturation
magnetization14. This has also been reported to decrease K C14. However, all of this is further complicated
1 and T
by the fact that atomic order, carbon content and c/a ratio (which are all interacting) varies in these samples.
Separating these effects from each other is however outside of the scope of this work.
From magnetic force microscopy, we can conclude that nano-VC precipitates reduce the domain size in
Mn55Al45C2. This effect can be caused by nucleation of magnetic domain walls by the precipitates or being an
indirect effect of a reduced grain size, but most likely it is a combined effect of both.
Kerr microscopy studies revealed that there are no measurable differences in the dynamic response to the
applied magnetic field for the investigated M n55Al45C2, Mn55Al45C2(VC)0.5 and M n55Al45C2(VC)1 samples. This
finding is in good agreement with the magnetization measurements. Additionally, we can see a large variety
of grain orientations leading to a vastly different response of the magnetic domains to the applied field. How-
ever, we cannot identify traces of strong pinning within a single grain in neither the M n55Al45C2(VC)0.5 or
Mn55Al45C2(VC)1 sample.
Overall, we can conclude that addition of nano-VC could be an interesting route to increase the coercive
force of MnAl, without sacrificing saturation magnetization. However, before this can be realized, much deeper
investigations on the effects of inclusions of nanoparticles in MnAl are needed.
Received: 12 May 2021; Accepted: 24 June 2021
References
1. Sprecher, B. et al. Novel indicators for the quantification of resilience in critical material supply chains, with a 2010 rare earth crisis
case study. Environ. Sci. Technol. 51, 3860–3870 (2017).
2. Coey, J. M. D. Permanent magnets: Plugging the gap. Scr. Mater. 67, 524–529 (2012).
3. Skomski, R. & Coey, J. M. D. Magnetic anisotropy—How much is enough for a permanent magnet?. Scr. Mater. 112, 3–8 (2016).
4. Massalski, T. Binary alloy phase diagrams. in Alloy Phase Diagrams 89–89 (1990).
5. Hoydick, D. P., Palmiere, E. J. & Soffa, W. A. On the formation of the metastable L10 phase in manganese-aluminium-base perma-
nent magnet materials. Scr. Mater. 36, 151–156 (1997).
6. Kono, H. On the ferromagnetic phase in manganese-aluminium system. J. Phys. Soc. Jpn. 13, 1444–1451 (1958).
7. Koch, A. J. J., Hokkeling, P., v. d. Steeg, M. G. & de Vos, K. J. New material for permanent magnets on a base of Mn and Al. J. Appl.
Phys. 31, S75–S77 (1960).
8. Brown, W. F. Micromagnetics. (Willey, 1963).
9. Kronmüller, H. Theory of nucleation fields in inhomogeneous ferromagnets. Phys. Status solidi 144, 385–396 (1987).
10. Fang, H. et al. Directly obtained τ-phase MnAl, a high performance magnetic material for permanent magnets. J. Solid State Chem.
237, 300–306 (2016).
11. Shao, Z. et al. One step preparation of pure τ-MnAl phase with high magnetization using strip casting method. AIP Adv. 7, 056213
(2017).
12. Wang, X. et al. Structural and magnetic properties of the gas atomized Mn-Al alloy powders. Met. Mater. Int. 18, 711–715 (2012).
13. Jiménez-Villacorta, F. et al. Magnetism-structure correlations during the ε→τ transformation in rapidly-solidified MnAl nano-
structured alloys. Metals (Basel). 4, 8–19 (2014).
14. Zhao, S. et al. Stabilization of τ-phase in carbon-doped MnAl magnetic alloys. J. Alloys Compd. 755, 257–264 (2018).
Scientific Reports | (2021) 11:14453 | https://doi.org/10.1038/s41598-021-93395-2 10
Vol:.(1234567890)www.nature.com/scientificreports/
15. Mix, T., Bittner, F., Müller, K.-H., Schultz, L. & Woodcock, T. G. Alloying with a few atomic percent of Ga makes MnAl thermo-
dynamically stable. Acta Mater. 128, 160–165 (2017).
16. Chaturvedi, A., Yaqub, R. & Baker, I. A comparison of τ-MnAl particulates produced via different routes. J. Phys. Condens. Matter
26, 064201 (2014).
17. Bajenova, I. et al. Experimental investigation of the Al-Mn-C system: Part I. Phase equilibria at 1200 and 1100 °C. J. Alloys Compd.
700, 238–246 (2017).
18. Bajenova, I. et al. Experimental investigation of the Al-Mn-C system. Part II: Liquidus and solidus projections. J. Alloys Compd.
695, 3445–3456 (2017).
19. Zhao, S. et al. Realization of large coercivity in MnAl permanent-magnet alloys by introducing nanoprecipitates. J. Magn. Magn.
Mater. 483, 164–168 (2019).
20. Bǎo, J. C. (蒋成保) et al. A kind of permanent-magnet alloy and preparation method thereof. in CN Patent CN109087766A (2018).
21. A.C. Larson, R. B. von Dreele. General Structure Analysis System (GSAS). Los Alamos National Laboratory, Report LAUR. 86–748
(2000).
22. Nečas, D. & Klapetek, P. Gwyddion: An open-source software for SPM data analysis. Cent. Eur. J. Phys. 10, 181–188 (2012).
23. Hubert, A. & Schäfer, R. Magnetic Domains: The Analysis of Magnetic Microstructures (Springer, 1998).
24. Fang, H. et al. Insights into formation and stability of τ-MnAlZx (Z = C and B). J. Alloys Compd. 692, 198–203 (2017).
25. Fang, H. et al. Structural, microstructural and magnetic evolution in cryo milled carbon doped MnAl. Sci. Rep. 8, 2525 (2018).
26. Bance, S., Bittner, F., Woodcock, T. G., Schultz, L. & Schrefl, T. Role of twin and anti-phase defects in MnAl permanent magnets.
Acta Mater. 131, 48–56 (2017).
27. Jia, Y. et al. L10 rare-earth-free permanent magnets: The effects of twinning versus dislocations in Mn-Al magnets. Phys. Rev. Mater.
4, 094402 (2020).
28. Bittner, F., Freudenberger, J., Schultz, L. & Woodcock, T. G. The impact of dislocations on coercivity in L10-MnAl. J. Alloys Compd.
704, 528–536 (2017).
29. Bittner, F., Schultz, L. & Woodcock, T. G. The role of the interface distribution in the decomposition of metastable L10-Mn54Al46.
J. Alloys Compd. 727, 1095–1099 (2017).
30. Palanisamy, D., Raabe, D. & Gault, B. Elemental segregation to twin boundaries in a MnAl ferromagnetic Heusler alloy. Scr. Mater.
155, 144–148 (2018).
31. Popov, V. V. et al. Microstructure and magnetic properties of Mn-Al-C permanent magnets produced by various techniques.
Manuf. Rev. 8, 10 (2021).
32. Pareti, L., Bolzoni, F., Leccabue, F. & Ermakov, A. E. Magnetic anisotropy of MnAl and MnAlC permanent magnet materials. J.
Appl. Phys. 59, 3824–3828 (1986).
33. Bodenberger, R. & Hubert, A. Zur bestimmung der blochwandenergie von einachsigen ferromagneten. Phys. Status Solidi 44,
K7–K11 (1977).
Acknowledgements
This work was supported by the Swedish Foundation for Strategic Research, project “SSF Magnetic materials for
green energy technology” (EM16-0039) and the Carl Trygger Foundation who are gratefully acknowledged. This
work was funded through SweGRIDS, by the Swedish Energy Agency and Höganäs AB.
Author contributions
V.S. (synthesis, PXRD, Rietveld refinement and directed the project), H.S. (MFM and Ker microscopy), D.H.
(magnetic measurements), D.K. (STEM/EDX and EBSD), R.P. (Ker microscopy) and F.O. (LOM and SEM/EDX)
: performed the experiments, analyzed the data and wrote the paper. B.S., H.V., G.A., P.S. and M.S. : organized
the research, supervision, resources, project administration and writing—review & editing. All authors took part
at joint discussion of the results and commented on the manuscript.
Funding
Open access funding provided by Uppsala University.
Competing interests
The authors declare no competing interests.
Additional information
Supplementary Information The online version contains supplementary material available at https://doi.org/
10.1038/s41598-021-93395-2.
Correspondence and requests for materials should be addressed to V.S.
Reprints and permissions information is available at www.nature.com/reprints.
Publisher’s note Springer Nature remains neutral with regard to jurisdictional claims in published maps and
institutional affiliations.
Open Access This article is licensed under a Creative Commons Attribution 4.0 International
License, which permits use, sharing, adaptation, distribution and reproduction in any medium or
format, as long as you give appropriate credit to the original author(s) and the source, provide a link to the
Creative Commons licence, and indicate if changes were made. The images or other third party material in this
article are included in the article’s Creative Commons licence, unless indicated otherwise in a credit line to the
material. If material is not included in the article’s Creative Commons licence and your intended use is not
permitted by statutory regulation or exceeds the permitted use, you will need to obtain permission directly from
the copyright holder. To view a copy of this licence, visit http://creativecommons.org/licenses/by/4.0/.
© The Author(s) 2021
Scientific Reports | (2021) 11:14453 | https://doi.org/10.1038/s41598-021-93395-2 11
Vol.:(0123456789)You can also read