Infrastructure Strategy 2021-2051 - the South Wairarapa ...
←
→
Page content transcription
If your browser does not render page correctly, please read the page content below

South Wairarapa District Council | Long Term Plan 2021/31

                       Infrastructure Strategy
                                            2021-2051

Date of Approval             xx June 2021
Next Review                  30 June 2024

       Part 4 | Strategies and Policies                                                               1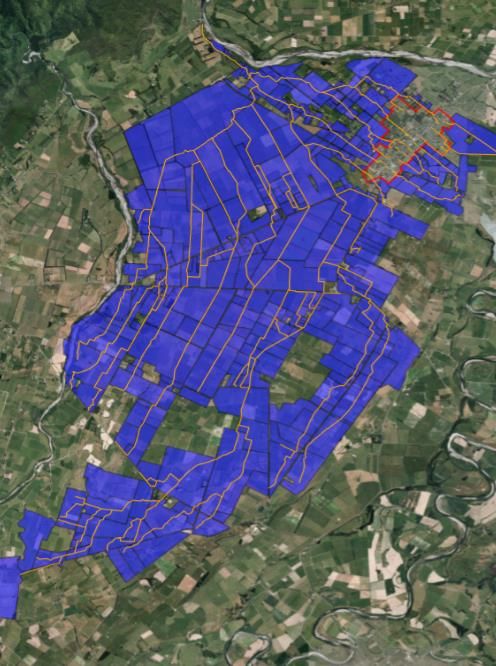
South Wairarapa District Council | Long Term Plan 2021/31

Table of Contents

   Introduction ............................................................................................................................................. 4
   Summary .................................................................................................................................................. 4
       SWDC Community Outcomes and Wellbeings..................................................................................... 5
       Geographic context for the strategy .................................................................................................... 6
       Population Growth ............................................................................................................................... 6
       Household Growth ............................................................................................................................... 9
       Regional growth framework .............................................................................................................. 10
       Environmental .................................................................................................................................... 11
   What this might mean for Wellington and Wairarapa .......................................................................... 13
       Environmental Implications ............................................................................................................... 13
       Coastal vulnerability........................................................................................................................... 13
       South Wairarapa Coastal Units in Vulnerability Assessment............................................................. 14
       Political factors................................................................................................................................... 14
       Transport Priorities ............................................................................................................................ 18
   Three Waters ......................................................................................................................................... 21
       Strategic alignment ............................................................................................................................ 22
       Scope and delivery arrangements ..................................................................................................... 22
       Three Waters Asset Profile ................................................................................................................ 27
   Drinking Water ....................................................................................................................................... 30
       Priority Water Issues .......................................................................................................................... 30
       Priority Drinking Water Issue 1: Improving network and treatment plant performance.................. 30
       Priority Drinking Water Issue 2: Increase renewals funding .............................................................. 32
       Priority Drinking Water Issue 3: Improving water supply resilience ................................................. 34
       Priority Drinking Water Issue 4: Security of supply in Martinborough .............................................. 35
       Funding Approach .............................................................................................................................. 37
       Our Extended View ............................................................................................................................ 38
   Wastewater............................................................................................................................................ 39
       Section summary................................................................................................................................ 39
       Priority Wastewater Issues ................................................................................................................ 39
       Significant Project - Featherston Wastewater Treatment Plant (WWTP) ......................................... 39
       Priority Wastewater Issue 1: Improving Network Performance........................................................ 41
       Priority Wastewater Issue 2: Increasing renewals funding................................................................ 43
       Priority Wastewater Issue 3: Upgrades to meet Levels of Service and growth needs ...................... 45
       Priority Wastewater Issue 4: Approach ............................................................................................. 46

Part 4 | Strategies and Policies                                                                                                                        2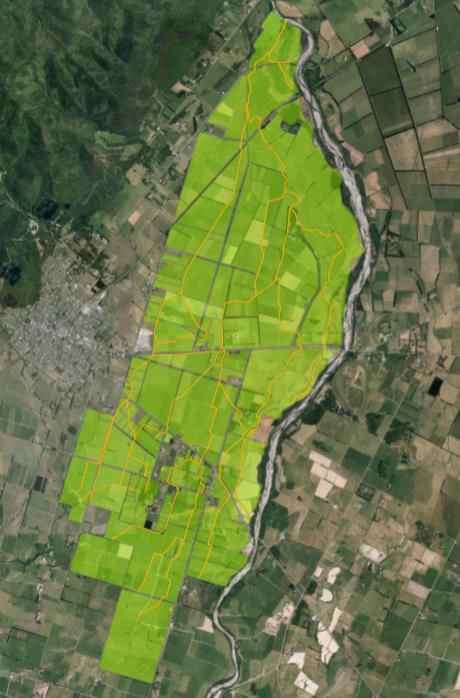
South Wairarapa District Council | Long Term Plan 2021/31

   Stormwater ............................................................................................................................................ 49
       Summary ............................................................................................................................................ 49
       Maintenance and Operation .............................................................................................................. 49
   Water Races ........................................................................................................................................... 52
       Summary ............................................................................................................................................ 52
   Land Transport ....................................................................................................................................... 54
       Summary and Scope .......................................................................................................................... 54
       Funding and Commercial Arrangements ........................................................................................... 54
       Current Road Condition ..................................................................................................................... 55
       Asset Management in Land Transport ............................................................................................... 56
       Priority Roading Issues ....................................................................................................................... 59
       Priority Roading Issue 1: Addressing deteriorating road condition ................................................... 59

Part 4 | Strategies and Policies                                                                                                                       3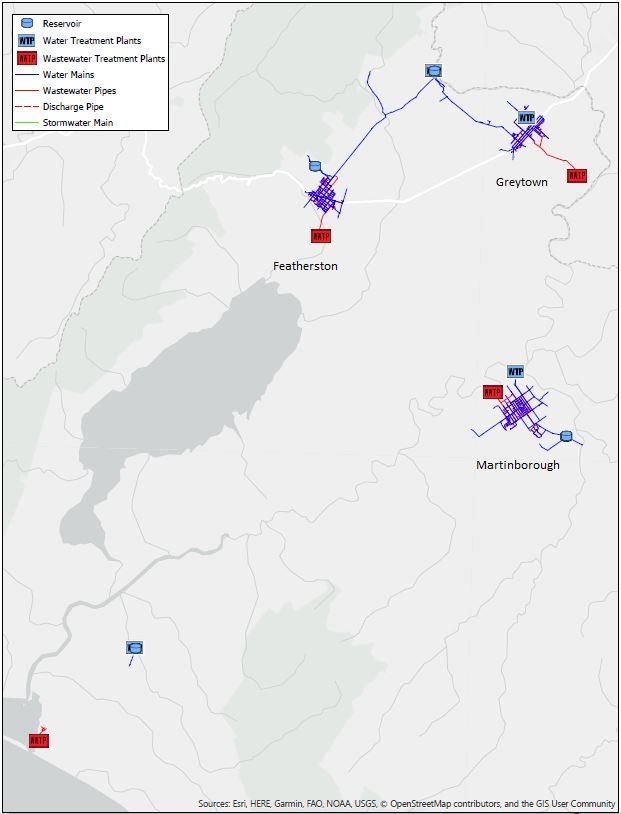
South Wairarapa District Council | Long Term Plan 2021/31

Infrastructure Strategy 2021-2051
Introduction
South Wairarapa District Council (SWDC) is the steward of approximately $388m of infrastructure assets,
accounting for 56% of Council’s annual operating expenditure and 77% of capital expenditure1. These assets
include drinking water, wastewater, stormwater, land transport and other key community infrastructure and are
the foundations on which Council provides key services to our community. The management of these assets is
long-term and inter-generational.

It is therefore essential that Council invests effectively and efficiently in those assets to meet the needs of our
ratepayers and promote the health, wellbeing and prosperity of our District.

The Local Government Act (LGA) requires all local authorities to prepare and adopt an Infrastructure Strategy that
identifies:

             »    The key issues faced by Council in managing these assets over the next 30 years (2021-2051),

             »    A summary of the options identified to address these issues,

             »    Council’s strategic response and preferred options scenario, and

             »    The cost and service delivery implications of the options

This Infrastructure Strategy is developed in conjunction with Council asset planning and will be revised every three
years as part of the LTP process.

Summary
In previous LTPs and Infrastructure Strategies, SWDC has focused on:

             »    Maintaining current levels of service across all assets,

             »    Meeting statutory requirements, and

             »    Keeping cost increases to a minimum2

While this approach has largely achieved these goals our infrastructure assets are beginning to show signs of
deterioration, which, if not addressed now, will require significantly higher investment in the future to repair or
replace. If our infrastructure assets are not appropriately invested in now the service levels provided by Council
will also reduce.

As part of the 2020/21 Annual Plan, Council increased its investment in water, roading and amenity infrastructure,
but the demands placed on our ageing assets continues to grow. To deliver on the services levels provided by
these assets, enhance the wellbeing of our community and enable economic growth in our District, a further
increase in investment is required over the LTP period.

1   As valued at 30 June 2018
2
    SWDC 2018-2028 Infrastructure Strategy

Part 4 | Strategies and Policies                                                                                                4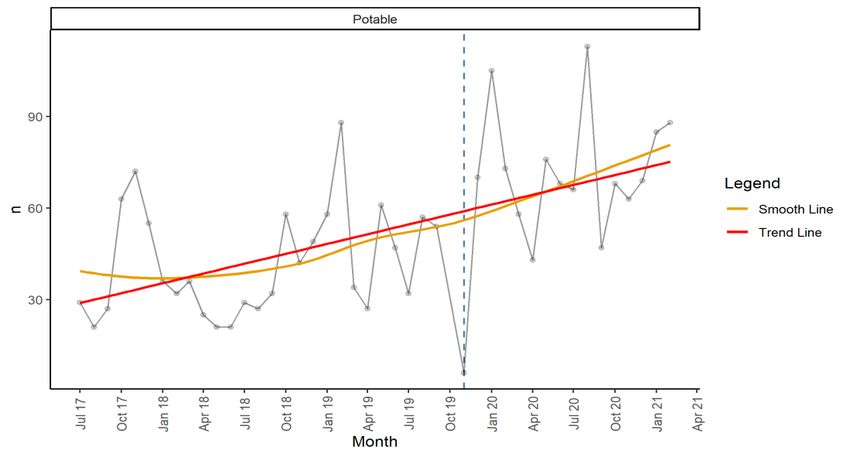
South Wairarapa District Council | Long Term Plan 2021/31

As such, the areas of focus for this strategy are to:

           »     Increase investment in asset renewal to progressively reduce the need for reactive repair,

           »     Meet levels of service for ratepayers by increasing budgets for maintenance and operations,

           »     Develop clear strategies for future upgrades or new infrastructure investment,

           »     Identify, plan and deliver capacity upgrades to cater for growth within the District, and
           »     Continue to enhance our asset knowledge and analytics to refine investment decisions.

This investment, and its phasing, requires Council to balance and consider:

           »     Current asset condition, performance, and remaining or projected asset life,

           »     Asset criticality,

           »     An evolving Local Government environment, which includes the ongoing Three Waters Reform
                 Programme,
           »     Levels of Service provided to our community,

           »     Affordability for South Wairarapa ratepayers,

           »     Demographics, projected growth and its infrastructure impact,

           »     Sound asset management decisions based on best available data, and

           »     The probable impact of climate change on our Infrastructure.

In addition, this Infrastructure Strategy has also considered:

           »     the multiple impacts of the Covid-19 pandemic on our local community and beyond

           »     Community feedback through ongoing engagement and from consultation on the 2021 Annual Plan

           »     A constrained supply market for project delivery (e.g. contractor capacity, availability of materials),
                 and

           »     Emerging innovation and technical advancements

SWDC Community Outcomes and Wellbeings
Council infrastructure is integral to meeting the needs, and ensuring the wellbeing, of our ratepayers. As such, the
key issues or projects in this Infrastructure Strategy are considered in the context of the four Wellbeings and
Community Outcomes:

           »     Social wellbeing - residents are active, healthy, safe, resilient, optimistic and connected,

           »     Economic wellbeing - new business, jobs that give people independence and opportunity, diverse
                 transport modes and a place of destination,

           »     Environmental wellbeing - sustainable living, safe & secure water and soils, waste minimised,
                 biodiversity enhanced, and

           »     Cultural wellbeing - strong relationships with iwi, hapū and whānau, celebrating diverse cultural
                 identity, arts and heritage.

Part 4 | Strategies and Policies                                                                                            5
South Wairarapa District Council | Long Term Plan 2021/31

The impact of investment decisions on these Community Outcomes will vary. Capital upgrades to wastewater
treatment facilities will help improve the environmental wellbeing in the District, but so too will increased
maintenance resources to rapidly respond to wastewater network leaks.

Meeting these needs across multiple asset types, and balancing them with affordability, requires appropriate
phasing and compromise, where possible and appropriate. However, large parts of our infrastructure require
greater investment now or service levels will not be met and any deferred costs are likely to be significantly
higher.

Geographic context for the strategy
The South Wairarapa District is at the southern-most point of the North Island and comprises approximately
248,455 hectares. The Council covers a large land area that includes Lake Wairarapa, significant ranges, a long
coastline and significant rural areas. There are three main centres in the District: Featherston, Greytown and
Martinborough and a number of smaller rural and coastal settlements.

Figure 1 - SWDC Geographic Context Map

Population Growth
Census data shows that the population in the South Wairarapa district increased by 11% from 9,800 in 2013 to
10,900 in 2018. This represents an average annual change over the 5-year period of 2.2%. We have obtained
population projections for the period 2019 to 2051 from Infometrics. South Wairarapa’s population is projected to
grow from 11,512 in 2021 to 12,696 in 2031 and 14,476 by 2051.

Growth in the South Wairarapa has historically been split evenly between urban and rural areas but future growth
is projected to be concentrated in urban centres. Based on improvements in rail connectivity for commuters and
the intent of the Regional Growth Framework, growth is expected to be concentrated largely around the
Featherston and Greytown urban centres.

Part 4 | Strategies and Policies                                                                                        6

South Wairarapa District Council | Long Term Plan 2021/31

The strongest growth is expected in Greytown (1,001 people) followed by Featherston (796 people) and
Martinborough (603 people). Tauherenikau and Aorangi Forest are expected to experience moderate growth
(around 236 and 164 people respectively). The growth in Tauherenikau is expected based on development around
the existing village and growth in Aorangi Forest is expected due to the development of lifestyle blocks on the
fringes of Martinborough.3

Population data from Infometrics notes that growth has been strong over the last decade, aided by significant net
migration flows in the past five years. In 2020, the South Wairarapa experienced an annual population growth of
2.7 percent, an increase of 300 people. This is up from prior years where population growth had previously peaked
in 2017 at 2.4 percent. Of the annual population growth experienced in 2020, 17% was from a natural increase
(births exceeding deaths), 47% was due to net internal migration and the remaining 37% from net international
migration.

Figure 2: South Wairarapa Annual Population Change

          3.0%

          2.5%

          2.0%

          1.5%

          1.0%

          0.5%

          0.0%

         -0.5%

         -1.0%

         -1.5%

         -2.0%
                                                                                                                                      ]

As is the case for most of New Zealand, the population in South Wairarapa is projected to see an aging population
over the next 30 years. The population aged 65 years and older is projected to grow by 77% between 2019 and
2051 (from around one in four to around one in three of the district population). As a result, the average age is
projected to rise from 44 in 2019 to 49 in 2051.

The under 15 years and working age population (15 – 64 years) groups are projected to grow modestly. The
number of young people under 15 years is projected to grow by 12% between 2019 and 2051 and the working age
population is projected to grow by 14%.

3
    Population and age projections are sourced from Infometrics Population Projections 2019 – 2051.

Part 4 | Strategies and Policies                                                                                                       7
South Wairarapa District Council | Long Term Plan 2021/31

Figure 3: South Wairarapa Age Projections, 2019 to 2051

                                           9%
                                           8%
                                           7%
                  % of population

                                           6%
                                           5%
                                           4%
                                           3%
                                           2%
                                           1%
                                           0%

                                                                                             2019       2051

The ethnic mix of South Wairarapa’s population is projected to continue to change in line with historical trends,
with the largest change being an increase in the proportion of the population identifying as Māori – up from 15%
of the South Wairarapa population in 2018 to 21% by 2038.4

Figure 4: South Wairarapa Ethnic Population Projections, 1996 to 2038

                                                      14,000                                                                                    12,000
                                                      12,000                                                                                    10,000
          Number of people who identify with ethnic

                                                                                                                                                          Total population
                                                      10,000
                                                                                                                                                8,000
                                                       8,000
                                                                                                                                                6,000
                                                       6,000
                                                                                                                                                4,000
                                                       4,000
                                                                                                                                                2,000
                           group

                                                       2,000
                                                          0                                                                                     0
                                                               1996     2001    2006     2013    2018     2023      2028     2033     2038
                                                                                        (base)

                                                           European or Other (including New Zealander)         Māori
                                                           Asian                                               Pacific
                                                           Total Population
                                                                                                                                                                             g
Note: The sum of all ethnic groups exceeds the total population because people can identify with more than one ethnicity.

4
    Ethnicity projections from Stats NZ: https://www.stats.govt.nz/information-releases/subnational-ethnic-population-projections-
2013base2038-update

Part 4 | Strategies and Policies                                                                                                                                             8
South Wairarapa District Council | Long Term Plan 2021/31

Household Growth
The district has recently been experiencing a new period of building growth. There was steady growth in the
number of new building consents issued from 1999 to 2007, followed by a period of decline in numbers to 2011
after the global financial crisis. Numbers then stayed steady until 2017 with a doubling of the number of consents
issued for new dwellings compared to the previous year (from 50 to 102). Numbers decreased slightly to 86 in
2019 and 78 in 2020.

Consenting remains strong following COVID-19 with 30 new dwelling consents issued in the first quarter of the
2020/21 financial year and 25 in the second quarter, which is consistent with the number of consents in the high
growth period 2017-2018 (25 for the first quarter and 26 for the second quarter in 2017; and 30 for the first
quarter and 34 for the second quarter in 2018).

Figure 5: South Wairarapa District Residential Building Consents, 2000 to 2020 (June)

                                                120
           Number of new residential building

                                                100

                                                80
                      consents

                                                60

                                                40

                                                20

                                                 0

In terms of future projections, Infometrics projects that the number of households in the district will increase from
4,946 in 2021 to 5,498 in 2031 and 6,371 in 2051. Infometrics notes that the growth in the number of households
is due to the growing population and decreasing average household size. It is projected the average household size
will reduce from 2.29 persons per household in 2021 to 2.19 by 2051.

Over the period from 2016/17 to 2020/21 there was a 5% increase in the number of rateable properties in the
district. The largest growth occurred in residential properties in Greytown and Martinborough, both with a 9%
increase. Commercial property numbers have remained largely unchanged and there was a 4% increase in rural
properties.

Part 4 | Strategies and Policies                                                                                            9
South Wairarapa District Council | Long Term Plan 2021/31
Table 1: Rateable Properties in the District
RATING UNITS 2016/17 2017/18 2018/19 2019/20 2020/21
Rural 3078 3114 3094 3135 3203
Featherston Residential 1164 1169 1174 1178 1211
Commercial 85 86 86 86 84
Greytown Residential 1097 1111 1132 1167 1194
Commercial 113 111 111 110 113
Martinborough Residential 894 917 960 968 977
Commercial 110 106 105 106 106
Total 6541 6614 6662 6750 6888
Regional growth framework
The Wellington Regional Growth Framework (the Framework) is a spatial plan that has been developed by
local government, central government and iwi partners in the Wellington-Horowhenua region to deliver on the
Urban Growth Agenda (UGA) objectives of the Government. The Framework also provides councils and iwi in
the region an agreed regional direction for growth and investment.
The Framework identifies how the Wellington-Horowhenua region could accommodate a future population of
760,000 people and an additional 100,000 jobs over the next 30 years. This would represent an additional
200,000 people in the region. The scenario of 200,000 people has been developed to understand what would
be required to accommodate this level of growth, and consider potential infrastructure needs beyond the 30-
year growth scenario.
While there is no certainty about when, how or at what rate, the region’s population might reach this size, the
Framework has been developed based on this scenario to give a better understanding of what would be
required to support this level of growth. It is important to note that this is not a policy target. The proposed
changes to urban form for the region is a mix of development in both Urban Renewal Areas (brownfield) and in
Future Urban Areas (greenfield). Both are expected to have higher density development than we see at
present throughout the region and include improved access to bus and rail services, which are expected to
increase in frequency, capacity and reach over time.
Our current understanding is that, regionally, 88% of housing growth in the Framework is expected to come
from areas we have identified in the Framework and 12% is expected to be through ‘business as usual’ infill
throughout the region, with just over half of this infill being in Wellington City.
Of the 88% housing growth from areas identified in the Framework:
» One-quarter is expected to be accommodated in Wellington City (excluding Tawa in the western
corridor), including the Let’s Get Wellington Moving corridor.
» Nearly one-third is expected to be accommodated in the eastern corridor from Lower Hutt to
Masterton, with just over one third of this corridor’s growth occurring in the Wairarapa.
» The remainder (just over 40%) is expected to be accommodated in the western corridor from
Tawa to Levin.
Part 4 | Strategies and Policies 10South Wairarapa District Council | Long Term Plan 2021/31
The Framework identifies improving west-east connections as an opportunity to unlock growth, improve
resilience and improve regional accessibility to economic and social opportunities. The potential housing and
urban development capacity of any future west-east multi-modal corridor(s) has yet to be determined and will
need consideration alongside potential transport interventions.
The Framework aligns with our work through the development of Council’s Spatial Plan, Infrastructure and
Financial Strategies.
Environmental
Greater Wellington Regional Council provided the Climate Change Assumptions for the Wellington region and
Wairarapa combined. These projections depend on future greenhouse gas emissions. As these are uncertain,
the below information includes projections based on scenarios ranging from low to high greenhouse gas
concentrations.
The projected changes are calculated for 2031–2050 (referred to as 2040) and 2081–2100 (2090) compared to
the climate of 1986–2005 (1995).
Table 2: Projected Environmental Changes (Temperature and Seasonality)
RUAMĀHANGA WAIRARAPA RUAMĀHANGA WAIRARAPA
WHAITUA COAST WHAITUA WHAITUA COAST WHAITUA
2040 2040 2090 2090
+0.7 to +1°C above +0.5 to +1°C above +1.2 to +3°C above +1 to +3°C above
Average annual T°C
present present present present
Between 0 and 30 Between 5 and 30 Between 0 and 80 Between 15 and 60
Hot days (above 25°C)
days increase days increase days increase days increase
Between 0 and 15 Between 0 and 5 Between 0 and 40 Between 0 and 15
Frost nights
days reduction days reduction days reduction days reduction
Annual Growing Degree Days (GDD)
base 10°C
GDD = (T°Cmax + T°Cmin)/2) - Increase of 0 to 300 Increase of 0 to 300 Increase of 200 to Increase of 200 to
T°Cbase GDD units GDD units 1000 GDD units 900 GDD units
Measures potential for crop and
pasture growth
Annual potential
evapotranspiration deficit (mm) +20 to +120 mm +40 to +120 mm +0 to +180 mm +40 to +160 mm
Measures drought intensity
Table 3: Projected Environmental Changes (Wind)
RUAMĀHANGA WAIRARAPA RUAMĀHANGA WAIRARAPA
WHAITUA COAST WHAITUA WHAITUA COAST WHAITUA
2040 2040 2090 2090
0 to 4 days 0 to 6 days 0 to 12 days 0 to 10 days
Annual number of windy days
increase increase increase increase
Intensity of wind during windy days 0% to 3% increase
0% to 3% increase 1% to 4% increase 1% to 4% increase
(>99th percentile of daily mean)
Part 4 | Strategies and Policies 11South Wairarapa District Council | Long Term Plan 2021/31
Table 4: Projected Environmental Changes (Rainfall Patterns and Intensity)
RUAMĀHANGA WAIRARAPA RUAMĀHANGA WAIRARAPA
WHAITUA COAST WHAITUA WHAITUA COAST WHAITUA
2040 2040 2090 2090
5% decrease to 5% 5% decrease to 5% 0% to 10% 10% decrease to
Average annual rainfall
increase increase decrease 5% increase
Amount of rain falling during heavy
0% to 10% 0% to 15% 0% to 20% 0% to 30%
rainfall days (>99th percentile of daily
increase increase increase increase
rainfall)
River mean annual low flow discharge
(MAL) Up to 60% Up to 60% Up to 80% Up to 80%
Measures water shortage in the decrease decrease decrease decrease
catchments
River mean annual flood discharge 20% decrease to 20% decrease to 20% decrease to 20% decrease to
(MAF) 40% increase 20% increase 60% increase 60% increase
Measures flood potential in the depending on depending on depending on depending on
catchments catchment catchment catchment catchment
Days of very high and extreme forest 100% to 150% 100% to 150% 100% to 150% 100% to 150%
fire danger increase increase increase increase
Table 5: Projected Environmental Changes (Sea Level and Coastal Hazards)
2040 2090
Permanent sea level rise +0.12 m to +0.24 m above present +0.68 m to +1.75 m above present
Table 6: Projected Environmental Changes (Oceanic Changes)
2040 2090
Acidification of the ocean Acidification of the ocean
General temperature rise of sea water General temperature rise of sea water
Marine heatwaves Marine heatwaves
Part 4 | Strategies and Policies 12South Wairarapa District Council | Long Term Plan 2021/31
What this might mean for Wellington and Wairarapa
Table 7: Environmental Implications for Wellington and Wairarapa
Environmental Implications
Coastal hazards The region is particularly vulnerable to even a small rise in sea level
because of its small tidal range. There may be an increased risk to
coastal roads and infrastructure from coastal erosion and
inundation, increased storminess and sea-level rise.
Heavy rain The capacity of stormwater systems may be exceeded more
frequently due to heavy rainfall events which could lead to surface
flooding. River flooding may also become more frequent,
particularly in low-lying areas. Floods are likely to become more
intense.
Erosion and landslides More frequent and intense heavy rainfall events are likely to lead to
more erosion and landslides.
Droughts More frequent droughts are likely to lead to water shortages,
increased demand for irrigation and increased risk of wildfires.
Biosecurity Climate change could lead to changes in pests and diseases over
time. A likely increase in weed species and subtropical pests and
diseases could require new pest management approaches. Regional
biodiversity may be threatened by changing temperature and
rainfall patterns, and sea level rise.
Agriculture Warmer temperatures, a longer growing season and fewer frosts
could provide opportunities to grow new crops. Farmers might
benefit from faster growth of pasture and better crop growing
conditions. However, these benefits may be limited by negative
effects of climate change such as prolonged drought, water
shortages and greater frequency and intensity of storms.
Coastal vulnerability
The Wellington Region Climate Change Working Group commissioned a report to assess the coastal
vulnerability of the Wellington region to climate change, sea level rise and natural hazards 5. The report is
intended to assist Councils in working with affected communities to develop long-term strategies.
The coastal area of South Wairarapa was divided into three units – Onoke, Palliser and South Wairarapa Coast.
Each unit was assessed against criteria grouped into the following areas: Community, Business, Three Waters,
Lifelines Infrastructure, Māori and cultural, Ecological, Erosion, and Civil Defence and Emergency Management.
5
https://www.gw.govt.nz/assets/Uploads/Wellington-Regional-Coastal-Vulnerability-AssessmentJune-2019Final.pdf
Part 4 | Strategies and Policies 13South Wairarapa District Council | Long Term Plan 2021/31
Table 8: South Wairarapa Coastal Units in Vulnerability Assessment
South Wairarapa Coastal Units in Vulnerability Assessment
Onoke Western point begins at Onoke beach and the Eastern point is the
end of Onoke Beach
It includes Lake Onoke and the Ruamahanga River Mouth
The coast is characterised by a mix of sand and gravel beach and is
primarily populated by baches
There is 22.11km of coastline
Palliser Western point is the end of Onoke beach where the coastline turns
south and the Eastern point is Cape Palliser
It includes Whatarangi, Ngawi and Mangatoetoe
The coast has a mix of small communities facing various degrees of
hazards. The geology struggles for vegetation
There is 30.59km of coastline
South Wairarapa Coast South Wairarapa Western point is Rocky Point and
Eastern/Northern point is Honeycomb Rock
It includes White Rock and Pahaoa
The coast only a few small settlements (run holding stations) and
limited road access
There is 68.29km of coastline
Overall, this assessment identified Palliser as the most vulnerable coastal unit within the Wairarapa. This is due
to its vulnerability in relation to erosion risk and roading (a combination of single access and priority roads at
risk).
While Onoke and South Wairarapa Coast were assessed as moderately vulnerable overall, this is more based
on high vulnerability when considering ecological indicators. The ecological indicators considered include
environmental sites, significant bird sites and coastal biodiversity.
Particular environmental impacts are discussed further in each infrastructure area as the effects are different
for each.
Political factors
Three water reforms
The Three Waters Review6 was initiated in mid-2017 as a cross-agency initiative led by the Department of
Internal Affairs (DIA) to look into the challenges facing our drinking water, wastewater and stormwater (“three
waters”) and to develop recommendations for system-wide performance improvements.
Through this review, Government is seeking the following major outcomes:
» Safe, acceptable (taste, colour and smell) and reliable drinking water
» Better environmental performance
» Efficient, sustainable, resilience and accountable water services
» Achieving these aims in a way communities can afford
6
https://www.dia.govt.nz/Three-waters-review
Part 4 | Strategies and Policies 14South Wairarapa District Council | Long Term Plan 2021/31
This has seen the development of new legislation and the creation of Taumata Arowai, the new Water Services
Regulator, to oversee and enforce a new drinking water regulatory framework. It also includes an oversight
role for wastewater and stormwater networks.
In July 2020, the Government announced a $761 million package to provide immediate post-COVID-19
stimulus to local authorities to maintain and improve three waters infrastructure, support reform of local
government water services delivery arrangements, and support the operation of Taumata Arowai. South
Wairarapa District Council signed a Memorandum of Understanding with the DIA in August 2020 to participate
in the first stage of the reforms. The service delivery model will be informed by discussion with the local
government sector taking into account the following design features:
» Water service delivery entities, that are:
» Of significant scale (most likely multi-regional) to enable benefits from aggregation to be
achieved over the medium to long-term;
» Asset owning entities, with balance sheet separation to support improved access to capital,
alternative funding instruments and improved balance sheet strength; and
» Structured as statutory entities with appropriate and relevant commercial disciplines and
competency-based boards;
» Delivery of drinking water and wastewater services as a priority, with the ability to extend to
stormwater service provision only where effective and efficient to do so;
» Water entities would be publicly owned entities, with a preference for collective council
ownership;
Mechanisms for enabling communities to provide input in relation to the new entities.
The Government is expected to make substantive policy decisions relating to the reforms in April/May 2021 to
enable legislation to be prepared for introduction. This includes decisions on the core design features of the
new water services entities and the number and boundaries of these entities.
Councils will be asked to decide about participating in the new service delivery system in late 2021. This would
take the form of an ‘opt out’ approach meaning all councils will be included in one of the new water service
delivery entities by default but can decide not to continue to participation in consultation with their
communities. Central government is expecting to provide councils with a package of supporting information
including details on the entity design proposals (e.g. ownership and governance arrangements), financial and
other implications of participating, and which entity each council would be part of to inform the decision-
making process.
Introduction of legislation to create the new service delivery system is expected in late 2021, with enactment
by mid-2022. For councils that participate in the reforms, any transfer of responsibilities and assets is expected
in around 2023/24.
Part 4 | Strategies and Policies 15South Wairarapa District Council | Long Term Plan 2021/31
Regulation of drinking water
The Taumata Arowai–the Water Services Regulator Act 2020 received Royal Assent on 6 August 2020. The
purpose of the act is to establish Taumata Arowai – the Water Services Regulator as a Crown Agent and
provide for its objectives and general functions, including:
» administering and enforcing a new drinking water regulatory system (including the management
of risks to sources of drinking water); and
» a number of complementary functions to improving the environmental performance of
wastewater and stormwater networks.
In July 2020, a complementary Bill, the Water Services Bill, was introduced to Parliament to give effect to
Government’s decisions on reforming the drinking water regulatory framework and Taumata Arowai’s
wastewater and stormwater functions. Taumata Arowai will not become fully operational until the Water
Services Bill is enacted which is expected to be in end-20217.
Since the last Infrastructure strategy, SWDC has invested significantly in achieving compliance with the current
NZ Drinking Water Standards. This has included multi-barrier treatment (i.e. chlorination and UV treatment)
and improved monitoring and communication systems. As a result, SWDC are well positioned to comply with
emerging regulatory framework, with the support of Wellington Water, and continued investment in water
treatment is required through this strategy and includes the operational and maintenance costs of the
improved systems.
National Environmental Standards for Freshwater
The Resource Management (National Environmental Standards for Freshwater) Regulations 2020 (Freshwater
NES) regulates activities that pose risks to the health of freshwater and freshwater ecosystems 8. The standards
came into force on 3 September 2020 and are designed to:
» Protect existing inland and coastal wetlands
» Protect urban and rural streams from in-filling
» Ensure connectivity of fish habitat
» Set minimum requirements for feedlots and other stockholding areas
» Improve poor practice intensive winter grazing of forage crops
» Restrict further agricultural intensification through to the end of 2024
» Limit the discharge of synthetic nitrogen fertiliser to land, and require reporting of fertiliser use.
In many cases, people will need to apply for a resource consent from the regional council to continue carrying
out regulated activities.
Resource Management Act 1991 Reforms
The Government is reforming the resource management system and intends to repeal and replace the
Resource Management Act 1991 (RMA) which is the primary legislation governing the use of our land, water
7
https://www.dia.govt.nz/Taumata-Arowai-Establishment-Unit
8
https://www.mfe.govt.nz/fresh-water/freshwater-acts-and-regulations/national-environmental-standards-freshwater
Part 4 | Strategies and Policies 16South Wairarapa District Council | Long Term Plan 2021/31
and air resources. Its aim is for the RMA to support a more productive, sustainable an inclusive economy and
be easier for New Zealanders to understand and engage with9.
The RMA is intended to be replaced with three new pieces of legislation – the Natural and Built Environments
Act, Strategic Planning Act and Climate Change Adaption Act.
The Natural and Built Environments Act is the core piece of legislation to replace the RMA and is
intended to enhance the quality of the environment to support the wellbeing of present and future
generations. The Strategic Planning Act provides a long-term strategic approach to how we plan for
using land and the coastal marine area while the Climate Change Adaption Act supports New
Zealand’s response to the effects of climate change and would address complex legal and technical
issues associated with managed retreat and funding and financing adaptation.
Ministry for the Environment has set out the timeframes for the reform process as:
» May – September 2021: An exposure draft of the Natural and Built Environment Bill will be
agreed by Cabinet and then referred to a special select committee inquiry. The Strategic Planning
Bill and Climate Change Adaptation Bill will be developed in a parallel process with the latter
managed out of the Minister for Climate Change office.
» December 2021: The Natural and Built Environments Bill and the Strategic Planning Bill will be
introduced to Parliament in late 2021. A standard select committee process will consider them.
The Climate Change Adaptation Act will be developed in a similar timeframe.
» December 2022: It is intended the three new pieces of legislation are passed by the end of 2022.
Government Policy Statement on Land Transport
The Government Policy Statement on Land Transport (GPS) outlines the government’s priorities for
expenditure over the next 10 years. It sets out how funding is allocated between activities such as road safety
policing, state highway improvements, local and regional roads and public transport.
The current GPS took effect on 1 July 2018 and prioritised a safer transport system free of death and injury,
accessible and affordable transport, reduced emissions and value for money10.
The Ministry of Transport has released its GPS for 2021/22–2030/3111 which builds on the strategic direction
of GPS 2018 by maintaining the priorities but updating them to align with recent policy work. The Government
is proposing to prioritise safety, better transport options, improving freight connections, and climate change.
The GPS 2021 will take effect from July 2021.
Regional Land Transport Plan 2021
The process to develop the Wellington Regional Land Transport Plan 2021 (RLTP 2021) is underway. The RLTP
sets the strategic direction for the region's transport network for the next 10-30 year. It describes the long-
term vision, identifies regional priorities and sets out the transport projects for investment over the next 10
years.
9
https://www.mfe.govt.nz/rma/resource-management-system-reform
10
https://www.transport.govt.nz/assets/Uploads/Our-Work/Documents/c6b0fea45a/Government-Policy-Statement-on-land-transport-
2018.pdf
11
https://www.transport.govt.nz//assets/Uploads/Paper/GPS2021.pdf
Part 4 | Strategies and Policies 17South Wairarapa District Council | Long Term Plan 2021/31
Investment in the region’s transport system will be guided by the following priorities:
Table 9: Transport Investment Priorities
Transport Priorities
Public Transport Build capacity and reliability into the Wellington Region’s rail
Capacity network and into the Wellington City public transport
network to accommodate future demand
Travel Choice Make walking, cycling and public transport a safe, sustainable
and attractive option for more trips throughout the region
Strategic Access Improve access to key regional destinations such as ports,
airports and hospitals for people and freight
Safety Improve safety, particularly at high risk intersections and on
high risk rural and urban roads
Resilience Build resilience into the region’s transport network by
strengthening priority transport lifelines and improving the
redundancy in the system
Road to Zero Strategy
In December 2019, the Government launched ‘Road to Zero,’ New Zealand’s Road Safety Strategy 2020 –
203012.
The strategy sets out the governments vision for a New Zealand where no one is killed or seriously injured in
road crashes. As an intermediate target towards achieving its vision, the target is to reduce deaths and serious
injuries on our roads by 40 percent by 2030 (from 2018 levels).
The strategy will be implemented through a series of separate action plans which focus on the following five
key areas:
» Infrastructure improvements and speed management
» Vehicle safety – significantly improve the safety
» Work-related road safety
» Road user choices
» System management
Funding Strategy
South Wairarapa District Council is a small rural local authority, with a relatively high infrastructural asset base
per capita, and a relatively small ratepayer base. Small local authorities generally have very little discretionary
expenditure and are therefore required to focus heavily on maintaining current service levels and their
infrastructural asset base.
12
https://www.transport.govt.nz/multi-modal/keystrategiesandplans/road-safety-strategy/
Part 4 | Strategies and Policies 18South Wairarapa District Council | Long Term Plan 2021/31
This strategy reflects this focus, while concentrating on increasing network resilience. We are confident our
asset planning, LTP and infrastructure strategy will ensure the longevity of the asset base and maintenance of
service levels while retaining financial health.
Debt is generally only undertaken for new assets, with replacements of existing assets made from depreciation
reserves built up for that purpose.
Financial sustainability is fundamental to the long-term sustainability of the district. The forecasts have been
prepared on the basis that, as a minimum, existing levels of service will be maintained. Demand is assessed
against existing capacity of the network and treatment plants. Increasing demands from population growth
have informed these requirements. Further modelling work form part of the LTP to assess the impacts of
growth.
What we’ve achieved
Since the last Infrastructure Strategy, SWDC has:
» Achieved full Drinking Water Standards compliance at all Water Treatment Plants, including the
commissioning of the Manganese Reduction Plant in Martinborough to enable the chlorination of
the town supply,
» Completed the upgrades for Greytown and Martinborough Wastewater Treatment plants and
gained related long-term consents,
» Increased water supply resilience through the commissioning of a fourth bore and treated water
reservoirs at the Waiohine water treatment plant,
» Improved the automation, operating practices and Health and Safety practices at our WWTPs to
improve their compliance and overall performance,
» Enhanced compliance with Healthy Homes requirements for our Senior Housing,
» Started a trial of the ecoreef coastal erosion solution to improve resilience of the Cape Palliser
Road,
» Completed the Waihinga Centre and Martinborough playground,
» Updated the notable trees register,
» Developed Climate Change and Positive Ageing Strategies, and established a Community
Development function in Council, which will help inform our future infrastructure investment,
and
» Wairarapa Solid Waste Management and Minimisation Bylaw 2021.
What has changed
How we manage our infrastructure assets has also changed (or is subject to review). Since the last LTP we
have:
» Contracted for and implemented Ruamahanga Roads, a shared service for Roading with Carterton
District Council (CDC) with Fulton Hogan as our contractor, from the 1 st July 2019, and
» Become a shareholder in Wellington Water Limited, a council controlled organization, and moved
the management of our three waters infrastructure to it, from 1st October 2019.
Part 4 | Strategies and Policies 19South Wairarapa District Council | Long Term Plan 2021/31
Asset Management for SWDC Infrastructure
To deliver value for South Wairarapa ratepayers the Council, through this Infrastructure Strategy, is looking to
optimise the investment in our assets to ensure we comply with our regulatory obligations and to meet the
needs of our community, both now and in the future.
This involves having clear strategies, asset planning and activity schedules to ensure optimal performance
through:
» Ongoing operation of assets – ensure SWDC assets are used and operated in such a manner so as
to prolong the asset life,
» Preventative Maintenance – the undertaking of regular servicing of assets to minimise the
likelihood of asset failure, particularly for critical infrastructure,
» Reactive Maintenance – responding to and repairing an asset failure (i.e., broken pipe, roadside
slips),
» Renewals – the replacement or restoration of an existing asset to extend its economic life, and
» Upgrades – to meet an increase in demand (i.e. from growth, regulatory changes or service
changes).
What the right mix of investment is for each asset is derived from multiple considerations:
» Current asset condition and projected life,
» Asset criticality,
» Data confidence – how sure are we that the data we have is accurate and up to date,
» Future demand forecasts and growth indicators, and
» Financial data – valuation and depreciation
Asset information and analytics
As part of our ongoing focus on improving our knowledge and understanding of our Infrastructure assets, we
capture asset condition data through multiple sources:
» Visual inspection
» CCTV footage and data (most relevant for under ground assets)
» User experience and reported issues
» Technical or expert analysis
» Extrapolation from other data sources (i.e. other Territorial Authorities’ data for similar assets
exposed to similar use and environmental impacts)
» Sampling and testing
» Emerging technology (i.e. use of drones to fly over Cape Palliser Road to assess coastal erosion
changes)
This information is then analysed across multiple tools to inform our asset planning, which feed into this
Infrastructure Strategy.
Part 4 | Strategies and Policies 20South Wairarapa District Council | Long Term Plan 2021/31
Asset Criticality
One of the key determinants for the best asset management approach to meet our service goals and comply
with regulations is to proactively manage our critical assets so that the chance of failure is minimised. Critical
assets are those where the consequences of failure would be significant and this needs to be avoided (even if
the likelihood of failure is low). These critical assets are prioritised for preventative maintenance activity and
ongoing asset condition assessment and analysis. For SWDC, they include:
» Water Treatment Plants
» Wastewater Treatment Plants
» Road bridges
Council will continue to monitor the condition of these assets. Upgrades of our Water and Wastewater
treatments plants have been undertaken over the last few years and preventative maintenance schedules and
improved operating procedures have been designed and implemented to increase the life of the assets.
A full condition assessment for our road bridges is planned and budgeted for. Similarly, we will optimise the
life of these assets through their lifecycle. Some bridges may require more than simple maintenance and this
will be considered as part of the condition assessment and planning activity.
Three Waters
The Three Waters Reform programme is an ongoing process and this portion of the Infrastructure Strategy will
be heavily impacted by the programme as it progresses. However, until the outcome of the review is known,
Council will continue to develop the Three Waters strategy in conjunction with Wellington Water.
Similarly, the establishment of Taumata Arowai as the NZ Three Waters regulator from July 2021, is likely to
see a fundamental shift in the regulation of waters services. From that time the regulator will:
» oversee and administer, and enforce a new, expanded and strengthened drinking-water
regulatory system, to ensure all New Zealand communities have access to safe drinking water,
and if need be we will hold suppliers to account, and
» provide oversight of the regulation, management, and environmental performance of
wastewater and storm-water networks, including promoting public understanding of that
performance.
In conjunction with WWL and their other shareholding Councils, SWDC will continue to engage with the
Taumata Arowai establishment unit to ensure our activities are aligned with the emerging strategy of the new
regulator.
Since the last Infrastructure Strategy, SWDC has completed a range of initiatives across the Three Waters
infrastructure, including achieving compliance with the NZ Drinking Water Standards (NZ DWS), upgrades and
consents for the Martinborough and Greytown Wastewater Treatment Plants (WWTPs) and improved network
resilience through treated water storage and increased supply. With these improvements there is a greater
need for operating and maintenance budgets to keep the new equipment operating effectively.
Part 4 | Strategies and Policies 21South Wairarapa District Council | Long Term Plan 2021/31
Resource consents have been established for our critical water assets, as shown below:
» Greytown and Featherston WTPs to Sept 2037
» Martinborough WTP to Sept 2037
» Pirinoa WTP to 2025Greytown WWTP to 2025 (upgrades required for next phase of consent
and identified below)
» Martinborough to 2051 (ongoing investment required to irrigate to land)
With improvements made to these critical assets, investment (see Water Issue 3 and wastewater issue 3
below) is increasingly required in our Drinking and Wastewater networks. It is becoming apparent that our
network assets are no longer performing at a level that consistently meets the needs of our community. The
focus of the Three Waters portion of this Infrastructure Strategy focuses on improving network performance
through increased renewals as well as operating and maintenance funding and activities.
There are also two key areas where the SWDC approach is still being developed, the Featherston Wastewater
Treatment Plant and the future of the Moroa and Longwood Water Races. This strategy outlines our current
understanding, timelines for developing our approach and how we will engage our community on these two
areas. Both of these projects are heavily influenced by the new Freshwater Regulations and ongoing Water
Reform.
Strategic alignment
Improving Three Waters delivery and environmental
quality is a key strategic driver for the Council. This is
supplemented by the role that Three Waters assets play
in supporting the economic, social and environmental
wellbeings that underpin Council activities and also
community feedback from the 2020/2021 Council
Annual Plan and our pre-LTP engagement that
overwhelmingly endorsed water as the priority for
Council (80% of respondents supported this).
In conjunction with WWL, the following priorities have
been agreed to shape and inform our (and the other
WWL shareholding Councils) infrastructure strategy for
Three Waters.
Scope and delivery arrangements
In October 2019, Wellington Water (WWL) assumed the management responsibility for our Three Waters
assets (ownership of the assets remained with Council). This is the first SWDC Three Waters infrastructure
strategy informed by WWL.
Network and Treatment Plant maintenance is undertaken by the WWL network maintenance alliance, which
combines WWL and Fulton Hogan staff, and network renewals are designed, managed and delivered by
consultant and contractor panels as well as in-house specialists.
The SWDC Three Waters assets, maintained by WWL, comprises:
Part 4 | Strategies and Policies 22South Wairarapa District Council | Long Term Plan 2021/31
Drinking Water:
» 118km of pipes
» Four Water Treatment Plants (WTPs):
» Waiohine
» Soldiers’ Memorial Park
» Martinborough
» Pirinoa
» 5800 Fittings (i.e. valves, hydrants)
» 11 Reservoirs or Tanks
Wastewater:
» 75km of pipes
» Four Wastewater Treatment Plants:
» Featherston
» Greytown
» Martinborough
» Lake Ferry
» 11 Pump Stations
Stormwater/Drainage:
» 15km of pipes
» 100 Fittings
» 18km of channels
» 2407 culverts
» 574 sumps
The sumps and culverts associated with the wider stormwater network in SWDC are maintained under the
Ruamahanga Roads contract.
Part 4 | Strategies and Policies 23South Wairarapa District Council | Long Term Plan 2021/31 The following map provides a high level view of the SWDC’s three waters assets: Figure 6: Council’s Three Water Assets Part 4 | Strategies and Policies 24
South Wairarapa District Council | Long Term Plan 2021/31

Figure 7: Council’s Drinking Water Network

The following diagrams show the Drinking Water network configuration:

                                                                        25
South Wairarapa District Council | Long Term Plan 2021/31
In addition, WWL also operate and maintain two water races on behalf of Council.
Moroa Water Race: Figure 8: Moroa Water Race Network
» 240km in total length
» Services approximately 8500ha
» 282 ratepayers serviced
» Water from Waiohine River
Longwood Water Race: Figure 9: Longwood Water Race Network
» 40km in total length
» Services approximately 1500ha
» 62 ratepayers serviced
» Water from Tauherenikau River
Part 4 | Strategies and Policies 26South Wairarapa District Council | Long Term Plan 2021/31 Three Waters Asset Profile The following tables outline the age distribution, material and size of the SWDC water networks. Table 9: Three Waters Asset Profile Part 4 | Strategies and Policies 27
South Wairarapa District Council | Long Term Plan 2021/31

From this profile, several observations can be made:

           »     Almost half of our water supply pipes and almost 60% of wastewater pipes are over 40 years old,
           »     70% of the wastewater pipes are made from brittle materials that are more vulnerable to
                 cracking and breaking when subject to ground movement (e.g. earthquakes),
           »     35% of the water supply pipes are made from asbestos cement. It is becoming increasingly
                 evident across the District, and the wider Region, that this material is not meeting its expected
                 asset or design life and is failing before expected (probably exacerbated by ground movement, as
                 per above)
           »     Parts of our wastewater network are likely to be undersized to meet likely growth in the District.

Levels of Service
Below is a sample of the levels of service and key performance indicators for the Water Supply activity. A full
list with future year targets can be found in the water supply significant activity section. Note that the last
customer survey was carried out in October 2018 and will be carried out again in 2021.

 SERVICE LEVEL                                   KEY PERFORMANCE INDICATORS                      2019/20       PERFORMA       HOW IT
                                                                                                  RESULTS          NCE        WILL BE
                                                                                                                 TARGET      MEASURED
                                                                                                                2021/22
 Potable water demand              The average consumption of drinking water per day per           558 Lt
You can also read