Introducing Chorus Mark Ratcliffe Chief Executive - 16 September 2015 - Chorus NZ
←
→
Page content transcription
If your browser does not render page correctly, please read the page content below

Introducing
Chorus
Mark Ratcliffe
Chief Executive   16 September 2015

                                      / PAGE 1
Disclaimer
>   This presentation may contain forward-looking statements regarding future events and the future financial
    performance of Chorus, including forward looking statements regarding industry trends, regulation and the
    regulatory environment, strategies, capital expenditure, the construction of the UFB network, possible
    business initiatives, credit ratings and future financial and operational performance. These forward-looking
    statements are not guarantees or predictions of future performance, and involve known and unknown risks,
    uncertainties and other factors, many of which are beyond Chorus’ control, and which may cause actual
    results to differ materially from those expressed in the statements contained in this presentation. No
    representation, warranty or undertaking, express or implied, is made as to the fairness, accuracy or
    completeness of the information contained, referred to or reflected in this presentation, or any information
    provided orally or in writing in connection with it. Please read this presentation in the wider context of
    material published by Chorus and released through the NZX and ASX.

>   Except as required by law or the NZX Main Board and ASX listing rules, Chorus is not under any obligation
    to update this presentation at any time after its release, whether as a result of new information, future
    events or otherwise.

>   The information in this presentation should be read in conjunction with Chorus’ audited consolidated
    financial statements for the year ended 30 June 2015. This presentation includes a number of non-GAAP
    financial measures, including "EBITDA”. These measures may differ from similarly titled measures used by
    other companies because they are not defined by GAAP or IFRS. Although Chorus considers those
    measures provide useful information they should not be used in substitution for, or isolation of, Chorus'
    audited financial statements. Refer to the presentation appendices for further detail relating to EBITDA
    measures.

>   This presentation does not constitute investment advice or a securities recommendation and has not taken
    into account any particular investor’s investment objectives or other circumstances. Investors are
    encouraged to make an independent assessment of Chorus.

                                                                                                       / PAGE 2
The streaming revolution
Broadcast TV                Streaming TV

                 Launch of Lightbox, Netflix NZ, Neon in FY15

                 12% of Kiwi households now say internet
                 streaming is main way of watching TV

                 Kiwi households now have an average of 4
                 internet capable devices

                                                  / PAGE 3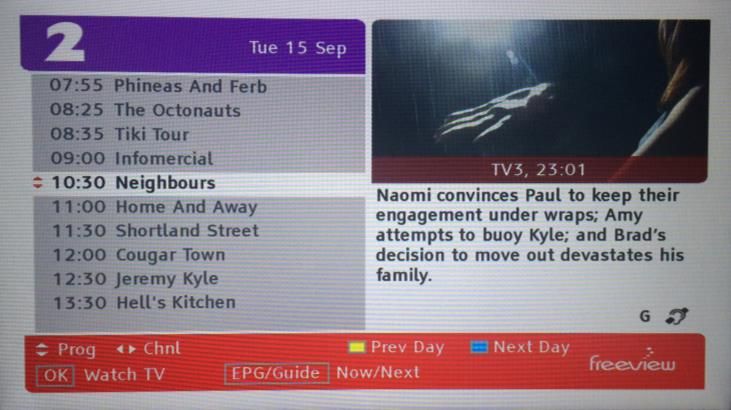
Bandwidth demand
> Annual bandwidth growth has traditionally been 50%
> Chorus network traffic grew 77% in FY15

          (1) Average speed across all Chorus Layer 2 Broadband Connections
          (2) Average throughput in the busiest 15 minute measurement period

                                                                               / PAGE 4
NZ fixed line market
          > Significant changes in FY15: video content, RSP consolidation
               and new entrants

 Pay TV                            Sky TV                                                                             Electricity
                                Deploying IP                                                                            sector
                                set-top boxes

Subscription                       Neon             Lightbox                   Netflix              Quickflix
video on
                                                                     Launched in NZ in March 2015
demand

     Retail      Vodafone              2o              Spark             M2              Others         Trustpower
    service                                                              + Callplus      My Republic
                  + Worldxchange       + Snap                                                            $49 intro plan
                                                                         + Orcon         Now
   provider                                                              + Woosh

  Fixed line
               HFC cable:
                                   Chorus                                                       Local Fibre Companies
               Wellington +                                                                                  Northpower
    access     Christchurch
                                                                                            Enable
                                • Copper broadband coverage to 97% lines (VDSL 60%)                          Ultrafast Fibre
  network      ~60k end-users   • 14% fibre uptake at 30 June 2015                         Fibre past ~250k end-users and ~35,000
                                                                                           connections at 30 June 2015

                                                                                                                   / PAGE 5
Bringing NZ better broadband

        > $1.9 billion invested in fibre networks and
           capability since demerger

           ▪ 588,000 end-users able to benefit from
             UFB/RBI

           ▪ 60% able to access better broadband than
             they use today

           ▪ fibre available at ~2,000 schools across New
             Zealand

           ▪ NZ 1st in OECD for fibre growth

           ▪ Chorus first NZ employer to win supreme
             award in Aon Hewitt Best Employer awards

                                                   / PAGE 6
Chorus connections
                                    1,784,000    1,777,000   1,794,000

Number of
                                                 1,163,000   1,207,000
connections                          1,112,000
                        1,040,000

> connection numbers have been assisted to date by enhanced rural broadband
     coverage, migration and dwelling increases

> pressure on connections expected from changes to dual copper-fibre lines,
     the expansion of local fibre company coverage and mobile substitution

                                                                         / PAGE 7
Fibre market                                                                    30%

> 88,000 fibre connections nationwide (FY14:
   42,000)
   ▪ 68,000 fibre connections within UFB deployed                                    22%
      footprint (FY14: 27,000)
   ▪ ~2,000 mass market connections added outside
      Chorus planned UFB
   ▪ smaller RSPs continue to gain greater proportion of
      fibre market

> More RSPs promoting 100Mbps as standard
   fibre plan                                                            Premium business fibre
                                                           14,000
   ▪ July 2015: ~75% of net adds and changes
       100Mbps+                                            12,000
                                                                           30%
   ▪   100/20Mbps fibre (Accelerate) now $41 per month     10,000

   ▪   30/10Mbps fibre now $38.50 per month                 8,000
                                                            6,000

> Demand for premium business fibre continues               4,000
                                                            2,000
                                                               0
                                                                           FY14                      FY15
                                                                    Bandwidth Fibre + HSNS   Direct/dark fibre

                                                                                             / PAGE 8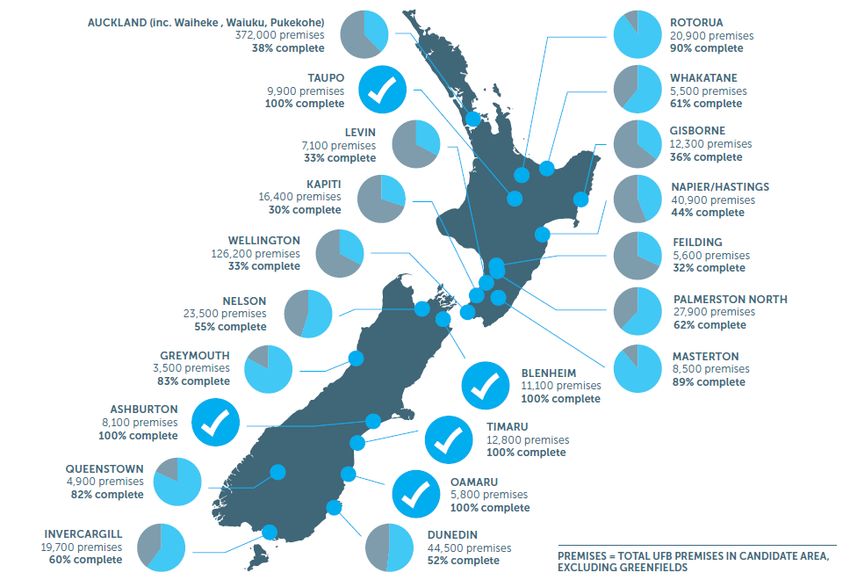
UFB build on track

               FY16: expect to complete Waiuku,
               Rotorua, Queenstown

                                    / PAGE 9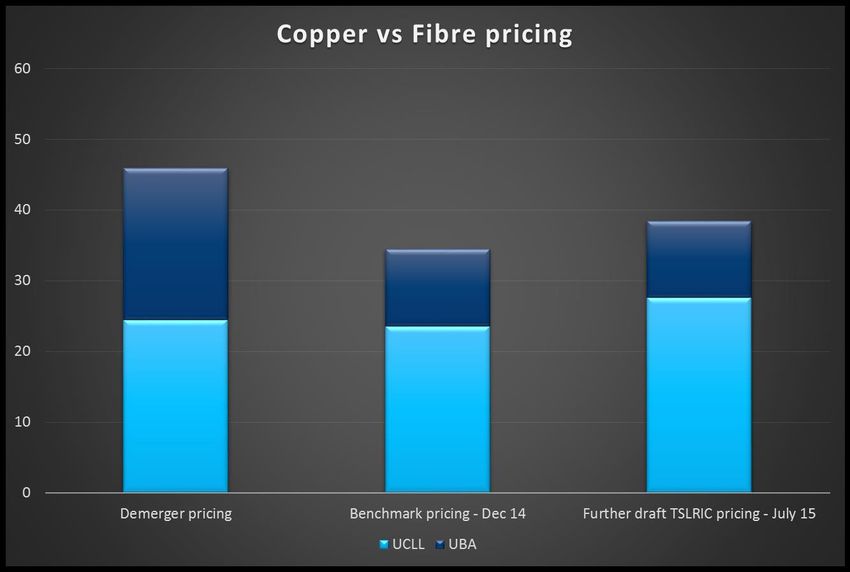
FY15 UFB communal capex
> Communal deployment progressing well; transition in build mix as move
    from CBDs into more suburban areas
    ▪ $236m with build complete for 107,000 premises
    ▪ $2,134 average cost per premises passed (CPPP) below $2,150-$2,400 target
    ▪ FY16 CPPP guidance range of $1,700 - $1,770
    ▪ No change to UFB communal guidance of $1.75 - $1.80bn for total programme

 $3,500

                                                                       Year 5 Range
                                                                      $1,700 - $1,770

                        H1 FY13 View   Results to date/FY16 outlook

    $0
           2012                                                            2016

                                                                                        / PAGE 10
Regional fibre uptake vs build
Chorus UFB Uptake by Candidate Area – June 2015
20% 100%
18% 90%
Uptake relative to capable addresses
% of build completed (premises)
16% 80%
14% 70%
12% 60%
10% 50%
8% 40%
6% 30%
4% 20%
2% 10%
0% 0%
UFB Uptake June % build complete June
Chart shows end-user uptake as a proportion of UFB capable addresses (i.e. network is commissioned for service)
ranked according to proportion of build complete premises in each area
/ PAGE 11Fibre adoption curve to date
Technology adoption in NZ (% of households)
Fibre uptake based on % addresses covered, given incremental build
DSL/broadband
75%
Sky TV
51%
Fibre
Dial up 4%
Years from launch
Sources: Statistics NZ Household Use of ICT survey 2009, 2012 (household dial-up/broadband uptake), ISCR
estimates of DSL diffusion (DSL/broadband uptake), SKY annual reports (Sky TV uptake), MBIE quarterly
reporting (UFB fibre uptake)
/ PAGE 12Taking fibre mainstream
RSP orders in 49,000 mass market connections in FY15.
Scaling up for 80,000 connections in
FY16.
Verify availability
Consent required?
Schedule visit
Reschedules
Cancellations
Average time to connect subject
to agreeing deployment method
/ PAGE 13Rural Broadband rollout
Highly successful programme, tracking to lower end of expected
range of $280-$295 million
> $257m invested to 30 June
> 1,015 schools and 39 hospitals passed by fibre
> 93,000 lines within reach of better broadband; ~85% uptake
> Average synch speed increased from less than 6Mbps to 9.3 Mbps
/ PAGE 14Regulatory history vs share price
> Chorus’ share price performance since demerger in 2011 has been
dominated by regulatory decisions and processes
Commission
Commission releases
draft UCLL further draft
benchmarking FPP decision
Commission Commission
Commission
final UCLL + final UBA
releases draft
draft UBA benchmarking
FPP decision
benchmarking decision
decision
dividend suspended
/ PAGE 15“…New Zealand’s local loop network is unique when compared to overseas
benchmarks…Simplistic comparisons of international wholesale broadband prices
do not tell the true story.” (Commerce Commission media release 2 July 2015)
100/50 Mbps
2020
30/10 Mbps
/ PAGE 16Commission final price review for copper network
> modelling replacement cost using a mixed fibre and wireless network
> have not used extensive deployment cost data provided by Chorus
Some key Hypothetical network in July (second) draft decision
components
Trenching costs • 50% below actual current experience and impossible to achieve.
• Key network components (e.g. laterals) excluded.
• Auckland costs less than Arthurs Pass.
Operating • 40% efficiency adjustment.
expenditure • At odds with real world data and regulatory precedent.
WACC • Reduced by 44 basis points since December, as a function of timing.
• 50th percentile.
• Electricity set at 67th percentile - future investment incentives or risk not
accounted for.
Transaction • 30% efficiency factor impossible to achieve and at odds with actual service
charges company costs secured via competitive tender
• Adopted lowest observation of benchmark set
Network valuation • TSLRIC draft of $6.6 billion.
• At a 1/3rd discount to Commission valuation of electricity lines businesses and
50% discount to Chorus’ own valuation based on real world data.
Copper/fibre • 35% below mainstream 100Mbps product in 2020.
relativity • Entry level UFB pricing set below cost to encourage uptake.
/ PAGE 17If the original price was wrong,
it should be corrected.
> Original UCLL benchmarking decision was in December 2012. Chorus
required to charge benchmarked broadband price of $34.44 since 1
December 2014.
> Chorus was required to backdate transaction charges from April 2014 to
December 2012.
> Two Commission draft decisions have now shown the benchmark pricing was
too low.
> The Commission submitted to the Court of Appeal in 2006 that:
“…the s18 aim of promoting competition for the long term benefit of end-users will be
advanced if the efficient price is actually imposed, at a minimum, for the period of the
initial determination."
“…a wind fall from the non application of a reviewed price is a situation that would
clearly offend against the purposes of this part of the act, set out in s18. The
converse also applies if benchmarking has set the initial price too low…”
/ PAGE 18Investors have lost faith in the
regulatory framework
L1 Capital – “Unfortunately the draft determination has made modelling
assumptions which send a strong signal to existing and new investors in
telecommunications services that the regulatory process is biased against the
regulated entity and will impose an impossibly high efficiency standards which will
mean efficient operators will not be able to recover their capital costs. We have
exited part of our shareholding as a direct result of our decreased confidence in the
ability to rely on Commission’s prior views...”
Allan Gray – “…current settings make investors question whether the hypothetical
efficient operator could ever exist in practice. That operator would not be able to
build the network as cheaply as is suggested by the Commission and it would never
be funded. This should be of particular concern to the New Zealand Government,
which seeks further investment in rural broadband and UFB.”
Black Crane – “…the current NZCC regulatory process of Chorus has severely
damaged NZ's credibility with infrastructure investors and damaged its reputation
with the financial markets generally. We believe that the NZCC should set connection
prices to levels that reflect the actual cost of investment. Anything short of this is, in
effect, a partial nationalisation of private assets.”
/ PAGE 19Regulatory impact
overshadows investment
FY15 v FY14 change
> Net Profit After Tax of $91 million 39%
> EBITDA of $602 million 7%
> Revenue of $1,006 million 5%
> Total fixed line connections increased to 1,794,000 1%
> Broadband connections increased to 1,207,000 4%
> Better broadband rollouts on track
▪ UFB premises 44% complete 13%
▪ RBI lines 90% complete 20%
▪ 588,000 end-users within reach of better broadband 38%
/ PAGE 20Income statement
FY15 FY14
$m $m
Operating revenue 1,006 1,058
Operating expenses 404 409
Earnings before interest, tax, 602 649
depreciation and amortisation (EBITDA)
Depreciation and amortisation 324 322
Earnings before interest and income tax 278 327
Net interest expense 151 121
Net earnings before income tax 127 206
Income tax expense 36 58
Net earnings for the period 91 148
Non-statutory measure: FY15 adjusted EBITDA $546m relative to FY14
adjusted EBITDA of $518m (see Appendix 1 management commentary)
/ PAGE 21Reshaping our business
Expenses change year-on-year
> 100+ initiatives; emphasis on restricting 8 860
Employees
discretionary spend 840
6
focus on cash rather than value 820
proactive maintenance and IT separation 4 800
capex deferred 780
2
no dividend 760
0
740
FY13* FY14 FY15
Trade-offs from managing for cash -2
* compared to annualised FY12
720
% change Employees
deferred IT capex = higher opex
reduced maintenance = more faults Capex
cost recovery on copper = reduced demand 40
$m
30
> Longer term programme 20
must continue to assume $34.44 until final
10
Commission determination
some initiatives would be reviewed subject 0
to FPP outcomes Network Copper IT
sustain connections
FY13 FY14 FY15
/ PAGE 22Capital management
> Consistent with previous advice, Chorus will update investors on
dividend policy once the Commission’s final pricing review is complete.
▪ Commerce Commission has indicated December for final
determination
> At 30 June, debt of $1,742m
comprised:
▪ $1,065m long term bank
facilities April
▪
2020
$677m (NZ$ equivalent at
hedged rates) Euro Medium July
2016
Term Note Nov
2017
May
2019
/ PAGE 23> “A predictable, proportionate and
flexible regulatory framework for
communications will enable
competition, innovation, investment,
and growth across the economy
which ultimately is better for
consumers.”
> “…wholesale-only fixed line providers
increasingly resemble businesses that
are subject to ‘utility-style’ regulation
(in particular electricity lines
businesses).”
> Submissions due 27 October
> Targeted consultation on more detailed
implementation issues in early 2016
/ PAGE 24FY16 Outlook
Government
Improve end-user Leverage open
Final price review framework
fibre connections access network
review
Focus on improving returns to shareholders and securing a regulatory
environment that enables shareholders to earn a fair return on the investment
they are making to bring better broadband to New Zealand
/ PAGE 25You can also read