INVESTOR PRESENTATION - August 2021 PRESENTATION - PRO Real Estate Investment ...
←
→
Page content transcription
If your browser does not render page correctly, please read the page content below

INVESTOR
PRESENTATION
August 2021

                  INVESTOR
              PRESENTATION
                   August 2021
Disclaimer

About this Presentation
This presentation is dated August 11, 2021 and is strictly intended to provide general information about PRO Real Estate Investment Trust (“PROREIT”) and its business. This presentation does
not constitute an offer to sell or the solicitation of an offer to buy any securities of PROREIT. The information in this presentation is stated as at June 30, 2021, unless otherwise indicated.

Non-IFRS Measures
PROREIT’s consolidated financial statements are prepared in accordance with International Financial Reporting Standards (“IFRS”). In this presentation, as a complement to results
provided in accordance with IFRS, PROREIT discloses and discusses certain non-IFRS financial measures, including Adjusted Funds From Operations (“AFFO”), Funds From Operations
(“FFO”), Gross Book Value (“Gross Book Value”), Debt to Gross Book Value (“Debt to Gross Book Value”), Net Operating Income (“NOI”), interest coverage ratio and payout ratios as well
as other measures discussed elsewhere in this presentation. These non-IFRS measures are not defined by IFRS, do not have a standardized meaning and may not be comparable with
similar measures presented by other issuers. PROREIT has presented such non-IFRS measures as Management believes they are relevant measures of PROREIT’s underlying operating
performance and debt management. Non-IFRS measures should not be considered as alternatives to net income, cash generated from (utilized in) operating activities or comparable
metrics determined in accordance with IFRS as indicators of PROREIT’s performance, liquidity, cash flow, and profitability. For a full description of these measures and, where applicable, a
reconciliation to the most directly comparable measure calculated in accordance with IFRS, please refer to the “Non-IFRS and Operational Key Performance Indicators” section in
PROREIT’s Management’s Discussion and Analysis for the quarter ended June 30, 2021 available on SEDAR at www.sedar.com.

Forward-Looking Information
Certain statements contained in this presentation constitute forward-looking information within the meaning of applicable securities laws. In some cases, forward-looking information can be
identified by such terms such as “may”, “might”, “will”, “could”, “should”, “would”, “occur”, “expect”, “plan”, “anticipate”, “believe”, “intend”, “estimate”, “predict”, “potential”, “continue”, “likely”,
“schedule”, or the negative thereof or other similar expressions concerning matters that are not historical facts. Some of the specific forward-looking statements in this presentation include,
but are not limited to, statements with respect to PROREIT’s future financial performance; the ability of PROREIT to execute its growth strategies; and PROREIT’s ability to continue paying
monthly distributions and PROREIT’s ability to raise capital. Forward-looking statements are based on a number of assumptions and are subject to a number of risks and uncertainties,
many of which are beyond PROREIT’s control, that could cause actual results and events to differ materially from those that are disclosed in or implied by such forward-looking statements.
PROREIT’s objectives and forward-looking statements are based on certain assumptions, including that (i) PROREIT will receive financing on favourable terms; (ii) the future level of
indebtedness of PROREIT and its future growth potential will remain consistent with PROREIT’s current expectations; (iii) there will be no changes to tax laws adversely affecting
PROREIT’s financing capacity or operations; (iv) the impact of the current economic climate and the current global financial conditions on PROREIT’s operations, including its financing
capacity and asset value, will remain consistent with PROREIT’s current expectations; (v) the performance of PROREIT’s investments in Canada will proceed on a basis consistent with
PROREIT’s current expectations; and (vi) capital markets will provide PROREIT with readily available access to equity and/or debt. Additional information about these assumptions and risks
and uncertainties is contained under “Risk Factors” in PROREIT’s latest annual information form, and in other filings that PROREIT has made and may make with applicable securities
authorities in the future, all of which are or will be available on SEDAR at www.sedar.com.

The forward-looking statements contained in this presentation are expressly qualified in their entirety by this cautionary statement. Investors are cautioned not to put undue reliance on
forward-looking statements. All forward-looking statements in this presentation are made as of the date of this presentation. PROREIT does not undertake to update any such
forward-looking information whether as a result of new information, future events or otherwise, except as required by law.

Additional Information
Information appearing in this presentation is a select summary of PROREIT’s business, operations and results. The latest annual information form of PROREIT and its consolidated financial
statements and management’s discussion and analysis thereon for the quarter ended June 30, 2021 are available on SEDAR at www.sedar.com.

                                                                                                                                                                  INVESTOR
                                                                                                                                                              PRESENTATION
2                                                                                                                                                                        August 2021
BUILDING A
    MID-CAP DIVERSIFIED
    COMMERCIAL REIT
    IN CANADA

                              INVESTOR
                          PRESENTATION
3                              August 2021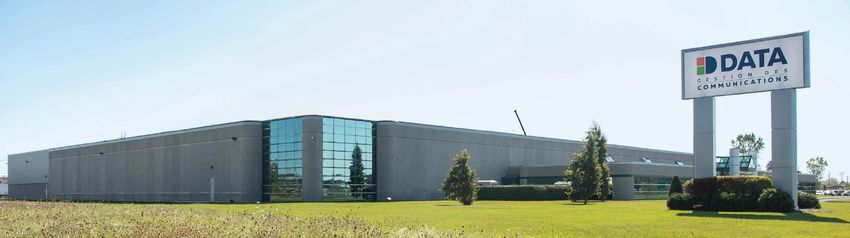
Section 1. PROREIT AT A GLANCE
    Section 2. NEXT STAGE OF GROWTH
    Section 3. 2021 SECOND QUARTER PERFORMANCE
    Section 4. FOCUSED ON STRATEGIC PRIORITIES
    Section 5. APPENDICES

                                                     INVESTOR
                                                 PRESENTATION
4                                                     August 2021
SECTION 1.
    PROREIT AT A GLANCE

                              INVESTOR
                          PRESENTATION
5                              August 2021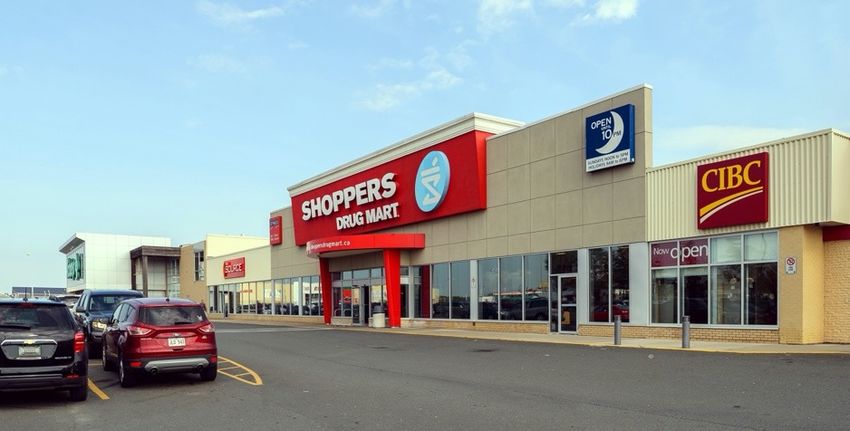
About PROREIT

Established in 2013, PROREIT owns $773 million of diversified          Quick Facts
commercial real estate properties in Canada, representing              (As at August 11, 2021)

5.5 million square feet of gross leasable area. PROREIT is mainly      Ticker Symbol (TSX)
focused on strong secondary markets in Québec, Atlantic Canada         PRV.UN
and Ontario, with selective exposure in Western Canada.
                                                                       Tax Deferred
                                                                       Distribution
                                                                       100% (estimated)
                                                                       DRIP Eligible

107
PROPERTIES
                                                                       3% bonus units (suspended)
                                                                       Monthly Distributions
                                                                       $0.45 on an annualized basis
IN 10 PROVINCES
                                                                       Revenue by Asset Class
                                                                       (3 months ended June 30, 2021)

                                                               NF: 1
                                                                              Retail 29.4%
    BC: 5
            AB: 11           MB: 15
                                                         PEI: 1               Industrial 53.7%
                     SK: 4
                                      ON: 15   QC: 14                         Office 16.9%
                                                    NB: 25   NS: 16

                                                                                            INVESTOR
                                                                                        PRESENTATION
6                                                                                                August 2021
Our Vision

Become a mid-cap diversified Canadian REIT with
high-quality commercial real estate
in specific segments of the industrial, retail and office sectors,
recognized for its ability to:

Produce                                      Grow
stable and growing                           unitholder value
returns                                      per unit

                 With a Clear Strategy to Grow FFO and NAV

                                                                  INVESTOR
                                                              PRESENTATION
7                                                                    August 2021
Strong Performance in COVID-19 Environment

    99.9%
    of overall gross rent collected in 2021

    TOP PERFORMING
    amongst our peer group

    79%                       67%
    of tenant base            of retail base rent comes
    are national and          from grocery stores,
    government                pharmacies, financial
    tenants                   institutions, government
                              and medical offices

                                                              INVESTOR
                                                          PRESENTATION
8                                                              August 2021
Our Growth History

                                                                                                         A BREAKOUT                                    NEXT STAGE OF
PROREIT CREATION                                                                                         YEAR                                          GROWTH
                                                                                                         ► Internalization     ► 91 properties,        ► 107 properties,
BY FORMER CANMARC
                                                                                      ► Achieved           of asset              4.5M sq. ft. GLA            5.5M sq. ft. GLA
MANAGEMENT                                                                              $500M              management          ► Acquisition           ► Acquisition of
► One $6M property,                                                                     asset target                             of light industrial
                                                                                                         ► Graduation                                        18 industrial properties
    397K sq. ft. GLA               ► 32 properties,                  ► 66 properties, ► 84 properties,                           property in
                                                                                                           to TSX                                            for $134M
► TSX-V listing                      1.7M sq. ft.                      2.7M sq. ft.     3.7M sq. ft.      ► Consolidation        Moncton, NB,
                                                                                                                                                       ► Sale of 2 non-strategic
    (PRV.UN)                         GLA                               GLA              GLA                  of Units 3:1        for $8.4M
                                                                                                                                                             assets for $12.9M

         2013           2014             2015             2016             2017              2018               2019                  2020                      2021

                  ► 23 properties,                  ► 39 properties,                  ► $69.1M in        ► 92 properties,      ► Sale of retail        ► $50 million private
                    1.0M sq. ft.                      2.0M sq. ft.                      new equity         4.4M sq. ft.           property in                placement closed in
                    GLA                               GLA                               capital raised     GLA                    Saint John, NB             April 2021
                                                                                                          ► Acquisitions          for $5.1M & non-
                                                                                      ► Acquisition                                                    ► $71.4M in new
                                                                                                             of 7 properties      strategic office
                                                                                        of property          for $97.8M
                                                                                                                                                         mortgage financing
                                                                                        management                                building in            ahead of 2021-2022
                                                                                                         ► $57.6M equity          Montreal, QC for       maturities
                                                                                        platform
                                                                                                           offering               $5.0M
PROREIT has consistently paid                                                                                                                          ► Eliminated expensive
                                                                                                                                                         alternative lender from
attractive distributions every month                                                                                                                     debt stack
since January 2014
                                                                                                                                         INVESTOR
                                                                                                                                     PRESENTATION
9                                                                                                                                              August 2021
SECTION 2.
     NEXT STAGE OF GROWTH

                                INVESTOR
                            PRESENTATION
10                               August 2021
Returning to Market in Growth Mode in 2021
► Accretive acquisition of ► $50 million private placement with
18 institutional-caliber industrial the Bragg Group, a prominent
assets for $133.7 million Canadian private investor closed
(approx. 6% cap rate) closed in April 2021
in Q2-2021
► $52 million in mortgage
refinancing at lower rates
► Sale of 2 non-strategic retail and extended terms, including
assets for $12.9M $24.8 million 7-year mortgage
commitment for 6 retail properties
in May 2021
► Over $20 million in operating
liquidity at June 30, 2021
INVESTOR
PRESENTATION
11 August 2021A Strong and Well Diversified Portfolio
107 $773M 5.5M
PROPERTIES TOTAL ASSETS GROSS LEASABLE AREA
(SQUARE FEET)
► Increased exposure to strong industrial sector
► Greater scale in attractive mid-market cities
Base Rent by Asset Class (%) Base Rent by Region (%)
Retail Office Maritime Provinces Quebec
Industrial Ontario Western Canada
14.8 13.2 15.0 17.0
14.9
36.3 30.4
13.7 42.6 11.7 40.5
49.1 56.4 28.6 30.8
48.9
Q1-2021(1) Q2-2021(2) Q1-2021(1) Q2-2021(2)
(1) Based on in-place and committed base rent as of March 31, 2021
(2) Based on in-place and committed base rent as of June 30, 2021
INVESTOR
PRESENTATION
12 August 2021High Quality, Low Risk Portfolio
80%
OF SQUARE FEET
MATURING
Operational Highlights IN 2021 RENEWED TO
DATE
As at June 30, 2021 AT 4% POSITIVE
Number of AVERAGE SPREADS
Asset Class Properties Occupancy (%)(1) GLA (sq. ft.)
Retail 47 97.0 1,036,598
Office
Industrial 51
9 92.5
99.7
468,452
4,005,657
17%
OF SQUARE FEET
Total 107 98.5 5,510,707 MATURING
(1) Based on in-place and committed base rent as of June 30, 2021
IN 2022 RENEWED TO
DATE
AT 3% POSITIVE
AVERAGE SPREADS
INVESTOR
PRESENTATION
13 August 2021Experienced Management Team with
Deep Industry Knowledge
► 70+ years of collective asset
management and property
management experience
► Former CANMARC REIT team
► Sold to Cominar in 2012
James W. Gordon Lawlor,
for $1.9B (43% annual ROI Beckerleg CPA, CA
since IPO) Chief Executive Officer
and Trustee
Executive Vice President,
Chief Financial Officer
and Secretary
► Extensive network of real estate
and capital markets relationships
► Alignment with unitholders:
officers and trustees own or control
4.1% of outstanding units
Mark O'Brien Alison Schafer, Chris Andrea
► Competitive, objectives-based asset Managing Director,
Operations
CPA, CA
Director of Finance
President
Compass Commercial
management structure Realty
INVESTOR
PRESENTATION
14 August 2021SECTION 3.
2021 SECOND QUARTER
PERFORMANCE
INVESTOR
PRESENTATION
15 August 20212021 Second Quarter Financial Results
CAD $ thousands except for unit amounts Three months ended Three months ended
Change YoY%
unless otherwise stated June 30, 2021 June 30, 2020
Total assets $772,881 $646,321 19.6%
Property revenue $17,764 $17,212 3.2%
NOI(1) $10,731 $9,773 9.8%
Same property NOI(1) $9,879 $9,305 6.2%
Debt to Gross Book Value(1) 58.22% 58.71% (0.8)%
Interest Coverage Ratio(1) 2.8x 2.8x –
Net cash flows provided from
$7,994 $900 788.2%
operating activities
FFO(1) $4,782 $4,835 (1.1)%
AFFO(1) $5,741 $5,217 10.0%
AFFO Payout Ratio (Basic)(1) 92.3% 86.3% 7.0%
(1) Non-IFRS measure. See “Disclaimer – Non-IFRS Measures”.
INVESTOR
PRESENTATION
16 August 20212021 Half-Year Financial Results
CAD $ thousands except for unit amounts Six months ended Six months ended
Change YoY %
unless otherwise stated June 30, 2021 June 30, 2020
Total assets $772,881 $646,321 19.6%
Property revenue $35,154 $34,919 0.7%
NOI(1) $20,824 $20,128 3.5%
Same property NOI(1) $19,559 $19,061 2.6%
Debt to Gross Book Value(1) 58.22% 58.71% (0.8)%
Interest Coverage Ratio(1) 2.7x 2.9x (6.9)%
Net cash flows provided from
$8,201 $4,200 95.3%
operating activities
FFO(1) $8,660 $10,591 (18.2)%
AFFO(1) $11,163 $11,206 (0.4)%
AFFO Payout Ratio (Basic)(1) 87.9% 96.3% (8.7)%
(1) Non-IFRS measure. See “Disclaimer – Non-IFRS Measures”.
INVESTOR
PRESENTATION
17 August 2021Top Ten Tenants
# Tenant
% of In-Place
GLA (sq. ft.)
WALT (2)
Credit Rating (3)
Highlights
Base Rent (1) (years)
5.3% 104,929 Baa2/BBB+/na
1 8.1 79%
2 5.0% 222,491 6.1 na/BBB-/BBB- of base rent is
from national and
3 4.7% 127,334 3.6 Ba1/BB+/BBB- government tenants
4 3.4% 100,260 3.3 Aaa/AAA/AA+
Top ten tenants
5 3.2% 326,061 5.2 BBB/BBB/BBB- account for
3.0% 66,063 na/BBB/BBB
33.7%
6 4.1
of base rent
7 2.9% 98,057 8.5 na
Credit quality
8 2.9% 224,334 8.2 na tenants account
9 1.8% 185,633 8.0 Ba1/BBB-/BB+ for 45.1% of
in-place base rent
10 1.5% 176,070 3.9 Baa3/BBB-/na
TOP TEN SUBTOTAL 33.7 1,631,252 5.9
OTHER TENANTS 66.3 3,717,325 4.3
VACANT 162,130
TOTAL 100.00 5,510,707 4.8
(1) Based on annualized in-place and committed base rent at June 30, 2021
(2) WALT: weighted average lease term
(3) Source: Moody’s, S&P, and DBRS. Credit rating assigned to tenant or its parent. INVESTOR
PRESENTATION
18 August 2021High Quality Tenant Profile
► Overall weighted occupancy rate of 98.5% with a weighted average
remaining lease term of 4.8 years
► Top ten tenants have a weighted average remaining lease term of 5.9 years
► Staggered lease maturity profile
► Not more than 16.5% of base rent matures in any given lease year 49.4%
GLA
49.4%
BASE RENT
16.0%
10.7% 9.5%
9.0%
5.5%
16.5%
12.2% 7.6% 11.0%
3.6%
2021 2022 2023 2024 2025 2026-2036
INVESTOR
PRESENTATION
19 August 2021Sound and Flexible Capital Structure
Currently over $20 million of operating liquidity
Debt Maturity Profile
As of June 30, 2021
Debt to Gross Book Value(1) 58.22% Debt Maturing During Year
Payments of Principal
Total debt $451.1M
200
$187.1
Total debt weighted average rate 3.50% 180
160
Total first mortgage debt
5.4 years
weighted average term 140
120
100
$88.7
Debt Composition ($ millions) (2)
80 $73.2
Operating facilities, term loans $39.6 60
$48.8
40 $36.0
First mortgages $411.5 $17.3
20
Total $451.1 0
1 year 1-2 years 2-3 years 3-4 years 4-5 years later
(1) Non-IFRS measure. See “Disclaimer – Non-IFRS Measures”. (2) Includes line of credit of $23M
INVESTOR
PRESENTATION
20 August 2021SECTION 4.
FOCUSED ON STRATEGIC
PRIORITIES
INVESTOR
PRESENTATION
21 August 2021Strategies for Driving Growth and Creating Value
External Growth Internal Growth Strong Balance Sheet
► Acquire accretive income- ► Nurture existing client ► Low cost of debt
producing commercial relationship, ensuring tenant
properties in strong retention and growth ► Staggered mortgage
secondary markets and lease maturity profile
► Implement operating
► Focus on Class B, improvements and ► Targeted Debt to
high-quality commercial real preventative maintenance Gross Book Value ratio
estate programs ► Access to multiple sources
► Seek properties with ► Pursue expansion and of capital
selective development, redevelopment opportunities ► Prudent capital management
expansion opportunities and within the portfolio
geographical diversification
► Exploit lease-up
► Pursue off-market opportunities
opportunities allowing
access to unique pipeline
INVESTOR
PRESENTATION
22 August 2021What Differentiates Us
Our ability to identify and build
a stable, low risk portfolio
in areas where larger REITS and others continue to recycle assets
Strong secondary Selection of high quality Targeting specific segments
markets Class B assets within three sectors
► Urban markets and regional ► Strong upside as ► Retail, with emphasis on
economic centres outside market is transforming community service centres
central Vancouver, Toronto
and Montreal ► Our size permits and ► Industrial, with emphasis on
requires us to be small and midbay properties
► Often higher capitalization opportunistic
rates ► Office, with emphasis on
suburban and mixed use
► Focus on central and buildings
eastern Canada
INVESTOR
PRESENTATION
23 August 2021Focused on Community-Based Service Centres
► Typically brand grocery or pharmacy anchored
► Brand names
► Long-term leases
► Excellent covenants
► Banks, medical professionals, government services and restaurants
► Upside potential from rent increases, vacancy fill-up and pad development is available
INVESTOR
PRESENTATION
24 August 2021Focused on Light Industrial Buildings
► Single or multi-tenant, light industrial buildings (typically 22 feet clearance or higher)
► Located on major transportation routes with strategic access to:
► Airports
► Large cities
► Border crossings
► Currently focused on 50,000 sq. ft. to 200,000 sq. ft. buildings where
increased occupancy and increased annual revenues are available
INVESTOR
PRESENTATION
25 August 2021Focused on Industrial/Flex Office
► Buildings are often in industrial parks
► Flex office with loading docks
► Retail in industrial buildings (e.g. - decor, wholesale)
► Light industrial with office space
► Currently, the right buildings in the right sectors are seeing increasing demand
from a growing economy
INVESTOR
PRESENTATION
26 August 2021Why Invest in PROREIT
► Attractive yield of monthly ► Increased scale and growing profile
distributions to achieve additional synergies
► Solid track record of growth ► Acquisition focused when
and unitholder value creation opportunities arise
► Diversified portfolio and
► Opportunistic and well-positioned
high quality, low risk tenants
to benefit from current real estate
with long-term leases
market transformation
► Experienced management team
and solid relationships in the ► Clear strategy to grow earnings
investment banking and lending and net asset value
businesses
► Favourable Canadian real estate
market
INVESTOR
PRESENTATION
27 August 2021SECTION 5.
APPENDICES
INVESTOR
PRESENTATION
28 August 2021A Solid Track Record – Seven Years of Growth
Total Assets Gross Leasable Area Property Revenues
($ Millions) (‘000 sq. ft.) ($ Millions)
700 5,000 69.810
634.7 634.5 70
4,445 4,547
600 60 57.627
CAGR(1) 509.7 4,000 CAGR(1) 3,703 CAGR (1)
500
37% 42% 50 71%
365.9 3,000 2,690 40.889
400 40
2,005 29.639
300 258.0
2,000 30
1,670 22.963
203.2
18.190
200 141.5 1,044 20
1,000 9.189
100 70.2 397 10
1.628
0 (2)
0 (2)
0 (2)
2013 2014 2015 2016 2017 2018 2019 2020 2013 2014 2015 2016 2017 2018 2019 2020 2013 2014 2015 2016 2017 2018 2019 2020
Net Cash Flows Provided
Net Operating Income(3) from Operating Activities Adjusted Funds from Operations (3)
($ Millions) ($ Millions) ($ Millions)
50 25 23.410 40
40.529
40 35.481
20
17.435 30
CAGR (1) CAGR (1)
30 67% 26.049 15 49% 14.100 CAGR (1) 20.422
22.436
20 49%
20 18.266 10 9.053 14.340
14.105
11.207 10.325
4.465 10 7.619
10 5.758 5 3.568 6.258
1.404 2.944
1.126 0.155 1.410
0 0 0
(2)
2013 2014 2015 2016 2017 2018 2019 2020 2013 (2)2014 2015 2016 2017 2018 2019 2020 2013 (2)
2014 2015 2016 2017 2018 2019 2020
(1) CAGR: compound annual growth rate
(2) 2013 was for 13 months ended
(3) Non-IFRS measure. See “Disclaimer – Non-IFRS Measures”. INVESTOR
PRESENTATION
29 August 20212020 Property Transactions
Purchase Price Number of Added GLA Occupancy Rate
Transaction ($millions) Properties (sq. ft.) at Acquisition
Acquisition
Light industrial property, Moncton, NB $8.4 1 135,494 100%
Dispositions
Free standing retail property, Saint John, NB $(5.1) (1) (9,647) –
Free standing office property, Pointe-Claire, QC $(5.0) (1) (20,343) –
Net transactions $(1.7) (1) 105,504
INVESTOR
PRESENTATION
30 August 2021We’ve Done It Before
100%
S&P/TSX Capped REIT Index
CANMARC REIT
75%
50%
25%
0%
Ma y-2010 Jul-2010 Sep-2010 Nov-2010 Jan-2011 Ma r-20 11 Ma y-2011 Jul-2011 Sep-2011 Nov-2011 Jan-2012
► The Former CANMARC REIT
► Diversified REIT with national portfolio
► 143 properties
► Acquired by Cominar in 2012 for $1.9 billion
► 43% compound annual rate of return since IPO, compared to 28% for the REIT index
INVESTOR
PRESENTATION
31 August 2021Scale Brings Transformational Growth Opportunities
Internalization of Property Increased
and Asset Management Scale
(2018-2019)
► Increases access to larger and higher
► Increases cash flow and adds value quality acquisitions
► Creates significant economies ► Decreases risk with greater
of scale diversification and reduced dependency
on top tenants
► Provides additional transparency
in accounting and financial ► Increases potential for internal growth:
reporting rent increases, densification, etc.
LEVERAGE TO IMPROVE COST OF CAPITAL
AND INCREASED GROWTH PER UNIT
INVESTOR
PRESENTATION
32 August 2021Compass Commercial Realty Acquisition
HIGHLY STRATEGIC ACQUISITION COMPLETED IN 2018
► Operates autonomously from Halifax headquarters
► Over $1 billion in asset value, 6.7 million square feet under management
► Manages 65 third-party properties
► Manages 101 PROREIT properties
► Offices in Halifax, Moncton, Montreal and Oakville
► Significant room for expansion
INVESTOR
PRESENTATION
33 August 2021THANK YOU!
INVESTOR
PRESENTATION
34 August 2021You can also read