Investor Presentation - February 25, 2022 - Seeking Alpha
←
→
Page content transcription
If your browser does not render page correctly, please read the page content below
Investor Presentation

   February 25, 2022

                        1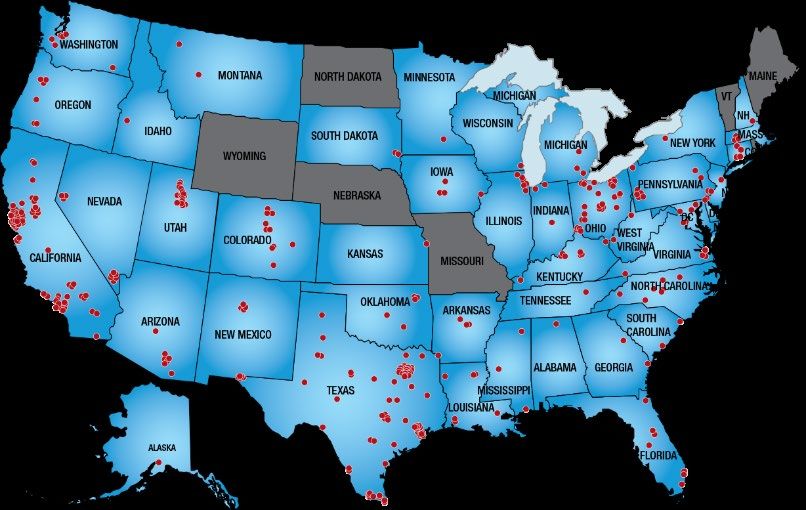
Forward Looking Statements
CAUTIONARY NOTE REGARDING FORWARD LOOKING STATEMENTS PURSUANT TO THE U.S. PRIVATE SECURITIES
LITIGATION REFORM ACT OF 1995:
This presentation contains, and our officers and representatives may from time to time make, “forward–looking statements” within the meaning of the safe
harbor provisions of the U.S. Private Securities Litigation Reform Act of 1995. The “forward looking statements” can be identified by words such as “may,”
“should,” “could,” “estimates,” “predicts,” “potential,” “continue,” “anticipates,” “believes,” “plans,” “expects,” “future” and “intends” and similar
references to future periods. Examples of forward-looking statements include, among others, statements we make regarding our future revenues, expenses
and profitability, the future development and expected growth of our business, attendance at movies generally or in any of the markets in which we operate,
the number or diversity of popular movies released and our ability to successfully license and exhibit popular films, national and international growth in our
industry, competition from other exhibitors, and alternative forms of entertainment.

Forward-looking statements are neither historical facts nor assurances of future performance. Instead, they are based only on our current beliefs,
expectations, and assumptions regarding the future of our business, future plans, and strategies, projections, anticipated events and trends, the economy and
other future conditions. Because forward-looking statements relate to the future, they are subject to inherent uncertainties, risk, and changes in
circumstances that are difficult to predict and many of which are outside our control. Our actual results and financial condition may differ materially from
those indicated in the forward-looking statements. Therefore, you should not rely on any of these forward-looking statements. Important factors that could
cause our actual results and financial condition to differ materially from those indicated in the forward-looking statements include, among others, the impacts
of the COVID-19 pandemic on our business and the entertainment industry and all of the other risk factors discussed in the “Risk Factors” section or other
sections in the Company’s Annual Report on Form 10-K filed February 25, 2022.

All forward-looking statements are expressly qualified in their entirety by these cautionary statements and such risk factors. We undertake no obligation,
other than as required by law, to update or revise any forward-looking statements, whether as a result of new information, future events or otherwise.

Except as otherwise specified or indicated by the context references in this presentation to “we,” “us,” “our,” “Cinemark” or the “Company” are to the
combined business of Cinemark Holdings, Inc. and its consolidated subsidiaries.

NON-GAAP FINANCIAL MEASURES:
We include certain non-GAAP financial measures in this presentation, including Free Cash Flow, Adjusted EBITDA and other financial measures utilizing
Adjusted EBITDA. These non-GAAP financial measures may not be comparable to those of other companies, and may not be comparable to similar
measures used in our various filings. Please see the Appendix for definitions of our non-GAAP financial measures and a reconciliation of each non-GAAP
financial measure to the most directly comparable financial measure stated in accordance with GAAP.

                                                                                                                                                              2
Cinemark Overview

                    3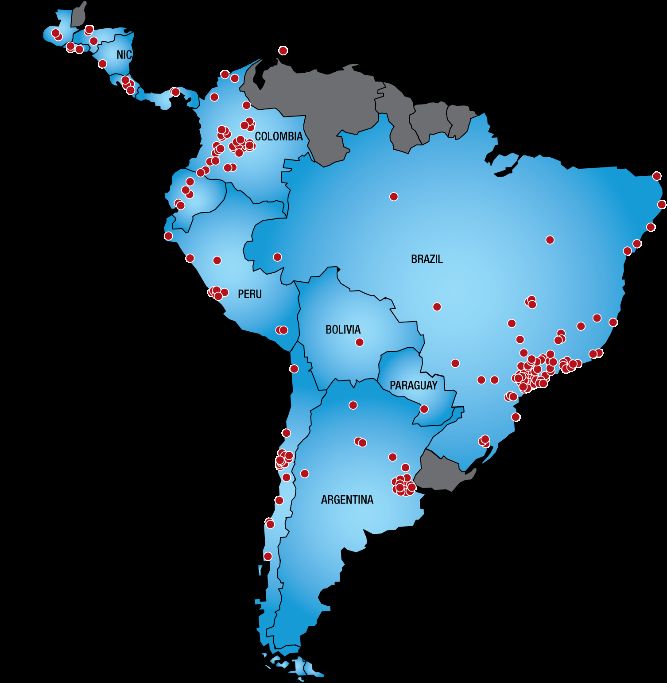
Cinemark Overview
                                                                       321 Theatres 4,408 Screens(1)

 • One of the largest and most influential movie theatre
   companies in the world
      – 522 theatres with 5,868 screens in 16 countries (1)

 • U.S. Operations (1)
      – Third largest exhibitor
      – 42 states, 104 DMAs
      – #1 or #2 in box office revenues in 80% of our top 25
        markets
      – Highest attendance per screen among leading exhibitors
      – Surpassed North American industry box office growth for        201 Theatres 1,460 Screens(1)
        12 out of the past 13 years
      – U.S. operations serviced the debt, domestic growth
        opportunities and historically the dividend

 • International Operations (1)
      –   First modern theatre experience throughout Latin America
      –   More than 27 years of operating experience
      –   15 countries
      –   Approximately 30% market share in key countries
      –   Presence in 15 of top 20 metropolitan cities in the region

 1)    As of 12/31/2021
                                                                                                       4
Highly Experienced Management Team

         Lee Roy Mitchell                                                   Sean Gamble
         Founder & Executive Chairman                                       President & CEO
         Founded Cinemark in 1987, served as CEO                            15+ years of industry experience. Joined as
         through 2006 and has served as Executive                           Cinemark’s CFO in 2014 after spending 5+
         Chairman since 1996                                                years as CFO/Executive Vice President of
                                                                            Universal Pictures within NBCUniversal

         Valmir Fernandes                                                 Mike Cavalier
         President, International                                         EVP General Counsel
         20+ years of Cinemark experience includes                        Served as General Counsel since 1997. Helped
         the past 10+ years as President of                               guide company through various transactions
         International following 10 years as the                          including M&A, IPO and numerous lending
         General Manager of Cinemark Brazil                               agreements

                                        Melissa Thomas
                                        CFO
                                        Joined as Cinemark’s CFO in 2021. Prior to
                                        Cinemark, served multiple leadership roles with
                                        Groupon, including CFO, CAO & Treasurer, and VP
                                        Commercial Finance.

             Additional key leaders with 20+ years of industry/Cinemark
                      experience in the US and internationally

                                                                                                                          5
Exhibition Industry Trends
Stable, long-term industry growth trends across technology innovations and economic cycles

                                                       North America Box Office Trends
                                                                                                                                                                   Recliners and
                                                                                                                                                                  enhanced food
                                                                                                    DVD player                Digital projector conversion        Investments ...
                                                                                                   drops to$100
                                                                                                   (DVD heyday)                             Mass OTT streaming adoption ...
         Recession year                                                                                                     Financial
                                                                                                                              crisis
                                                                                              Exhibition
                                                                                            bankruptcies/
                                                                                            consolidation
                                                                    Megaplex and
                                                                   stadium seating

                                                                                                                                                                            $11.4B
                                                          Internet begins
                                                         to go mainstream

           VHS begins
             to ramp
          post beta-max

                                                                                            1.57B patrons

                                                                                                                   1.38B patrons
                                                                                                                                                   1.3B patrons
 $2.8B

                                 1.1B patrons
 1980

                          1985

                                                1990

                                                            1995

                                                                                     2000

                                                                                                            2005

                                                                                                                                   2010

                                                                                                                                                         2015

                                                                                                                                                                                     2020
              VCR                                             Internet                           DVD                                            Streaming

                                                                                                                                                                                            6
 Sources: North America: ComScore; NATO.
Pre-COVID
Summary & Financials

                       7
Broad and Leading Presence in the Americas
Strong presence across the U.S. and Latin America that is strategically important to film
distributors as well as promotional partners

  2019 Market Share - North America1                                            2019 Market Share - Key Latin American Markets1

                                                                                                                      Cinemark
                                                                                                             27%      Cinepolis
                                                                                              37%
                                                                                                                      Kinoplex
                                                             AMC                    Brazil
                                                                                                                      Araujo
                                                       23%                                                   15%
                                                                                                                      UCI
                                                                                                    6% 10%
Others                                                                                        5%                      Others
          36%

                                                                                                                      Cinemark
                                                                                                   20%
                                                                                                                      Cinepolis
                                                                                                                37%
                                                                                                                      NAI
                                                                                  Argentina   7%
                                                              17%                             8%                      Lumiere
                                                                      Regal                                           Cinemacenter
                                                                                                   13%    15%
           2%                                                                                                         Others
    Harkins 3%
       Marcus     6%                    13%
           Cineplex                                                                                  4%
                                            Cinemark                                           16%                    Cinepolis
                                                                                                                45%   Cinemark
                                                                                    Chile                             Cineplanet
                                                                                               35%                    Others

 1) Based on FY 2019 box office; see slide 15 for current market share trends                                                        8
Initiatives to Drive Growth and Outperformance
Cinemark’s strategic initiatives drove growth and consistent outperformance leading into the crisis.
While the initiatives are currently being reprioritized, we expect these to be a focus over the long-term.

   1    Create an extraordinary in-
        theatre guest experience

        Deepen and extend the overall
   2    guest engagement

        Actively pursue organic and
   3    synergistic growth opportunities

         Invested in strategic initiatives while maintaining the strength and flexibility of our balance sheet.
                      Going forward, re-fortifying the balance sheet will be our primary focus.

                                                                                                                  9
Consistent Industry Outperformance
Cinemark has surpassed North American industry box office growth 12 out of the past 13 years and has
                                               3
consistently led the industry in profitability
   2014 - 2019 Admission Revenue Growth 1                                                                 CNK WW Adjusted EBITDA Growth 1, 2

                                                                                                                                           +6%
                                                               22.9%                                                                      CAGR            $745

                                      17.3%                                                                                $551

               10.1%

        North America               Cinemark               Cinemark                                                      2014                              2019
          Industry                     U.S.                Worldwide                                                   Constant $
                                                           Constant $
 Source: MPA and Public Filings.
 1) As of December 31, 2019. 10% WW growth in USD as reported. Constant currency is a non-GAAP measurement calculated using the average exchange rates for the
     corresponding months for 2019. We translate results of our international operating segment from local currencies into U.S. dollars using currency rates for respective reporting
     periods. Significant changes in foreign exchange rates from one period to the next can result in meaningful variations in reported results. We provide constant currency
     amounts to compare performance without the impact of foreign currency fluctuations. See schedule of non-GAAP measures and financial metrics at investors.Cinemark.com
 2) Adjusted EBITDA has been presented including all cash distributions from equity investees for all years presented. See Appendix for reconciliation of Adjusted EBITDA to the
10 most directly comparable GAAP measures.                                                                                                                                              10
 3) As of 12/31/2021
2019 Financial Summary
2019 Worldwide Results Highlights
Amounts in millions
• Served ~280 million patrons globally
• Achieved 5th consecutive year of record revenue with top-
5-Year line growth in U.S. and International2 segments
2019 CAGR • Exceeded North America industry box office growth by
Attendance 280 1.2% 200 bps, outperforming in 10 of the past 11 years
• Grew global concession per caps 8.7% in constant $,
Revenue $3,283 4.6% extending growth trend to 13 consecutive years
Adj. EBITDA (1) $745 3.9% • Generated over 20% free cash flow growth vs. 2018
Adj. EBITDA % (1) 22.7% • Maintained balance sheet strength with almost $0.5B in
cash and ~2x net leverage, consistent with results for past
10 years
Free Cash Flow (1) $258 4.2%
• Strengthened circuit and customer experience by
End Cash Balance $488 reclining another 200 screens, representing 60% of U.S.
Net Leverage 2x circuit at year-end
• Expanded highly successful Movie Club subscription
program to 950K members
1) See Appendix for reconciliation of Adjusted EBITDA and Free Cash Flow to the most directly comparable GAAP measures 11
2) Intl segment growth in constant $Pandemic Recovery
Update and
Financial Results
12Pandemic Recovery Status
Positive momentum regarding the rebound of theatrical exhibition; Cinemark is well-positioned to
reignite theatrical moviegoing, drive share, and boost loyalty
Recovery Update
• 100% of domestic and international theaters fully operational
Recovery Considerations throughout 4Q21, albeit with gov’t mandated capacity and
operating hours restrictions in LatAm
• Closely monitoring infection and vaccination rates globally and
highly encouraged with progress
Current status of the virus and • Growing number of health experts expecting to transition from a
1
vaccinations pandemic to an endemic, signaling a significant reduction in day-
to-day disruptions
Evolving restrictions imposed by
2 • Consumer sentiment in returning to theatres has nearly returned
governmental authorities
to its pre-Delta variant peak in July with 75% of moviegoers
comfortable returning to the theatre today – and 80% next month
Consumer confidence and
3 • Theatrical exhibition industry made huge strides in its recovery
willingness to return to theatres
throughout 2021 that culminated in an exceptional 4Q21 with the
North American industry box office crossing the $2B for the first
4 Availability of new film content time since the onset of the pandemic
• Industry recovery continues to ramp and accelerate throughout
the course of 2022, which is loaded with highly anticipated
franchises and a wide array of diverse film content to appeal to
broad audiences
• Most larger, commercial films with an exclusive theatrical release
maintaining a 45-day window
13Operational and Promotional Advancements
Have enacted, and are continuing to pursue, varied productivity and efficiency initiatives while focusing
on efforts to maximize attendance and box office and drive new ancillary revenue opportunities.
Optimizing operating hours and showtime schedules through utilization of
enhanced data management analytics
Simplifying and streamlining numerous theatre practices, such as ticket issuance,
inventory procedures and ushering routines, to be leaner and more efficient
Refining the degree of staffing required to operate theatres, including enhanced
planning and management controls
Continuing to drive company-wide Continuous Improvement and margin
expansion projects
Prioritizing food and beverage offerings that are less labor intensive and
continuing to ramp up offerings as attendance warrants; simplifying and
enhancing the guest experience through the online F&B ordering platform
Significantly advance digital and social marketing capabilities to increase
moviegoing frequency and overall consumer spend
Heightened focus on gaming initiatives and alternative content to further utilize
auditoriums to supplement Hollywood film content
14Highlights of 4Q21 Results
We continue to make significant progress in recovering from the effects of the pandemic and are
extremely well-positioned to benefit during the ongoing resurgence of theatrical moviegoing
• Domestic box office over-indexed the N. American industry results by ~700 bps
Box • Int’l admissions surpassed respective LatAm industry benchmarks by ~700 bps
Office • Worldwide attendance increased 57% since last quarter (3Q21), tangibly
underscoring moviegoer demand and driving the company’s resurgence
Food & • U.S. concessions revenues reached 90% of 4Q19 levels
Beverage • Generated another all-time high food & beverage per cap of $6.66
• U.S. occupancy continued its upward trajectory during 4Q21 at 19%+ relative to
Occupancy
13% in 3Q21 and 25 – 30% averages historically
• After pausing memberships at the onset of the pandemic, the program is now fully
Movie Club reactivated and our membership base is 940K - within 1% of its pre-pandemic level
• 100K+ members earned the new premium tier Movie Club Platinum status
Premium • Consumers continue to select premium large formats with 15% of U.S. box office
Large Formats generated from premium large formats – an increase of 400 bps since 4Q19
• Generated positive WW Adj. EBITDA (+$139MM) in 4Q21 for the first time since the
Profitability onset of COVID with an Adj. EBITDA margin of 20.9%
• Delivered positive cash flow from operations of $208MM in 4Q21 and expect to
generate positive cash flow from operations for the full-year 2022
15
1) See Appendix for reconciliation of Adjusted EBITDA and Free Cash Flow to the most directly comparable GAAP measuresFull Year 2021 Financial Summary
Amounts in millions
Full Year 2021 Worldwide Results Highlights
• Delivered positive Free Cash Flow of $71MM and Adj. EBITDA of
FY FY $80MM for the full-year driven by the strength of the fourth
quarter results
2021 2019
• The industry ramp up continues to progress, and we are highly
Attendance 106 280 encouraged with increasing consumer demand for the cinematic
experience
Revenue $1,510 $3,283
• Given the wider array of commercial film content available, 4Q21
Adj. EBITDA (1) $80 $745 results continued the recovery momentum with growth in key
metrics relative to the prior quarter
Adj. EBITDA % (1) 5.3 22.7%
• All significant debt maturities extend through March 2025 and
Free Cash Flow (1) $71 $258 beyond; revolver maturity November 2024
End Cash Balance $707 $488 • Though we have ample liquidity, multiple financing opportunities
remain available, including:
Net Leverage - 2x • $100MM revolving credit line
• incremental term loan borrowing capacity within credit
facility
• sale-leaseback arrangements on unencumbered properties
• issuance of equity
1) See Appendix reconciliation of Adjusted EBITDA and Free Cash Flow to the most directly comparable GAAP measures. 16A Look Ahead
172022 Notable Film Titles
Quarter 1 Quarter 2 Quarter 3 Quarter 4
July 1 November 4
May 6 Universal Warner Bros.
January 14 Disney
Paramount
November 11
July 8
May 20 Disney
Disney
February 4 Warner Bros.
Paramount
February 18
May 27 July 15 December 16
Sony
Paramount Sony Disney
March 4 December 16
June 10 July 22 Warner Bros.
Warner Bros. Universal
Universal
March 25 June 17 July 29 December 23
Paramount Disney Warner Bros. Universal 182022 Film Slate
Black Panther:
Wakanda Forever
Avatar 2
Disney
Disney
Doctor Strange in the Thor: December 16
November 11
Multiverse of Madness Love & Thunder
Disney
Disney
Uncharted The Batman July 8
May 6
Sony Warner Bros.
February 18 Sonic the
Scream March 4 Nope
Paramount
Hedgehog 2
January 14 Paramount Universal The Flash
April 8 July 22 Spiderman-Man: Across Warner Bros.
the Spider-verse November 4
Lightyear Sony
Top Gun: Disney
October 7 Aquaman and the
Morbius Maverick June 17 Lost Kingdom
Bullet Train
Sony Paramount Sony Warner Bros.
April 1 May 27 July 15 December 16
The Man
Oh Hell No From Toronto Creed III
Sony Sony
Bob’s Burgers June 17 United Artist
August 12
Disney November 25
May 27
JANUARY FEBRUARY MARCH APRIL MAY JUNE JULY AUGUST SEPTEMBER OCTOBER NOVEMBER DECEMBER
Jurassic World: Beast
Fantastic Beasts: Universal
Dominion Halloween Ends Bee Gees Untld
August 19
Secrets of Dumbledore Universal Paramount
Paramount Universal October 14 November 4
April 15 June 10
Black Adam Strange World Mario
Warner Bros. Disney Universal
The Lost City The Bad Guys Elvis July 29 November December
Paramount Universal Warner Bros.
March 25 April 22 25 23
June 24 Puss In Boots: The Last Wish
Universal
September 23
DC Super Pets Minions:
Warner Bros. Rise of Gru
May 20 Universal
July 1
Downton Abbey:
A New Era
Focus
March 25
19Appendix
20FY 2021 Non-GAAP Measure Reconciliations
$’s in thousands
Reconciliation of Cash Flows (Used for)
Reconciliation of Net Income/(Loss) to Adjusted EBITDA
Provided by Operating Activities to Free Cash Flow
FY 2021 FY 2019 FY 2021 FY 2019
Net Income/(Loss) ($422,215) $193,848 Cash flows (used for) provided by operating
$166,219 $561,995
activities
Add (deduct):
Income taxes (16,802) 79,912 Deduct:
Interest expense (1) 149,702 99,941 Capital Expenditures 95,542 303,627
Loss on extinguishment of debt 6,527 0 Free Cash Flow $70,677 $258,368
Other (income) expense, net (2) 43,532 (22,441)
Cash distributions from DCIP (3) 0 23,696
Cash distributions from other equity investees(4) 156 29,670
Non-cash distribution from equity investee(5) 0 0
Depreciation and amortization 265,363 261,155
Impairment of long-lived assets and
20,845 57,001
investments
Restructuring costs (1,001) 0 FY 2021 FY 2019
(Gain)/Loss on disposal of assets and other 8,025 12,008
Total Revenues $1,510,464 $3,283,099
Non-cash rent expense (3,451) (4,360)
Share based awards compensation expense 29,271 14,615 Adjusted EBITDA 79,952 745,045
Adjusted EBITDA $79,952 $745,045 Adjusted EBITDA Margin 5.3% 22.7%
1) Includes amortization of debt issue costs.
2) Includes interest income, foreign currency exchange gain (loss), interest expense – NCM and equity in income (loss) of affiliates and excludes distributions from NCM.
3) See discussion of cash distributions from DCIP, which were recorded as a reduction of the Company’s investment in DCIP, in the notes to the consolidated financial statements included in
our Annual Report on Form 10-K filed February 25, 2022. These distributions are reported entirely within the U.S. operating segment.
4) Reflects cash distributions received from equity investees, other than those from DCIP noted above, that were recorded as a reduction of the respective investment balances. These
distributions are reported entirely within the U.S. operating segment.
5) Reflects non-cash distribution of equipment from DCIP. See further discussion in the notes to the consolidated financial statements included in our Annual Report on Form 10-K filed
February 25, 2022 21Thank You
Chanda Brashears
SVP Investor Relations
cbrashears@cinemark.com
972-665-1671
22You can also read