Investor Presentation - May 2021 - Recycling Today for a Sustainable Tomorrow - Schnitzer Steel
←
→
Page content transcription
If your browser does not render page correctly, please read the page content below
Investor
NASDAQ: SCHN
                                               Presentation
                                                     May 2021

               Recycling Today for a Sustainable Tomorrow
Safe Harbor
Statements and information included in this presentation by Schnitzer Steel Industries, Inc. that are not purely historical are forward-looking statements within the meaning of Section 21E of the
Securities Exchange Act of 1934 and are made pursuant to the “safe harbor” provisions of the Private Securities Litigation Reform Act of 1995. Except as noted herein or as the context may
otherwise require, all references to “we,” “our,” “us,” “the Company,” “Schnitzer,” and “SSI” refer to Schnitzer Steel Industries, Inc. and its consolidated subsidiaries. Forward-looking statements in
this presentation include statements regarding future events or our expectations, intentions, beliefs and strategies regarding the future, which may include statements regarding the impact of
pandemics, epidemics or other public health emergencies, such as the coronavirus disease 2019 (“COVID-19”) pandemic; the Company’s outlook, growth initiatives or expected results or
objectives, including pricing, margins, sales volumes and profitability; liquidity positions; our ability to generate cash from continuing operations; trends, cyclicality and changes in the markets we
sell into; strategic direction or goals; targets; changes to manufacturing and production processes; the realization of deferred tax assets; planned capital expenditures; the cost of and the status of
any agreements or actions related to our compliance with environmental and other laws; expected tax rates, deductions and credits; the impact of sanctions and tariffs, quotas and other trade
actions and import restrictions; the potential impact of adopting new accounting pronouncements; obligations under our retirement plans; benefits, savings or additional costs from business
realignment, cost containment and productivity improvement programs; and the adequacy of accruals. Forward-looking statements by their nature address matters that are, to different degrees,
uncertain, and often contain words such as “outlook,” “target,” “aim,” “believes,” “expects,” “anticipates,” “intends,” “assumes,” “estimates,” “evaluates,” “may,” “will,” “should,” “could,” “opinions,”
“forecasts,” “projects,” “plans,” “future,” “forward,” “potential,” “probable,” and similar expressions. However, the absence of these words or similar expressions does not mean that a statement is
not forward-looking.
We may make other forward-looking statements from time to time, including in reports filed with the Securities and Exchange Commission, press releases, presentations and on public conference
calls. All forward-looking statements we make are based on information available to us at the time the statements are made, and we assume no obligation to update any forward-looking
statements, except as may be required by law. Our business is subject to the effects of changes in domestic and global economic conditions and a number of other risks and uncertainties that
could cause actual results to differ materially from those included in, or implied by, such forward-looking statements. Some of these risks and uncertainties are discussed in “Item 1A. Risk Factors”
of Part I of our most recent Annual Report on Form 10-K, as supplemented by our subsequently filed Quarterly Reports on Form 10-Q. Examples of these risks include: the impact of pandemics,
epidemics or other public health emergencies, such as the COVID-19 pandemic; potential environmental cleanup costs related to the Portland Harbor Superfund site or other locations; the
cyclicality and impact of general economic conditions; changing conditions in global markets including the impact of sanctions and tariffs, quotas and other trade actions and import restrictions;
volatile supply and demand conditions affecting prices and volumes in the markets for raw materials and other inputs we purchase; significant decreases in scrap metal prices; imbalances in
supply and demand conditions in the global steel industry; reliance on third party shipping companies, including with respect to freight rates and the availability of transportation; inability to obtain
or renew business licenses and permits; the impact of goodwill impairment charges; the impact of long-lived asset and equity investment impairment charges; failure to realize or delays in
realizing expected benefits from investments in processing and manufacturing technology improvements; inability to achieve or sustain the benefits from productivity, cost savings and
restructuring initiatives; inability to renew facility leases; difficulties associated with acquisitions and integration of acquired businesses; customer fulfillment of their contractual obligations;
increases in the relative value of the U.S. dollar; the impact of foreign currency fluctuations; potential limitations on our ability to access capital resources and existing credit facilities; restrictions
on our business and financial covenants under the agreement governing our bank credit facilities; the impact of consolidation in the steel industry; the impact of equipment upgrades, equipment
failures and facility damage on production; product liability claims; the impact of legal proceedings and legal compliance; the adverse impact of climate change; the impact of not realizing deferred
tax assets; the impact of tax increases and changes in tax rules; the impact of property tax increases or property tax rate changes; the impact of one or more cybersecurity incidents;
environmental compliance costs and potential environmental liabilities; compliance with climate change and greenhouse gas emission laws and regulations; reliance on employees subject to
collective bargaining agreements; and the impact of the underfunded status of multiemployer plans in which we participate.

NON-GAAP FINANCIAL MEASURES
This presentation contains certain non-GAAP financial measures as defined under SEC rules. Reconciliations of the non-GAAP financial measures contained in this presentation to the most
directly comparable U.S. GAAP measure are provided in the Appendix. These non-GAAP financial measures should be considered in addition to, but not as a substitute for, the most directly
comparable U.S. GAAP measures.

                                                                                                                                                                                                           2
Agenda

         I.   Company Overview

     II. Market Conditions & Industry Trends

     III. Strategic Priorities

     IV. Second Quarter Fiscal 2021 Highlights

     V. Delivering Value Through the Cycle

                                                 3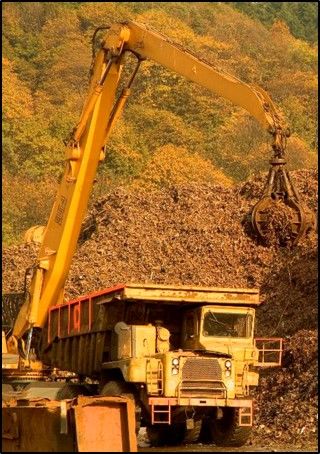
I. Company Overview

                      4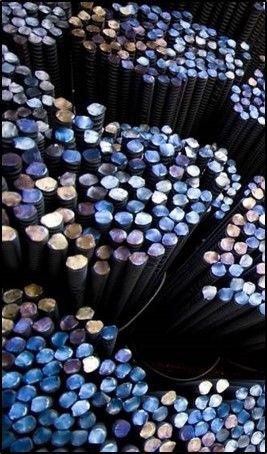
Recycling Today for a Sustainable Tomorrow

Environmental Benefits of Our Business Model                   Our Multi-Year Sustainability Goals
                         (FY20)
                                                                                      People
         4.0 million tons of                551 million             Achieve a                        Donate at least
           ferrous scrap                     pounds of                1.00                           10,000 hours
           metal recycled                 nonferrous scrap      total case incident                 of paid volunteer
                                           metal recycled      rate by end of FY25                     time off for
                        505 thousand tons of                                                         employees by
                      finished steel produced                                                          end of FY25
                        from recycled scrap
                                                                                      Planet
            316 thousand                4.4 million recycled     Reduce absolute                  Enhanced Goal:
         end-of-life vehicles              auto parts sold     GHG emissions from
           purchased and                 retail from end-of-                                       Achieve 100%
                                                               recycling operations
              recycled                      life vehicles                                           net carbon-free
                                                                      25%                          electricity use by
                                                                 by end of FY25                           FY22

                                                                                      Profit
                                                                   Achieve a profitability improvement target of
                                                                             $15 per ferrous ton
                                                                       using sustainability-based initiatives

                                                                 Additional information on our Multi-Year
                                                                 Sustainability Goals can be found in our
                                                                    Fiscal 2020 Sustainability Report

                                                                                                                        5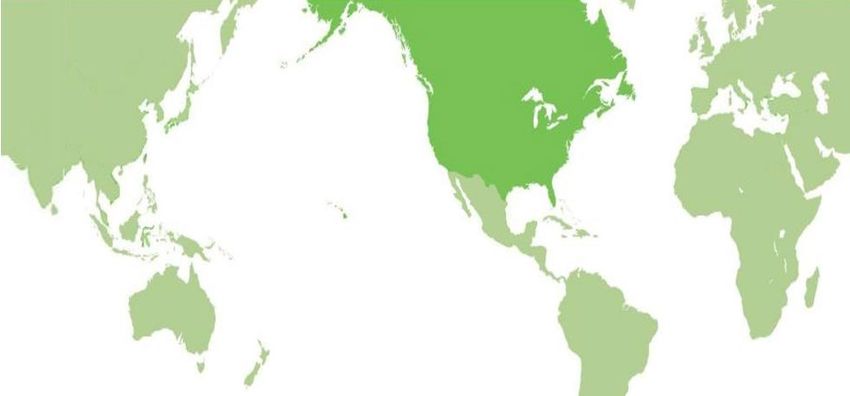
Company Overview
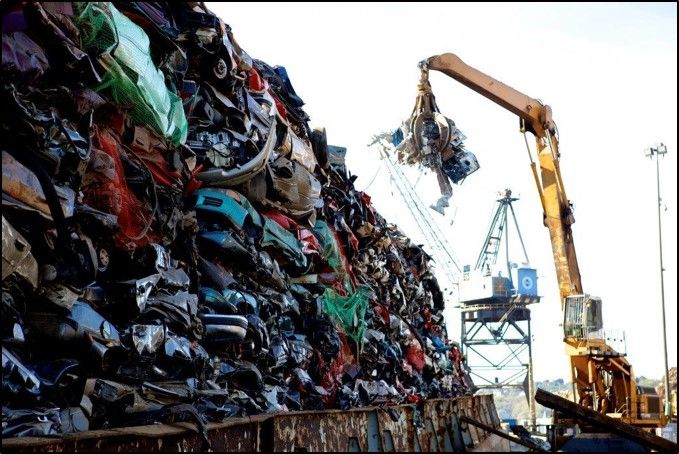
Schnitzer Steel Industries is a leading North American Auto and Metals Recycler
and West Coast Steel Manufacturer
• Sourcing Scrap – Over 40 metals recycling facilities
collect obsolete machinery and equipment, railroad cars
and trucks, automobiles, home appliances, consumer
goods, manufacturing, construction and demolition
metal
• Processing Scrap Metal - 4 million tons of ferrous metal
and 551 million pounds of nonferrous metal processed
annually for use in steel and other manufacturing
globally
• Deep Water Ports - 7 deep water ports on East and
West Coasts, Hawaii and Puerto Rico serve domestic 50 auto parts
and global steel manufacturers retail outlets
• Auto Retail Stores - Integrated operating platform
includes 50 auto parts stores that purchase over 300
thousand salvage vehicles per year, receive
approximately 5 million retail visits annually, and then
send the vehicles to be processed through a shredder
• Electric Arc Furnace (EAF) - Steel manufacturing
facility in Oregon with effective annual production
capacity of 580 thousand tons produces rebar and wire
rod from recycled scrap for construction markets on the
West Coast and Western Canada
6
*Company data based on fiscal 2020; store and facility count based on April 2021
Geographic Platform Enables Worldwide Access

Sourcing scrap through approximately 90 auto parts and metals recycling facilities in
North America and providing processed recycled metals to customers around the world

    Asia                                                                                      Americas                         EAME
                                                                                      Northwest              Northeast
                                                                                     23 Recycling           11 Recycling
                                                                                       Facilities             Facilities
                                                                                               Midwest
                                                                                              and South
                                                                       Southwest             13 Recycling
                                                                      and Hawaii               Facilities        Southeast
                                                                      29 Recycling                              and Puerto
                                                                        Facilities                                  Rico
                                                                                                                18 Recycling
                                                                                                                  Facilities

                                                               Schnitzer Export Facilities
                                                                FY20 Export Destinations
                                                                Cascade Steel Mill

                                                                                                                                  7
             *Company store and facility count based on Fiscal 2020
II. Market Conditions & Industry Trends

                                          8
Metals & Finished Steel Market Price Trends
       Ferrous Market Price Trends                                                                        Rebar & Wire Rod Market Price Trends
                            ($/ton)                                                                                                         ($/ST)
                                                         2Q21                                                                                                2Q21

      Nonferrous Market Price Trends                                                                     Ferrous & Iron Ore Market Price Trends
                            ($/LB)                                                                                                          ($/ton)
                                                 2Q21
                                                                                                                                                      2Q21

        Sources: Platts, Argus, AMM (updated as of 5/14/21)
        (1) West Coast and East Coast prices are based on HMS CFR price and Domestic prices are based on Midwest delivered shred                                    9
        (2) Zorba based on Aluminum scrap Zorba min 99/3 cif China USD/lb
        *Domestic rebar and wire rod prices based on US Midwest prices, respectively; import rebar prices based on Houston import prices.
Drivers for Recycled Metals Demand
Increased Metal Intensity of Lower Global EAF Steel Production Trends
Carbon-Based Technologies Crude Steel Production (mmt)
Lower • Growth in renewables
Carbon-
• Greater use of Expected
Based continued
batteries and electric
Technologies vehicles
growth in
EAF
production
• Development of
“smart grids”
Chinese Scrap Consumption to Crude U.S. EAF Market Share Expansion Trends
Steel Production Ratio (% of Total Crude Steel Production)
~20% 30%
China’s use of scrap in Additional >10Mt of EAF
steelmaking is expected capacity by 2022 announced
to increase by 50%, or
over 100mmt, by 2025
2020e 2025 Target
Positive drivers of recycled metals demand are underpinned by several strong and sustainable trends, including global
EAF production growth, focus on decarbonization and a growing emphasis on recycling and landfill diversion
10
Sources: Company estimates, US International Trade Commission, World Steel Association, China’s Ministry of Industry and Information Technology (MIIT)III. Strategic Priorities
11Strategic Actions for Continued Growth
Created an integrated operating platform to drive growth,
Deploy Advanced
Metal Recovery improve efficiency and support strategic initiatives
Technologies
One • Increase ferrous, nonferrous and finished steel volumes
through investments in technologies, logistics and
Schnitzer Increase
Volumes and
commercial initiatives
Expand Products & • Accelerate revenue growth through new products and
Recycling Services recycling services
Industry Dynamics Strategic Initiative Targeted Benefits
Lower processing costs, higher
Regulatory and Deploy Advanced Metal throughput and greater metal yields
structural changes Recovery Technologies Expansion of customer base and
increased product optionality
5 million tons of ferrous sales per
Evolving market dynamics Increase Volumes and annum by FY23, an increase of 1
and long-term drivers of Expand Products & million tons from FY20
scrap demand Recycling Services Increased product offerings and
recycling service capabilities
12Advanced Metal Recovery Technology Initiatives
Producing Higher Value Products
Technology & Product Optionality
Higher Value Products
Non-Fe Material from
Shredder Production Advanced Twitch (Aluminum) Brass
Aluminum
Nonferrous Separation Copper Stainless
Products Systems Zinc Mixed Heavies
---
Zorba
Primary Nonferrous Zurik
Recovery System Insulated Advanced Refinery Grade Copper
Copper Wire Copper Mixed Heavies
Separation Stainless
Systems
Progress on Rollout
Two new major systems commissioned since Five other systems in permitting or engineering
the end of 2Q21 phase
• Primary Nonferrous Recovery System Three advanced copper separation systems
(West Coast) previously implemented
• Advanced Aluminum Separation System Targeting to complete installations by 1QFY22
(Southeast)
Projected total investment of $105 million, with
Two additional systems currently under
approximately $60 million spent to date
construction
13IV. Second Quarter Fiscal 2021 Highlights
14Second Quarter Fiscal 2021 Highlights
Achieved Strong Adjusted EBITDA of $71 million, driven by strong market conditions and benefits from
Improvement in strategic actions, partially offset by the impact of severe weather conditions on shipments
Financial Results Adjusted EPS of $1.51, more than double adjusted EPS in 1Q21
Adjusted EBITDA per ferrous ton of $73, representing best quarterly performance since 2008
Delivered Robust Nonferrous sales volumes up 9% YoY, reflecting strong global demand
Operating Finished steel sales volumes up 6% YoY on continued strength of West Coast construction
Performance demand and benefits from commercial initiatives
Ferrous sales volumes down slightly YoY, due to the timing of shipments
Progress on Benefits from the One Schnitzer operating platform supported strong financial results
Strategic Two major new nonferrous recovery systems commissioned since the end of the second
Initiatives quarter
2Q21 1Q21 2Q20 2Q21 1Q21 2Q20
Adjusted EPS from Cont. Operations $1.51 $0.57 $0.31 Ferrous Sales Volumes (000s LT) 977 1053 988
Adjusted EBITDA ($ millions) $71 $40 $28 Nonferrous Sales Volumes (M Lbs) 136 138 124
Adjusted EBITDA per Ferrous Ton $73 $38 $29 Finished Steel Sales Volumes (000s ST) 136 134 129
15
Note: For a reconciliation to U.S. GAAP of adjusted earnings per share from continuing operations, adjusted EBITDA and adjusted EBITDA per ferrous ton, see appendix.Ferrous Market Dynamics
Ferrous Volumes & Average Selling Prices SSI Total Ferrous Volumes by Destination
1Q21 2Q21
(1)
(1) (2)
(1)
(2)
Adjusted EBITDA per Ferrous Ton Flexible Platform & Global Reach
$48
$33
• Export customers accounted for 60% of total ferrous
sales volumes in 2Q21
$22
• Mexico, Bangladesh, Ecuador and Peru were the top
export destinations for ferrous shipments in 2Q21
• Sales volumes down slightly sequentially in 2Q21,
primarily due to impact of severe weather conditions
on timing of shipments
(1) Domestic includes volumes to our steel mill for finished steel production and (2) Europe (including Turkey), Africa and Middle East 16
Note: For a reconciliation to U.S. GAAP of adjusted EBITDA per ferrous ton, see appendix.Nonferrous Market Dynamics
Nonferrous Volumes & Average Selling Prices SSI Total Nonferrous Volumes by Destination
1Q21 2Q21
1H21 Nonferrous Product Mix by Volume Focus on Sales Diversification & Product
Nonferrous
Optionality
from shredder • Sold nonferrous products to a total of 18 countries
production Nonferrous
(47%) other (53%)
in 2Q21
• Market prices for aluminum, copper and zorba
reached multi-year highs during the quarter
• Sales volumes in 2Q21 reflected strong global
demand and the benefits of commercial initiatives
17Finished Steel Market Dynamics
Finished Steel Sales Volumes & Average Selling Prices SSI Capacity Utilization Rates
Total U.S. Steel Capacity Utilization Rates Steady Demand & Commercial Initiative Benefits
• Highest second quarter finished steel sales volumes since
2Q08
• Commercial initiatives and strength of construction demand
in our West Coast markets drove YoY volume improvement
• Rolling mill utilization rate of 88% in the quarter, lower
sequentially due to seasonality and severe weather
conditions
• Steady growth in total U.S. capacity utilization rate from
April 2020 lows
18
Source: American Iron and Steel InstituteStrong Balance Sheet & Liquidity Position
Operating Cash Flows
($ Millions)
• 2Q21 positive operating cash flow, as
strong profitability offset the impact of
Cash Flow increased working capital
& • Demonstrated ability to generate
Liquidity operating cash flow through the cycle
• $700 million credit facility maturing in
2023
Strong • Net debt to adjusted EBITDA ratio of
Balance 1.0x
Net Debt to Adjusted EBITDA
Sheet • Net leverage ratio of 18%
• Capital expenditures of $23 million in
Capital 2Q21
Allocation • 108th consecutive quarterly dividend
paid in 2Q21
19
Note: Net debt is total debt, net of cash. For a reconciliation to U.S. GAAP of net debt, net debt to adjusted EBITDA and net leverage ratio, see appendix.V. Delivering Value Through The Cycle
20Delivering Value Through the Cycle
Best quarterly adjusted EBITDA per ferrous ton
since 2008, driven by strong market conditions and
benefits from strategic actions
Q2 Volume performance reflected strong global
Performance demand, but severe weather conditions impacted
timing of shipments
Two major new nonferrous recovery systems
commissioned since the end of the second quarter
Multi-year sustainability goals: People, Planet,
Profit
Higher value furnace-ready product strategy
Strategic
Priorities Top line revenue growth, including higher volumes,
additional new services, increased product
optionality and new offerings
Balanced capital allocation strategy
21
Note: For a reconciliation to U.S. GAAP of adjusted EBITDA per ferrous ton, see appendix.APPENDIX
22Non-GAAP Financial Measures
This presentation contains performance based on adjusted diluted earnings (loss) per share from continuing operations attributable to SSI
shareholders, adjusted EBITDA and adjusted EBITDA per ferrous ton which are non-GAAP financial measures as defined under SEC rules. As
required by SEC rules, the Company has provided a reconciliation of these measures for each period discussed to the most directly comparable
U.S. GAAP measure. Management believes that providing these non-GAAP financial measures adds a meaningful presentation of our results from
business operations excluding adjustments including for (recoveries) charges for legacy environmental matters (net of recoveries), business
development costs not related to ongoing operations, restructuring charges and other exit-related activities, asset impairment charges (net of
recoveries), charges related to the settlement of a wage and hour class action lawsuit and the income tax expense (benefit) allocated to these
adjustments, items which are not related to underlying business operational performance, and improves the period-to-period comparability of our
results from business operations. We believe that presenting debt, net of cash is useful to investors as a measure of our leverage, as cash and cash
equivalents can be used, among other things, to repay indebtedness. These non-GAAP financial measures should be considered in addition to, but
not as a substitute for, the most directly comparable U.S. GAAP measures.
Further, management believes that:
• Adjusted EBITDA is a useful measure of the Company’s financial performance and liquidity;
• Net Debt (debt, net of cash) to Adjusted EBITDA Ratio is a useful measure of the Company’s liquidity; and
• Adjusted EBITDA per ferrous ton is a useful indicator of the Company’s financial performance.
These non-GAAP financial measures should be considered in addition to, but not as a substitute for, the most directly comparable U.S. GAAP
measures.
23Non-GAAP Financial Measures
The following is a reconciliation of each of these measures to the most directly comparable U.S. GAAP measure:
Consolidated Operating Income (Loss) Quarter Fiscal Year
($ in thousands) 2Q21 1Q21 4Q20 3Q20 2Q20 1Q20 4Q19 3Q19 2Q19 1Q19 2020 2019
As reported $ 58,584 $ 22,770 $ 10,779 $ (3,706) $ 7,691 $ (7,910) $ 17,681 $ 24,459 $ 19,036 $ 22,689 $ 6,854 $ 83,865
Restructuring charges and other exit-related activities 814 64 1,183 2,710 4,633 467 (448) 75 536 202 8,993 365
(Recoveries) charges for legacy environmental matters, net(1) (2,214) 2,760 275 2,078 451 1,293 749 502 697 471 4,097 2,419
Business development costs — — 27 791 801 — — — — — 1,619 —
Asset impairment charges — — 1,408 2,227 402 1,692 — — — 63 5,729 63
Charges related to the settlement of a wage and hour class action lawsuit — — — 73 — — — 2,330 — — 73 2,330
Adjusted $ 57,184 $ 25,594 $ 13,672 $ 4,173 $ 13,978 $ (4,458) $ 17,982 $ 27,366 $ 20,269 $ 23,425 $ 27,365 $ 89,042
(1) Legal and environmental charges, net of recoveries, for legacy environmental matters including those related to the Portland Harbor Superfund site and to other legacy environmental loss contingencies.
Selling, General and Administrative Expense Quarter Fiscal Year
($ in thousands) 2Q21 1Q21 4Q20 3Q20 2Q20 1Q20 4Q19 3Q19 2Q19 1Q19 2020 2019
As reported $ 54,142 $ 49,906 $ 49,132 $ 45,544 $ 46,426 $ 46,774 $ 51,922 $ 48,575 $ 39,489 $ 51,419 $ 187,876 $ 191,405
Recoveries (charges) for legacy environmental matters, net(1) 2,214 (2,760) (275) (2,078) (451) (1,293) (749) (502) (697) (471) (4,097) (2,419)
Business development costs — — (27) (791) (801) — — — — — (1,619) —
Charges related to the settlement of a wage and hour class action lawsuit — — — (73) — — — (2,330) — — (73) (2,330)
Adjusted $ 56,356 $ 47,146 $ 48,830 $ 42,602 $ 45,174 $ 45,481 $ 51,173 $ 45,743 $ 38,792 $ 50,948 $ 182,087 $ 186,656
(1) Legal and environmental charges, net of recoveries, for legacy environmental matters including those related to the Portland Harbor Superfund site and to other legacy environmental loss contingencies.
24Non-GAAP Financial Measures
The following is a reconciliation of each of these measures to the most directly comparable U.S. GAAP measure:
Net Income (Loss) from Continuing Operations Attributable to SSI
shareholders Quarter Fiscal Year
($ in thousands) 2Q21 1Q21 4Q20 3Q20 2Q20 1Q20 2020
As reported $ 44,558 $ 14,146 $ 4,017 $ (4,926) $ 3,882 $ (7,023) $ (4,050)
Restructuring charges and other exit-related activities 814 64 1,183 2,710 4,633 467 8,993
(Recoveries) charges for legacy environmental matters, net(1) (2,214) 2,760 275 2,078 451 1,293 4,097
Business development costs — — 27 791 801 - 1,619
Asset impairment charges — — 1,408 2,227 402 1,692 5,729
Charges related to the settlement of a wage and hour class action lawsuit — — — 73 — - 73
Income tax expense (benefit) allocated to adjustments(2) 334 (649) (311) (1,568) (1,464) (1,151) (4,494)
Adjusted $ 43,492 $ 16,321 $ 6,599 $ 1,385 $ 8,705 $ (4,722) $ 11,967
Diluted Earnings (Loss) Per Share from Continuing Operations Attributable
to SSI Shareholders Quarter Fiscal Year
($ per share) 2Q21 1Q21 4Q20 3Q20 2Q20 1Q20 2020
As reported $ 1.54 $ 0.50 $ 0.14 $ (0.18) $ 0.14 $ (0.26) $ (0.15)
Restructuring charges and other exit-related activities 0.03 — 0.04 0.10 0.16 0.02 0.32
(Recoveries) charges for legacy environmental matters, net(1) (0.08) 0.10 0.01 0.07 0.02 0.05 0.15
Business development costs — — — 0.03 0.03 — 0.06
Asset impairment charges — — 0.05 0.08 0.01 0.06 0.21
Charges related to the settlement of a wage and hour class action lawsuit — — — — — — —
Income tax expense (benefit) allocated to adjustments(2) 0.01 (0.02) (0.01) (0.06) (0.05) (0.04) (0.16)
Adjusted(3) $ 1.51 $ 0.57 $ 0.23 $ 0.05 $ 0.31 $ (0.17) $ 0.43
(1) Legal and environmental charges for legacy environmental matters (net of recoveries). Legacy environmental matters include charges (net of recoveries) related to the Portland Harbor
Superfund site and to other legacy environmental loss contingencies.
(2) Income tax allocated to the aggregate adjustments reconciling reported and adjusted net income (loss) from continuing operations attributable to SSI shareholders and diluted earnings
(loss) per share from continuing operations attributable to SSI shareholders is determined based on a tax provision calculated with and without the adjustments.
(3) May not foot due to rounding.
25Non-GAAP Financial Measures
Net Leverage Ratio
• Net Debt (Debt, net of cash) is the difference between (i) the sum of long-term debt and short-term debt (i.e., total debt) and (ii) cash and cash equivalents.
• Net Capital is the difference between (i) the sum of total equity and total debt (i.e., total capital) and (ii) cash and cash equivalents.
• The net leverage ratio is the ratio of Net Debt to Net Capital, expressed as a percentage.
• The following is a reconciliation of the Net Leverage Ratio:
Net Debt leverage Ratio 2Q21 1Q21 4Q20 3Q20(1) 2Q20 1Q20
($ in millions)
Total Debt $ 171 $ 143 $ 104 $ 428 $ 142 $ 128
Less cash and cash equivalents (11) (7) (18) (308) (10) (10)
Net Debt(2) $ 159 $ 136 $ 87 $ 121 $ 132 $ 119
Total Debt $ 171 $ 143 $ 104 $ 428 $ 142 $ 128
Total Equity 734 689 680 674 685 685
Total Capital(2) $ 905 $ 832 $ 785 $ 1,103 $ 827 $ 813
Less cash and cash equivalents (11) (7) (18) (308) (10) (10)
Net Capital $ 894 $ 825 $ 767 $ 795 $ 817 $ 804
Total Debt to Total Capital Ratio 18.9 % 17.2 % 13.3 % 38.8 % 17.2 % 15.8 %
Impact excluding cash and cash equivalents
from both Total Debt and Total Capital (1.0)% (0.7)% (2.0)% (23.7)% (1.0)% (1.0)%
(2)
Leverage Ratio 17.8 % 16.5 % 11.3 % 15.2 % 16.1 % 14.8 %
(1) During the third quarter of fiscal 2020, we borrowed an incremental $250 million under our credit facilities in order to increase our cash
position and preserve financial flexibility in light of the COVID-19 outbreak. We repaid the $250 million of additional borrowings in the fourth
quarter of fiscal 2020.
(2) May not foot due to rounding.
26Non-GAAP Financial Measures
Adjusted EBITDA and Adjusted EBITDA Per Ferrous Ton
Adjusted EBITDA – Earnings before interest, taxes, depreciation, amortization, adjustments for charges related to the settlement of a wage and hour class
action lawsuit, charges for legacy environmental matters (net of recoveries), asset impairments (net of recoveries), restructuring charges and other exit-related
activities, business development costs not related to ongoing operations and discontinued operations (net of tax).
The following is a reconciliation of net income (loss) to adjusted EBITDA and adjusted EBITDA per ferrous ton sold:
Adjusted EBITDA Quarter
($ in thousands) 2Q21 1Q21 4Q20 3Q20 2Q20 1Q20 4Q19 3Q19 2Q19 1Q19 4Q18 3Q18 2Q18 1Q18
Net income (loss) $ 45,679 $ 15,064 $ 4,578 $ (4,717) $ 4,504 $ (6,565) $ 11,967 $ 16,440 $ 13,297 $ 16,618 $ 60,201 $ 38,448 $ 41,919 $ 19,221
Plus (income) loss from discontinued operations, net of tax (30) 42 55 69 (1) (28) 46 (8) 138 72 (273) 56 (164) 35
Plus interest expense 1,224 1,780 3,270 2,656 1,320 1,423 1,999 2,294 2,067 1,906 2,160 2,483 2,281 2,059
Plus tax expense (benefit) 11,469 5,719 2,734 (1,804) 1,770 (2,534) 3,937 5,762 3,855 4,116 (23,620) 10,650 (10,577) 5,957
Plus depreciation & amortization 14,469 14,826 14,958 14,743 14,385 14,087 13,692 13,154 13,193 13,297 12,663 12,327 12,160 12,522
Plus restructuring charges and other exit-related activities 814 64 1,183 2,710 4,633 467 (448) 75 536 202 (922) 70 91 100
(1)
Plus (recoveries) charges for legacy environmental matters, net (2,214) 2,760 275 2,078 451 1,293 749 502 697 471 1,420 393 1,090 4,365
Plus business development costs — — 27 791 801 — — — — — — — — —
Plus asset impairment charges — — 1,408 2,227 402 1,692 — — — 63 532 (1,465) — (88)
Plus charges related to the settlement of a wage and hour class
action lawsuit — — — 73 — — — 2,330 — — — — — —
Plus recoveries related to the resale or modification of previously
contracted shipments — — — — — — — — — — — — — (417)
(2)
Adjusted EBITDA $ 71,411 $ 40,255 $ 28,488 $ 18,826 $ 28,265 $ 9,835 $ 31,942 $ 40,549 $ 33,783 $ 36,745 $ 52,161 $ 62,962 $ 46,800 $ 43,754
Estimated average inventory accounting impact 9,596 2,246 1,799 (2,580) 3,748 (4,376) (1,271) (536) (743) (43) (2,224) (743) 4,591 163
Adjusted EBITDA excluding estimated average inventory accounting $ 61,815 $ 38,009 $ 26,689 $ 21,406 $ 24,517 $ 14,211 $ 33,213 $ 41,085 $ 34,526 $ 36,788 $ 54,385 $ 63,705 $ 42,209 $ 43,591
Total Ferrous Volumes (LT, in thousands) 977 1,053 1,063 927 988 976 1,168 1,079 992 1,080 1,206 1,119 1,062 912
Adjusted EBITDA per Ferrous Ton Sold ($/LT) $ 73 $ 38 $ 27 $ 20 $ 29 $ 10 $ 27 $ 38 $ 34 $ 34 $ 43 $ 56 $ 44 $ 48
Adjusted EBITDA excluding estimated average inventory accounting
per Ferrous Ton Sold ($/LT) $ 63 $ 36 $ 25 $ 23 $ 25 $ 15 $ 28 $ 38 $ 35 $ 34 $ 45 $ 55 $ 40 $ 48
(1) Legal and environmental charges for legacy environmental matters (net of recoveries). Legacy environmental matters include charges (net of recoveries) related to the Portland Harbor Superfund site and to other legacy environmental loss
contingencies.
(2) May not foot due to rounding.
27Non-GAAP Financial Measures
Net Debt to Adjusted EBITDA Ratio
The following is a reconciliation of cash flows from operating activities to adjusted EBITDA; debt to net debt (debt, net of cash); the debt to cash flows from operating
activities ratio; and the net debt to adjusted EBITDA ratio:
Net Debt to Adjusted EBITDA Ratio LFQ Fiscal Year
($ in thousands) 2Q21 2020 2019 2018 2017 2016 2015 2014 2013
Cash flows from operating activities $ 105,334 $ 124,597 $ 144,740 $ 159,676 $ 100,370 $ 99,240 $ 144,628 $ 141,252 $ 39,289
Exit-related gains, asset impairments and accelerated depreciation, net — (971) (23) 1,000 407 (1,790) (6,502) (566) —
Write-off of debt issuance costs — — — — — (768) — — —
Inventory write-down — — (775) (38) — (710) (3,031) — —
Deferred income taxes (21,697) (15,096) (14,613) 37,995 (2,278) (507) 1,988 3,815 59,102
Undistributed equity in earnings of joint ventures 1,626 834 1,452 1,953 3,674 819 1,490 1,196 1,183
Share-based compensation expense (12,670) (10,033) (17,300) (18,965) (10,847) (10,437) (10,481) (14,506) (11,475)
Excess tax benefit from share-based payment arrangements — — — — — — 343 194 343
(Loss) gain on disposal of assets (723) (530) 1,545 (56) (448) 465 2,875 1,126 (131)
Unrealized foreign exchange (loss) gain, net (38) 67 (148) 104 (361) 109 1,909 (240) (1,583)
Bad debt (expense) recoveries, net (79) (66) (74) (323) (126) (131) 264 (449) (584)
Change in current assets and current liabilities 56,958 (34,246) (1,182) 34,081 10,666 (19,317) (76,736) (39,011) 53,654
Changes in other operating assets and liabilities (5,476) (2,854) (1,901) (6,987) (4,958) (405) 2,252 (2,550) (2,699)
Interest expense 8,930 8,669 8,266 8,983 8,081 8,889 9,191 10,595 9,623
Tax expense (benefit) 18,118 166 17,670 (17,590) 1,322 735 (12,615) 2,583 (56,943)
Restructuring charges and other exit-related activities 4,771 8,993 365 (661) (109) 6,782 13,008 6,830 7,906
Charge related to the settlement of a wage and hour class action lawsuit 73 73 2,330 — — — — — —
Charges for legacy environmental matters, net(1) 2,899 4,097 2,419 7,268 2,648 (3,863) (1,009) 1,750 1,759
Business development costs 818 1,619 — — — — — — —
Loss (gain) from discontinued operations, net of tax 136 95 248 (346) 390 1,348 7,227 2,809 4,242
Depreciation and amortization from discontinued operations — — — — — — (821) (1,335) (861)
Recoveries related to the resale or modification of previously contracted shipments — — — (417) (1,144) (694) 6,928 — —
Adjusted EBITDA $ 158,980 $ 85,414 $ 143,019 $ 205,677 $ 107,287 $ 79,765 $ 80,908 $ 113,493 $ 102,825
Debt 170,813 104,419 105,096 107,376 145,124 192,518 228,156 319,365 381,837
Cash and cash equivalents (11,326) (17,887) (12,377) (4,723) $ (7,287) $ (26,819) $ (22,755) (25,672) (13,481)
Net debt $ 159,487 $ 86,532 $ 92,719 $ 102,653 $ 137,837 $ 165,699 $ 205,401 $ 293,693 $ 368,356
Debt to cash flows from operating activities ratio 1.6 0.8 0.7 0.7 1.4 1.9 1.6 2.3 9.7
Net debt to adjusted EBITDA ratio 1.0 1.0 0.6 0.5 1.3 2.1 2.5 2.6 3.6
(1) Legal and environmental charges for legacy environmental matters (net of recoveries). Legacy environmental matters include charges (net of recoveries) related to the Portland Harbor Superfund site and
to other legacy environmental loss contingencies.
28Historical Segment Operating Statistics
The following provides consolidated operating statistics:
Quarter Fiscal Year(1)
2Q21 1Q21 4Q20 3Q20 2Q20 1Q20 2020
Ferrous volumes (LT, in thousands)(2)
Domestic (3) 391 388 375 312 379 363 1,429
Export 586 665 688 616 609 613 2,525
Total(5) 977 1,053 1,063 927 988 976 3,954
Ferrous selling prices ($/LT)(4)
Domestic $ 349 $ 242 $ 214 $ 222 $ 244 $ 196 $ 220
Export $ 399 $ 276 $ 242 $ 236 $ 258 $ 229 $ 241
Average $ 387 $ 269 $ 236 $ 233 $ 255 $ 222 $ 237
Nonferrous volumes (pounds, in thousands)(2) 135,899 138,236 159,135 122,913 124,342 144,176 550,566
Nonferrous average price ($/pound)(4)(6) $ 0.83 $ 0.64 $ 0.56 $ 0.54 $ 0.55 $ 0.54 $ 0.55
(7)
Cars purchased (in thousands) 80 78 74 74 85 83 316
Auto part stores at period end 50 50 50 49 51 51 50
Finished steel average sales price ($/ST)(4) $ 690 $ 621 $ 618 $ 633 $ 627 $ 643 $ 630
Sales volume (ST, in thousands)
Rebar 103 94 105 85 86 83 358
Coiled products 32 39 34 39 42 29 144
Merchant bar and other 1 1 — 1 1 1 3
Finished steel products sold(5) 136 134 139 124 129 114 505
(8)
Rolling mill utilization 88% 97% 96% 91% 72% 85% 86%
Tons for recycled ferrous metal are LT (Long Ton, which is equivalent to 2,240 pounds) and for finished steel products are ST (Short Ton, which is equivalent to 2,000
pounds).
(1) The sum of quarterly amounts may not agree to full year equivalent due to rounding.
(2) Ferrous and nonferrous volumes sold externally and delivered to our steel mill for finished steel production.
(3) Domestic includes volumes delivered to our steel mill for finished steel production.
(4) Price information is shown after netting the cost of freight incurred to deliver the product to the customer.
(5) May not foot due to rounding.
(6) Excludes platinum group metals (“PGMs”) in catalytic converters.
(7) Cars purchased by auto stores only.
(8) Rolling mill utilization is based on effective annual production capacity under current conditions of 580 thousand tons of finished steel products.
29You can also read