LAKE AND WATERSHED OVERVIEW-2
←
→
Page content transcription
If your browser does not render page correctly, please read the page content below
-2-
                      LAKE AND WATERSHED OVERVIEW
           “A lake is a landscape’s most beautiful and expressive feature. It is earth’s eye; looking into
                            which the beholder measures the depth of his own nature.”

                          -- Henry David Thoreau, American philosopher and naturalist

2-1     LOCATION

Lake Ripley is located in Township 6 North, Range 13 East,
Sections 7-8, Town of Oakland, in western Jefferson
County, Wisconsin (see Figure 3). It is situated on the
eastern edge of the Village of Cambridge (Dane County),
and about 25 miles east of Madison. The Lake Ripley
watershed, or the land area that drains surface water to the
lake, covers just over seven square miles of the surrounding
landscape within Sections 3 to 10 and 15 to 18. The mostly
rural watershed includes the immediate lake area and              Lake Ripley taken on a calm, summer morning.
extends 2.7 miles east of the lake. At its widest points, the
watershed stretches four miles along its east-west axis, and three miles along its north-south axis.

2-2     HISTORICAL MILESTONES

According to Burris (1971), Native American burial mounds found along Lake Ripley’s north
and east shore mark the remains of an ancient civilization, and offer evidence of some of the first
humans that frequented the lake (see Figure 4). 1 Long after these ancient Indians vanished, the
modern indigenous tribes of the Pottawatomie and Winnebago came to fish and hunt around its
shores.

It was not until the mid-19th century before European settlement began in earnest, bringing with
it large-scale watershed changes that helped shape the lake into what it is today. A U.S.
government survey conducted from 1834-1836 under the direction of Robert Lytle, Survey
General, mapped and named the lake (see Figure 5). There were already 15 lots established
around the lake at the time of the survey. The landscape around the lake at this time was
characteristic of oak savanna, and consisted of a mix of wetlands, upland prairie, and central-
hardwood woodlands.

1
 Burris, John E. 1971. A Study of Man’s Effects on Lake Ripley. University of Wisconsin-Madison.
Zoology 518 Report.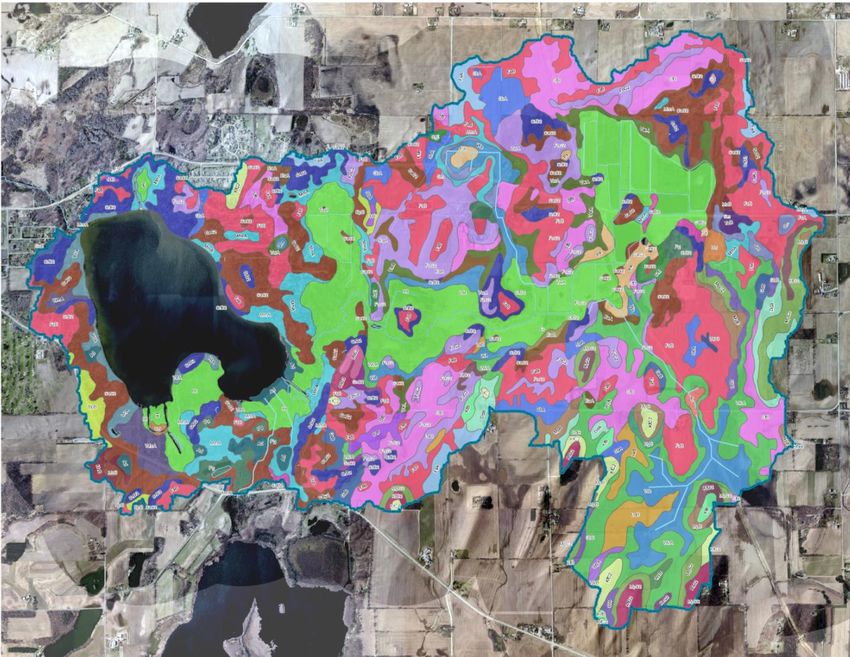
Figure 1: Town of Oakland Plat Map (2007)2

2
    2007 Rockford Map Publishing, Inc.
Figure 2: Map of Native American Effigy Mounds on Lake Ripley3

3
 Lapham, Increase Allen. 1811-1875. The Antiquities of Wisconsin. Washington: Smithsonian Institution,
1855. plate 29.
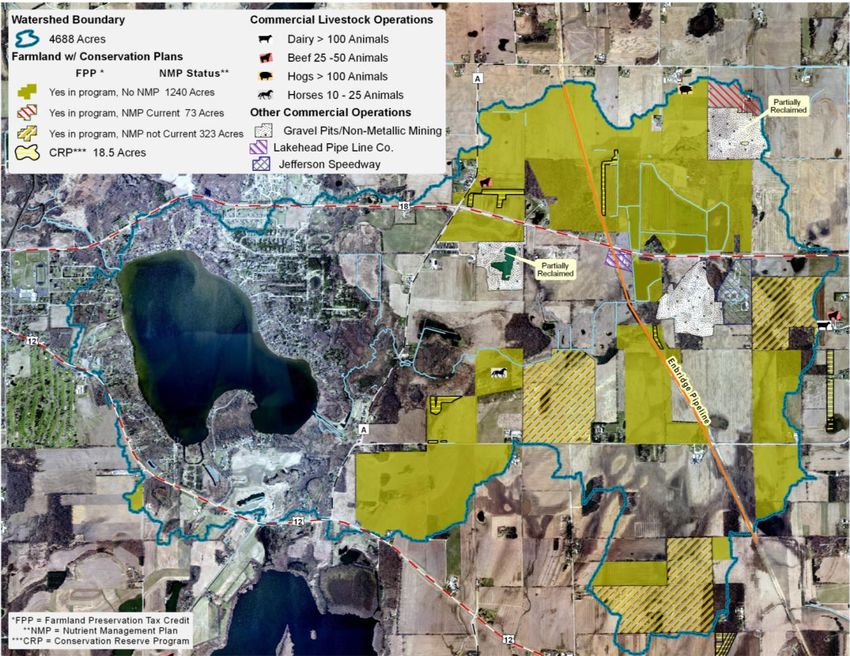
Figure 3: 1835 Oakland Township Plat Map Showing Lake Ripley Area4

During the late 1830s and early 1840s, European settlers started arriving. The first recorded
settler, George Dow, was a Scottish immigrant from New York. Dow purchased a 242-acre
government tract on Lake Ripley as an agricultural holding in 1840. The lake at that time was
known as Lake Dow.5 For the next 30 years, the Lake Ripley area was primarily devoted to
farming, with about 400 people living in the vicinity by 1872. This
time period marked the start of large-scale watershed alterations as
early agricultural development led to extensive land clearing and
wetland drainage.

The lake became a popular recreational destination for tourists and
vacationing families following the completion of a railroad line
from Milwaukee to Madison in 1881. Captain Cowles built the first summer home (named
Inglesides) on the lake in 1882, prompting the building of a few additional summer houses over
the next 13 years.6 Summer home construction intensified when a railroad spur from the Town

4
  Garrison, Paul J. and Robert Pillsbury. 2009. Paleoecological Study of Lake Ripley, Jefferson County.
Wisconsin Department of Natural Resources, Bureau of Science Services; and University of Wisconsin-
Oshkosh, Department of Biology. PUB-SS-1062 2009.
5
  Dow, G. and A.B. Carpenter. 1877. Cambridge. In Dane County and Surrounding Towns; being a
History and Guide. Wm. J. Park and Co. Madison, WI. Pp.366-370.
6
  Cambridge News, July 13, 1961, p.3.
of London to the Village of Cambridge was established, making the area easily accessible to
summer visitors from Chicago and Milwaukee. Willerup Park, which is currently known as the
Willerup Bible Camp, was purchased on Lake Ripley’s west shore in 1886.

Lake Ripley became a small but popular summer resort area during the early part of the 20th
century. This was also the time when Ole Evinrude, founder of Evinrude Outboard Motors,
tested some of his first engine prototypes on the lake. Cedar Lodge was the first hotel built to
accommodate visitors, followed shortly by The Hayden and Edgewood Villa. By 1914, Cedar
Lodge had 14 cottages and could accommodate 130 people.7 Cedar Lodge even produced a
tourist pamphlet extolling the beauty of Lake Ripley and the vast number of bass and pickerel
waiting to be caught.

While the railroad spur to Cambridge was discontinued in 1916, the lake remained a popular
vacation spot. In 1924, there were two large hotels, three smaller ones, and a number of
privately owned cottages.8 Foundation Park (now called Lake Ripley Park and owned by the
Cambridge Foundation) was purchased in 1932 as a place for the community to gather and enjoy
the lake. Sometime shortly prior to this date, a rubble dam was first built at the outlet in an
attempt to maintain water levels during drought conditions. The dam was raised and reinforced
in 1932 by the Lake Ripley Betterment Club.9

Although the hotels eventually disappeared from Lake Ripley, cottages continued to be built
along its shores, especially after World War II, and the lake remained popular with summer
vacationers and tourists. Lake Ripley received additional notoriety in 1940 when the state record
largemouth bass was caught, weighing a hefty 11 pounds, 3 ounces. Aerial photographs at this
time show evidence of early hydrologic modifications, particularly the dredging and
channelization of Lake Ripley’s inlet.

Following World War II, agricultural mechanization greatly increased and the use of synthetic
fertilizers became common practice. This resulted in a larger proportion of land within the
watershed under cultivation, as well as increased rates of nutrient application onto the landscape,
greater soil erosion, and increased nutrient runoff. Residential construction also affected the lake
by increasing soil erosion rates, and by contributing sewage effluent as a result of failing septic
systems.

By 1949, a small stream inlet on the north side of the lake was closed off and a pumping station
was built in what is still called the Shore Place Subdivision. Originally a tamarack marsh, the
growing subdivision was permitted to pump septic-contaminated water and divert it outside the
watershed to the north. This practice was evident in a 1970 sanitary survey that discovered a
fecal coliform count of 4,000/100 ml in a Highway 18 drainage ditch close to where the pump
was discharging. Pumping continues to this day to keep nearby homes from flooding, but the

7
  Chase, Wayland and Lowell Noland. The History and Hydrography of Lake Ripley. Trans. Wisconsin
Academy of Sciences, Arts and Letters, vol. 23, 1927.
8
  Scott, B.M. 1924. History of Cambridge, Wisconsin. Unpublished manuscript. 35 pp.
9
  Public Service Commission report on permit to raise dam on outlet creek of Lake Ripley, January 8,
1960.

discharge water is no longer contaminated. This is most likely due to the replacement of private
septic systems by a municipal wastewater treatment facility in the early 1980s.

In 1963, excavation of the 900-foot “Vasby’s Ditch” was initiated by a private landowner,
eventually forming a horseshoe-shaped channel and three-acre island at the southern extent of
South Bay. Aerial photographs taken between 1940 and 1963 are shown below as Figures 6-9.10
These can be compared to a more updated 2005 aerial photograph shown as Figure 10.11 Ten
years following the completion of Vasby’s Ditch, an accident at a Lakehead Pipeline facility
caused the release of an estimated 250,000 gallons of crude oil. The oil spill entered the inlet
creek upstream of Highway A, but was contained and cleaned up before it could reach Lake
Ripley.

A municipal sewer system was installed around the lake by 1984. The sewer system replaced
private septic fields and permitted wastewater to be treated and discharged outside the lake’s
natural drainage basin. In 1986, Lake Ripley became one of 50 lakes in the State to be selected
by the Wisconsin Department of Natural Resources for long-term trends monitoring. Just three
years later, the growth of Eurasian watermilfoil—a non-native, invasive lake weed—exploded
and blanketed 40% of the lake surface with thick mats of vegetation. This prompted property
owners to organize for the purpose of purchasing and operating mechanical weed-harvesting
equipment to help manage the prolific weed growth.

By late 1990, property owners responded to the Eurasian watermilfoil crisis and continued water
quality concerns by petitioning Jefferson County to organize as an Inland Lake Protection and
Rehabilitation District under Chapter 33 of the Wisconsin Statutes. The Lake Ripley
Management District formed and began operations the following year. An abbreviated summary
of major Lake District activities and achievements is presented in Table 1.

10
     Aerial photographs copied from the Arthur H. Robinson Map Library, University of Wisconsin-Madison
11
     Digital aerial photograph from the Jefferson County Land Information Office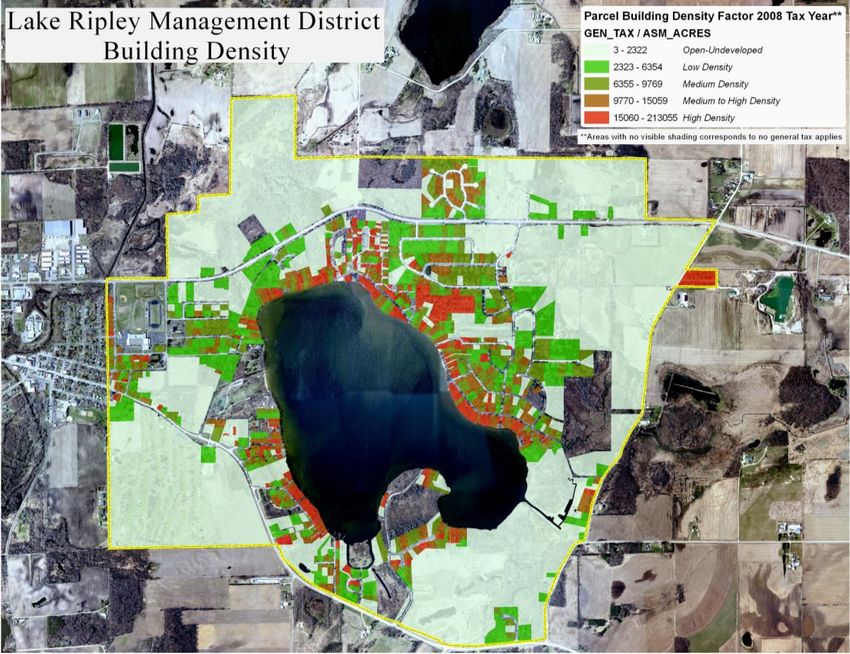
Figure 4: 1940 Aerial Photograph of Lake Ripley

Figure 5: 1950 Aerial Photograph of Lake Ripley

Figure 6: 1957 Aerial Photograph of Lake Ripley

Figure 7: 1963 Aerial Photograph of Lake Ripley
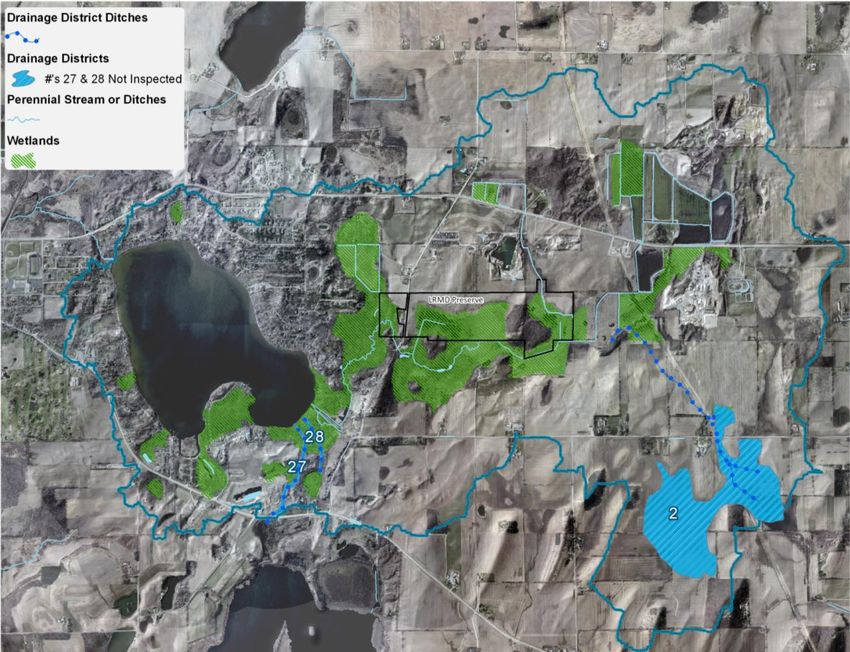
Figure 8: 2005 Aerial Photograph of Lake Ripley

Table 1: Lake Ripley Management District retrospective (1991-2009).

Date Major Events

1991 The Lake District takes over weed-harvesting operations. Town ordinance establishes
     slow-no-wake zones in both bays, and a 7:30 p.m. to 11:00 a.m. daily no-wake period. A
     $10,000 grant pays for the extraction and analysis of a sediment core to assess past water
     quality conditions in the lake. The study documents dramatic declines in water quality
     following periods of large-scale wetland drainage and watershed development.

1992 The lake’s first aquatic plant management plan is prepared to guide weed-harvesting
     efforts. The Lake District conducts its first landowner opinion survey to assess local
     demographics and perceptions relating to a variety of lake-related topics. The first “carp-
     a-thon” event is hosted in an effort to reduce the carp population.

1993 Lake Ripley is granted “Priority Lake” status by the Wisconsin DNR, and is declared an
     outstanding natural resource needing protection and long-term management. As a result,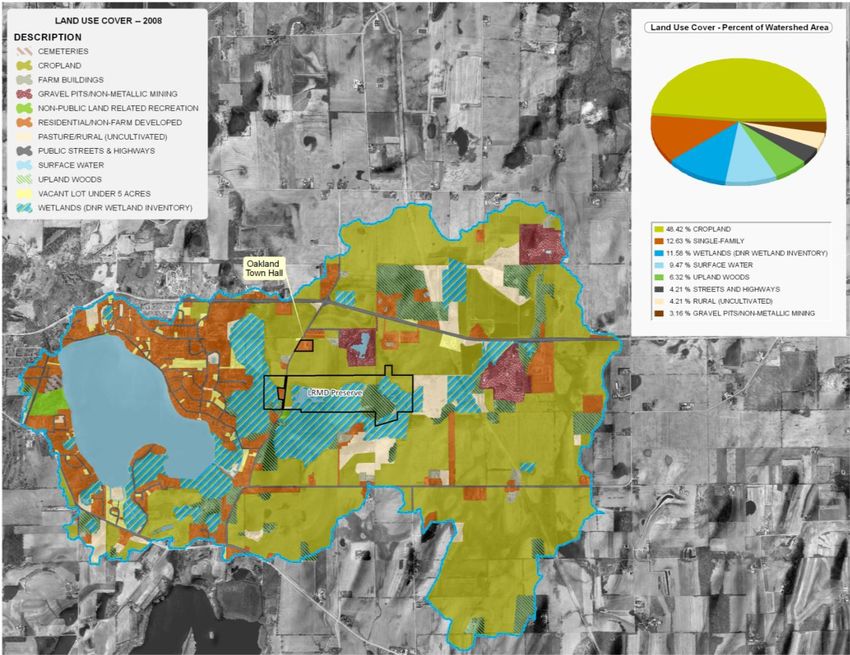
nearly $1 million in Priority Watershed Project grants are earmarked through 2006. The
       money is used to hire a project manager, develop a nonpoint source pollution control
       plan, pay for community outreach, and provide landowner cost-share incentives to control
       soil erosion and sources of polluted runoff. The Ripples newsletter gets its debut, and a
       service-learning partnership is initiated with Cambridge High School.

1994 The use of “bioengineering” to control shoreline erosion is pioneered on Lake Ripley. A
     $90,000 grant is used to help renovate the public boat landing. Another $31,000 grant is
     used to purchase a new weed harvester. A Water Resources Appraisal is completed to
     characterize water quality conditions and offer management guidance. 426 feet of
     eroding shoreline is repaired.

1995 A Nonpoint Source Pollution Abatement Plan is completed. The Lake District receives
     an Outstanding Lake Stewardship Award from the Wisconsin DNR, UW Extension, and
     Wisconsin Association of Lakes. Town ordinance establishes controls on the placement
     of new piers in designated “sensitive areas.” Another Town ordinance prohibits the use
     of motors in Vasby’s Channel to protect fish-spawning habitat. Wetland and natural
     shoreline areas on the lake’s south shore are put into conservancy as a result of a Lake
     District lawsuit brought against the developer. 120 feet of eroding shoreline is repaired.

1996 A boater opinion survey gauges public attitudes toward existing boating rules. A $2,000
     grant pays for water testing supplies. 399 feet of eroding shoreline is repaired.

1997 A Town ordinance is adopted that regulates the burning of yard waste near the lake,
     primarily to keep phosphorus-rich ash from washing into the water. A $120,000 grant
     and $47,000 in donations are used to purchase the original 99-acre Lake District Preserve.
     505 feet of eroding shoreline is repaired.

1998 Wetland-restoration projects and public-access improvements begin at the Lake District
     Preserve. An all-volunteer “Lake Watch” program is launched to monitor lake use and
     report observed boating violations. 335 feet of eroding shoreline and 2,950 feet of
     eroding ditch banks are repaired.

1999 A $1,800 grant is used to plug a drainage ditch at the Lake District Preserve. An $8,560
     grant goes toward developing Lake Ripley’s first comprehensive lake-management plan.
     Public opinion surveys and hearings are used to gather input on the lake’s condition, use,
     and management priorities. The first annual community litter cleanup is co-hosted with
     Cambridge High School. 110 feet of eroding shoreline and 5,800 feet of eroding ditch
     banks are repaired.

2000 The Lake District establishes an online presence with a new Website. A two-year
     partnership with Jefferson County seeks to evaluate the present condition and
     management needs of the county’s lakes. 100 feet of eroding shoreline and 3,500 feet of
     eroding ditch banks are repaired.

2001 A $10,000 grant helps fund an updated aquatic plant inventory and management plan.
     Town ordinance prohibits the feeding of geese to help control nuisance populations. 379
     feet of eroding shoreline and 2,550 feet of eroding ditch banks are repaired.
2002 A $2,200 grant is used to plug a 7,400-ft. drainage ditch and restore 20 acres of wetlands
at the Lake District Preserve. In order to perform the ditch closure, an additional two
acres were added to the Lake District Preserve through condemnation procedures. 561
feet of eroding shoreline is repaired.
2003 Special deed restrictions are negotiated with a lakefront developer to protect threatened
wetlands and natural shoreline areas in South Bay. A watercraft census and recreational
carrying capacity analysis shows that boat traffic regularly exceeds safe and responsible
levels during times of peak use. An annual inventory of piers, boatlifts, watercraft, and
shoreline conditions is initiated. 436 feet of eroding shoreline is repaired.
2004 A $3,500 grant is used to research the impacts of piers on near-shore aquatic life. The
study shows that oversized piers negatively alter aquatic plant communities and fish
habitat on Lake Ripley due to excessive shading. A $1,500 grant is obtained to install a
3,200-square-foot rain garden at the Oakland Town Hall. The Lake District partners with
Jefferson County to strengthen shoreland zoning rules governing the clearing of trees and
other shoreline vegetation. 295 feet of eroding shoreline and 2,800 feet of eroding ditch
banks are repaired.
2005 Town ordinance increases public boat-launching fees, expands no-wake zones to within
200 feet of shore, and prohibits future keyhole developments to address lake-crowding
concerns. Zebra mussels are first discovered in the lake. A $1,000 grant is awarded to
increase public awareness about aquatic invasive species. A property owner opinion
survey helps gauge attitudes about the condition, use and management of the lake.
$15,300 in additional landowner cost-share funding is obtained from the state. 902 feet
of eroding shoreline is repaired.
2006 The Lake Ripley E-Bulletin is initiated for the purpose of disseminating time-sensitive
news and announcements. Virtual tours of the Lake Ripley shoreline and Lake District
Preserve are produced for local cable television. The Lake District partners with UW-
Madison to design and implement a community-based social marketing program to
promote the building of rain gardens. John Molinaro, District Chair, receives the
Wisconsin Lake Stewardship Award from the Wisconsin DNR, UW Extension and
Wisconsin Association of Lakes. 927 feet of eroding shoreline is repaired.
2007 The grant-funded Priority Lake Project ends after 13 years. From 1993-2006, over $1
million dollars in grants were received, and an estimated sediment-load reduction of
2,100 tons/year is achieved. $20,000 in grants are obtained to perform a second
sediment-core analysis, and to update existing lake and watershed management plans.
Another property owner opinion survey is conducted. Town ordinance establishes an
emergency no-wake policy during high-water conditions. 130 feet of eroding shoreline
and 3.2 acres of wetland are restored.
2008 A $200,000 grant and over $43,000 in donations are obtained to help enlarge the Lake
District Preserve by 66 acres, to a total of 167 acres. Another $6,500 is raised to
successfully challenge an increase in the floodplain elevation around Lake Ripley. 158
feet of eroding shoreline is repaired.2009 $78,000 in additional grants help pay for the 66-acre Lake District Preserve acquisition
and related restoration work. An updated, comprehensive management plan is finalized
and published. A sediment-core analysis shows significant improvements in water
quality, watershed erosion, and lake-sedimentation rates since 1990. Prior Lake District
advocacy efforts lead to statewide restrictions on the sale and use of phosphorus lawn
fertilizers. 492 feet of eroding shoreline is repaired, and another 1,430 feet is currently
progressing toward completion.
2-3 OVERVIEW OF RESOURCE CHARACTERISTICS
Lake Ripley is a natural, glacial kettle lake that formed approximately 12,000 years ago during
the retreat of the last ice age. About a seven-square-mile watershed, as delineated from the
lake’s outlet, delivers surface water to the lake, predominantly as stream drainage. The lake, in
turn, outflows to Koshkonong Creek and is part of the Lower Rock River and Upper Mississippi
River Drainage Basins. Lake Ripley is classified as a drainage lake since it is fed by stream
flow, groundwater, precipitation and runoff and is
drained by a stream. Drainage lakes tend to be high in
nutrients compared to other lake types, and their water
quality is largely determined by watershed conditions.
The condition of Lake Ripley is ultimately determined
by a combination of anthropogenic, climatic,
hydrologic, geomorphic, and in-lake (physical,
biological, chemical) factors. All of these forces act
in concert to influence lake health. An abbreviated
summary of these defining factors is provided in
Table 2 below, and then described in greater detail in All lakes are products of the hydrologic cycle (or the means by which
water enters and leaves the system) as represented in the above
the sections that follow. illustration. Source: UW-ExtensionTable 2: Summary of lake and watershed characteristics
PHYSICAL AND HYDROLOGIC DESCRIPTORS
Lake type (origin) Natural, glacial kettle lake
Lake type (hydrologic) Drainage lake with one perennial inlet and outlet
Main water source Stream flow
Landscape position and hydrologic- Class I headwater lake that is not connected to upstream
connectivity classification water bodies
Regional drainage basins Part of the Lower Rock River and Upper Mississippi
Drainage Basins
Lake surface area 423.3 acres (main body); 1.7 acres (Vasby’s ditch); 2.5
acres (dredged inlet channel)12
Watershed area 4,688 acres (7.3 square miles)13
Watershed-to-lake area ratio 11:1
Shoreline length 4.1 miles (main body)14; 0.57 mile (Vasby’s ditch); 0.95
(dredged inlet)
Time of concentration 11.14 hours (maximum travel time for water particle to
reach the lake from furthest reaches of watershed)15
100-yr. floodplain elevation 837.99 ft. above mean sea level16
Ordinary High Water Mark 836.5 ft. above mean sea level17
(OHWM)
Average lake-surface elevation 835 ft. above mean sea level18 (variable)
Max. lake depth 44 ft.
Mean depth 18 ft.
Surface area < 3 ft. deep 11%
Surface area < 5 ft. deep 36%
Surface area < 10 ft. deep 48%
Surface area > 20 ft. deep 40%
Lake volume 7,561 acre-feet19
Water residence time 2.85 years (amount of time water resides in the lake before
it is flushed out and replaced with new water)20
12
Delineation by Jefferson County Land & Water Conservation Department using 2005 aerial photograph
13
Jefferson County LIDAR Project using 2005-derived Digital Elevation Model (ESRI Spatial Analyst
Watershed Tools: http://webhelp.esri.com/arcgisdesktop/9.3/index.cfm?TopicName=GP_Service_step-
by-step%3A_Watershed)
14
Ibid
15
Montgomery Associates Resource Solutions, LLC. 2008. Floodplain Delineation Report for Lake
Ripley, Jefferson County, Wisconsin. Computed using WinTR-55.
16
Ibid
17
2002 OHWM determination by Wisconsin Department of Natural Resources relating to platting of
Majestic Pines Subdivision
18
U.S. Geological Survey. 1971 (photorevised), 1976 (photoinspected). Lake Mills, WI SW/4 Waterloo
15’ Quadrangle.
19
Wisconsin Department of Natural Resources. 1970. Lake Survey Map.Inlet flow 5 cubic ft/sec (1993 annual mean); 1.6-8.8 cubic ft/sec
(1993 annual range)21
Outlet flow 9 cubic ft/sec (1993 annual mean); 4.5-23.2 cubic ft/sec
(1993 annual range)22
Groundwater component of 30%23
hydrologic budget
Surface/groundwater flow direction Generally east to west
Shore development factor 1.7 (circularity of lake shape, with 1 being a perfect circle)
Inlet stream length 4.25 miles (2.5 miles in 1907, prior to drainage ditching)
Lake fetch 1.3 miles
Lake-bottom substrates 45% organic silt, 35% sand, 20% gravel24
Thermal properties of water column Dimictic (summer stratification with spring and fall lake-
wide mixing)
Summer stratification period June to September
Anoxic zone > 20 ft. during summer stratification
Ice-cover period 97 days (1989-2009 average)
Watershed topography Mostly flat to gently rolling
Watershed geology and soils Lake is part of an extensive glacial outwash plain and
terrace system; watershed soil types are primarily silt
loam; common soil associations are Houghton-Adrian and
Fox-Casco-Matherton25
Watershed land uses 48.4% (2,270 acres) cropland; 12.6% (592 acres)
residential; 11.6% (543 acres) wetlands; 9.5% (444 acres)
surface water; 6.3% (296 acres) upland woods; 4.2% (197
acres) streets; 4.2% (197 acres) rural uncultivated; and
3.2% (148 acres) gravel pits26
Watershed impervious cover 11%27
Wetland acreage 543 acres (originally 1,500 acres according to a 1908
USGS inventory); about 25% of shoreline still supports
wetlands28
20
Estimated using Wisconsin Lake Modeling Suite (WiLMS), Version 3.3.18.1
21
Wisconsin Department of Natural Resources, and Lake Ripley Management District. 1994. Lake
Ripley Water Resources Appraisal.
22
Ibid
23
Wisconsin Department of Natural Resources, Wisconsin Department of Agriculture, Trade and
Consumer Protection, Lake Ripley Management District, and Jefferson County Land Conservation
Department. 1998. Nonpoint Source Control Plan for the Lake Ripley Priority Lake Project. Wisconsin
Nonpoint Source Water Pollution Abatement Program. Publication WT-512-98.
24
Burris, John E. 1971. A Study of Man’s Effects on Lake Ripley. University of Wisconsin-Madison.
Zoology 518 Report.
25
U.S. Department of Agriculture. 1979. Soil Survey of Jefferson County.
26
Jefferson County Land and Water Conservation Department. 2008 Land Use Cover Maps.
27
Information generated by Jefferson County Land & Water Conservation Department using 2008 land-
use data and the Monroe County of Indiana methodology for Impervious Cover Coefficient distinction
28
Wisconsin Department of Natural Resources. 1986. Wisconsin Wetlands Inventory.BIOLOGICAL AND CHEMICAL DESCRIPTORS
Watershed ecoregion Southeastern Wisconsin Savannah and Till Plain29
Lake type (chemical) Marl (high in calcium carbonate)
Lake trophic status Meso-eutrophic
Average summer water quality indices Total phosphorus (“good”); chlorophyll-a (“good”);
water clarity (“fair”)
Mean summer total phosphorus 20.3 µg/L
(surface)
Mean summer total phosphorus 70.0 µg/L
(bottom)
Mean summer chlorophyll-a 8.6 µg/L
Mean Secchi clarity 6.0 ft.
Limiting nutrient for algal growth Phosphorus
Nitrogen-to-phosphorus ratio >27:130
Phosphorus-loading sources Row crops (70.3%), urban/residential (17.4%), pasture/
mixed agriculture (5.5%), atmospheric deposition
(4.1%), wetland (1.8%), forest (0.8%)31
Sensitivity of lake to changes in Low
nutrient load
Sediment loading sources Eroding ditches (75%), shorelines (7%), construction
(Pre-1998 estimate) sites (13%), cropland (4%), existing urban (1%)32
Mean sedimentation rate 0.7 g cm-2 yr-1 (based on sediment-core findings)33
Alkalinity High (160-260 mg/L CaCO3)
Average pH High (8.5)
Acidification sensitivity Low
Max. plant-rooting depth ~12-15 ft.
Total fish species 39 species documented since mid-1970s
Winterkill sensitivity Low (due to water depth and volume)
Aquatic plant species documented 31 species34
Aquatic invasive species Common carp (Cyprinus carpio); Eurasian watermilfoil
(Myriophyllum spicatum); curly-leaf pondweed
(Potamogeton crispus); zebra mussel (Dreissena
polymorpha)
29
Omernik, J.M. 1987. Ecoregions of the Conterminous United States.
30
Wisconsin Department of Natural Resources, and Lake Ripley Management District. 1994. Lake
Ripley Water Resources Appraisal.
31
Analysis using Wisconsin Lake Modeling Suite (WiLMS), Version 3.3.18.1
32
Wisconsin Department of Natural Resources, Wisconsin Department of Agriculture, Trade and
Consumer Protection, Lake Ripley Management District, and Jefferson County Land Conservation
Department. 1998. Nonpoint Source Control Plan for the Lake Ripley Priority Lake Project. Wisconsin
Nonpoint Source Water Pollution Abatement Program. Publication WT-512-98.
33
Garrison, Paul J. and Robert Pillsbury. 2009. Paleoecological Study of Lake Ripley, Jefferson County.
Wisconsin Department of Natural Resources, Bureau of Science Services; and University of Wisconsin-
Oshkosh, Department of Biology. PUB-SS-1062 2009.
34
2006 aquatic plant inventory conducted by the Wisconsin Department of Natural ResourcesEndangered and threatened resources WI and Federal Endangered Species: giant carrion
beetle (Nicrophorus americanus); WI Special Concern
Species: least darter (Etheostoma microperca), lake
chubsucker (Erimyzon sucetta), and cuckoo flower
(Cardamine pratensis); WI Threatened Species:
pugnose shiner (Notropis anogenus) and blanding’s
turtle (Emydoidea blandingi)35
LAKE-USE AND DEMOGRAPHIC DESCRIPTORS
Lake access 1 public boat landing with 16 parking spaces; 1 private
marina with boat landing; 1 public fishing/swimming
pier; 1 community park and swim beach
Septic treatment Municipal sewage system that discharges treated waste
water to Koshkonong Creek
Potable water source Groundwater (private wells)
Number of piers 167 piers36
Number of parked boats 482 boats37
Shoreland development 90% of residences located within ¼-mile of the lake
Property owners who are not full-time ~49%38
residents of the Lake District
Lakefront property owners who are ~65%39
not full-time residents
Equalized valuation of Lake Ripley $237,284,21840
Management District (2009)
Lake-use zoning policies 7:30 p.m.-11:00 a.m. daily no-wake period; no-wake
within 200 ft. from shore; no-wake within 100’ of piers,
rafts and buoyed restricted areas; no-wake within
buoyed areas of both bays; no motor use within
Vasby’s Channel
Slow-no-wake and boat-restricted 125 acres
areas
35
Wisconsin Department of Natural Resources, and Lake Ripley Management District. 1994. Lake
Ripley Water Resources Appraisal.
36
2009 visual inventory performed by Lake District staff
37
Ibid
38
Estimated using mailing address information taken from 2008 Jefferson County tax-parcel data
39
Ibid
40
Wisconsin Department of Revenue, Certification of Equalized Value for 20092-4 DEMOGRAPHICS
Lake Ripley is both a popular recreational destination and a
regional driver of economic activity. People have historically
been drawn to its shores to engage in a variety of leisure
activities, including fishing, swimming and boating. The high
density and value of development around the lake is a testament
to the lake’s value and significance as one of the area’s primary
attractions (see Figure 11). Small, summer cottages are
continuing to be converted to year-round residences around the Pontoon boats docked on the north shore of
Lake Ripley.
lake as an increasingly greater share of the population shifts to
full-time residency. Development and lake-use pressure is high on Lake Ripley due to its
proximity to major urban centers, such as Madison (WI), Milwaukee (WI), Chicago (IL) and
Rockford (IL). Population densities vary on both a weekly and seasonal basis, especially near
the lake, with summer weekends attracting the greatest number of visitors.
The Lake Ripley Management District is located next to the Village of Cambridge in the
northwest corner of the Town of Oakland. In 2005, the Town of Oakland (Jefferson County)
supported a mostly rural population of 3,368 people and roughly 1,300 households within its 36-
square-mile boundary. The Village of Cambridge (Dane County) supported a population of
1,187 people. These populations are projected to grow by about 40% over the next 25 years.41
Although the Lake District includes only about 7% of the total land area in the Town of Oakland,
it represents 68% of the Town’s total tax base.42 This fact alone speaks to the lake’s tremendous
regional economic value. It also helps support the case for active stewardship, especially in light
of continued development pressures and related environmental stressors that threaten the quality
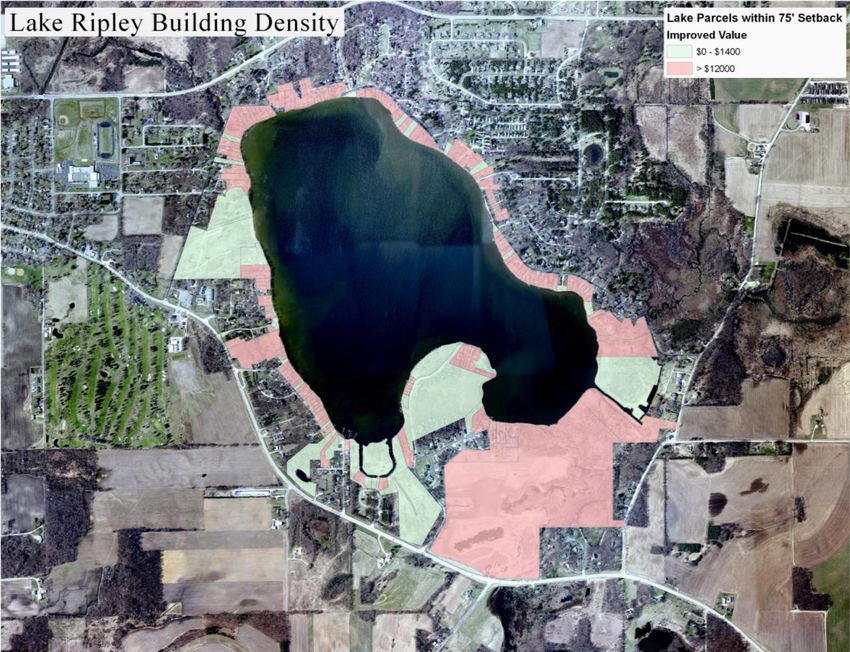
of this important resource. Both “improved” and “unimproved” parcels with actual lake frontage
are shown in Figure 12. The number of buildings and parcels by demographic segment around
the lake are presented in Table 3.43
41
MSA Professional Services, Inc. 2008. Comprehensive Growth Plan for Town of Oakland, Jefferson
County, Wisconsin.
42
Wisconsin Department of Revenue. 2007 property assessment records.
43
Jefferson County Land Information Office. 2005 land-use records.Figure 9: Parcel Building Density in Lake Ripley Management District as Defined by Property Tax-to-Acreage Ratios44 44 Map produced by Gerry Kokkonen, GIS/Land-Use Specialist, Jefferson County Land & Water Conservation Department (2009)
Figure 10: Improved and Unimproved Parcels within Lake Ripley’s 75-ft. Building
Setback45

45
  Map produced by Gerry Kokkonen, GIS/Land-Use Specialist, Jefferson County Land & Water
Conservation Department (2009)
Table 3: Buildings, parcels and property owners around Lake Ripley46

Demographic segment                            Address       Parcels       Part-time
                                               pointsf                     residencyg
Lakefronta                                     160           211           65%
Lake Districtb                                 942           1,269         49%
Watershedc                                     845           1,253         58%
Lake District + Watershedd                     1,023         1,470
½-mile of lakee                                872           1,203
Town of Oakland                                1,401         2,240
a
  = parcels containing land within 75-ft. buffer of lake edge
b
  = parcels within Lake District taxing district
c
  = parcels touching or within Lake Ripley watershed boundaries
d
  = parcels within Lake District boundary plus those containing land within Lake Ripley watershed boundaries
e
  = parcels touching or within half-mile buffer of lake edge
f
  = homes and buildings with associated fire numbers
g
  = estimated based on primary mailing address information listed in 2009 tax-parcel records

A 2007 property owner survey revealed an average respondent age of 57 years old, which was
based on a 23% response rate. The survey also suggested an average household size of 2.8
individuals. Most respondents indicated living within one-quarter mile of the lake, with 37%
owning lakefront property. Full-time residents accounted for 57% of respondents, while the
remaining 43% were seasonal/part-time residents. According to the survey, part-time residency
tended to increase as property ownership moved closer to the lake. Slightly more than half of
those living off the lake claimed to have deeded lake-access rights. Length of property
ownership varied widely, although a majority (58%) owned their property for over a decade.47

2-5       WATERSHED DRAINAGE PATTERNS

Lake Ripley lies at the terminus of a 7.3-square-mile
watershed that drains predominantly agricultural land (see
Figure 13). As a drainage lake, it is primarily fed by
stream flow, as well as groundwater, precipitation and
direct surface runoff. The lake has an outlet that discharges
to Koshkonong Creek, which is a tributary of the Rock
River. Compared to other lake types, drainage lakes are
more affected by surface runoff problems, generally have
shorter residence times, and often require more intensive                 Illustration showing the movement of water through
                                                                          a drainage lake. Source: Wisconsin Lakes
watershed protection to manage water quality.                             Partnership

46
     2009 Jefferson County tax-parcel records
47
     Lake Ripley Management District. 2007. Lake Ripley Property Owner Opinion Survey.
Because Lake Ripley reflects the condition of the surrounding landscape from which it derives surface water, it can be viewed as largely a product of its watershed. Watershed-to-lake surface area ratios are used to estimate the level of influence the surrounding landscape has on water quality. Lake Ripley has a watershed-to-lake surface area ratio of 11:1. Lakes with ratios greater than 10:1 more often experience water quality problems when compared to lakes with smaller ratios. This is especially true in developed watersheds that are dominated by fertile, erodible soils. As watershed area increases in relation to the size of the lake, the greater the potential volume of pollutants entering the lake in the form of surface runoff. This runoff is generated from snowmelt, precipitation and groundwater discharge that does not evaporate or infiltrate into the soil. The actual amount of pollutants, sediment and other material delivered to the lake depends on watershed size, soil types, topography, type of land cover and other factors. Both surface water and regional groundwater generally flow from east to west toward the lake. Figure 14 shows individual subwatersheds and generalized flow paths for surface drainage. Although Lake Ripley is part of the more extensive Lower Rock River and Upper Mississippi Drainage Basins, it is not directly influenced by hydrologic connectivity to other upstream surface waters. However, it is linked to other surface waters from an outlet perspective (via Koshkonong Creek and the Rock River), which may allow fish and other free-swimming aquatic organisms to migrate back and forth between water bodies. Koshkonong Creek is classified as a warm water sport fishery dominated by rough fish. It was returned to a free-flowing stream following the removal of the Rockdale dam in 2001.48 48 Jefferson County Land and Water Conservation Department. 2005. Jefferson County Land and Water Resources Management Plan: 2006-2010.
Figure 11: 2005 Aerial Photograph of Lake Ripley Watershed Shown in Context of
Regional Drainage Basins
Figure 12: Lake Ripley Subwatersheds and Overland Flow Paths49

2-6    WATERSHED GEOLOGY AND SOILS

Glacial features largely control the topography and hydrology in the Lake Ripley Watershed.
Lake Ripley itself is situated in a kettle depression formed by the retreating glaciers about 12,000
years ago.50 The lake is part of an extensive outwash plain that stretches from south of Lake
Ripley to Lake Mills. This area incorporates all the features associated with a stream-built, or
melt-water terrace. Water that was apparently trapped by the kettle moraine to the east and the
terminal moraine to the south formed large areas of shallow lakes that have long since drained
away. As a result, there are extensive areas around Lake Ripley that are low in elevation and
nearly flat in topography. Consequently, wetlands are common throughout the region. A
network of drainage ditches and tile systems have historically been used to convert wetlands into
cropland.

49
   Map produced by Gerry Kokkonen, GIS/Land-Use Specialist, Jefferson County Land & Water
Conservation Department (2009), and based on Jefferson County LIDAR Project using 2005-derived
Digital Elevation Model
50
   Wisconsin Department of Natural Resources. 2002. The State of the Rock River Basin. PUBL #WT-
668-2002.
The watershed predominantly consists of the Fox and St. Charles Silt Loam soil types on 2-6%
slopes, which accounts for 31% (2,013 acres) of the watershed. Houghton Muck (9.5%, 615
acres) and Casco Loam on 6-12% slopes (9%, 585 acres) are also well represented. Table 4 lists
the different soil types found within the Lake Ripley watershed.

Table 4: Type and aerial extent of soils found within the Lake Ripley watershed

                                           Soil Type                                         Acres     % of Total
Fox silt loam, 2 to 6 percent slopes                                                         1085.07     16.75%
St. Charles silt loam, moderately well-drained, gravelly substratum, 2 to 6 percent slopes    928.16     14.33%
Houghton muck                                                                                 615.11       9.49%
Casco loam, 6 to 12 percent slopes, eroded                                                    584.61       9.02%
Wauconda silt loam, 0 to 2 percent slopes                                                     319.59       4.93%
Casco-Rodman complex, 12 to 20 percent slopes, eroded                                         298.86       4.61%
Fox loam, 6 to 12 percent slopes, eroded                                                      278.88       4.30%
Matherton silt loam, 0 to 3 percent slopes                                                    274.73       4.24%
Wacousta silty clay loam                                                                      266.98       4.12%
Boyer sandy loam, 1 to 6 percent slopes                                                       196.20       3.03%
Fox silt loam, 0 to 2 percent slopes                                                          189.37       2.92%
Kidder loam, 6 to 12 percent slopes, eroded                                                   146.81       2.27%
McHenry silt loam, 6 to 12 percent slopes, eroded                                             142.13       2.19%
St. Charles silt loam, moderately well-drained, 0 to 2 percent slopes                         106.78       1.65%
Dodge silt loam, 2 to 6 percent slopes                                                         96.06       1.48%
Moundville loamy sand, 1 to 6 percent slopes                                                   93.39       1.44%
Virgil silt loam, gravelly substratum, 0 to 3 percent slopes                                   91.39       1.41%
Rotamer loam, 12 to 20 percent slopes, eroded                                                  88.80       1.37%
McHenry silt loam, 2 to 6 percent slopes                                                       78.78       1.22%
Grays silt loam, 2 to 6 percent slopes                                                         63.04       0.97%
Lamartine silt loam, 2 to 6 percent slopes                                                     49.25       0.76%
Watseka variant loamy sand, 0 to 3 percent slopes                                              47.41       0.73%
Pits, gravel                                                                                   40.96       0.63%
Wasepi sandy loam, 0 to 3 percent slopes                                                       35.88       0.55%
Palms muck                                                                                     35.06       0.54%
Adrian muck                                                                                    34.94       0.54%
Radford silt loam, 0 to 3 percent slopes                                                       33.56       0.52%
St. Charles silt loam, moderately well-drained, 2 to 6 percent slopes                          31.72       0.49%
Kidder loam, 2 to 6 percent slopes                                                             30.97       0.48%
Kidder loam, 12 to 20 percent slopes, eroded                                                   29.93       0.46%
Sebewa silt loam                                                                               26.37       0.41%
Whalan variant silt loam, 0 to 3 percent slopes                                                19.44       0.30%
Juneau silt loam, 1 to 6 percent slopes                                                        17.42       0.27%
Casco-Rodman complex, 20 to 45 percent slopes                                                  16.49       0.25%
Casco loam, 2 to 6 percent slopes, eroded                                                      13.95       0.22%
Udorthents                                                                                     12.44       0.19%
Tuscola silt loam, 2 to 6 percent slopes                                                        8.96       0.14%
Whalan loam, 2 to 6 percent slopes 8.39 0.13%
Rotamer loam, 20 to 30 percent slopes, eroded 8.08 0.12%
Sisson fine sandy loam, 6 to 12 percent slopes, eroded 7.17 0.11%
Kidder sandy loam, 6 to 12 percent slopes, eroded 7.09 0.11%
Kidder loam, moderately well-drained, 2 to 6 percent slopes 6.41 0.10%
Otter silt loam 5.27 0.08%
Elvers silt loam 3.89 0.06%
Wauconda silt loam, 2 to 6 percent slopes 1.94 0.03%
Gilford sandy loam 0.74 0.01%
Total Acres 6478.47
The most common soil associations found in the watershed are Houghton-Adrian, and Fox-
Casco-Matherton.51 Houghton-Adrian soils are found in the depressions of old glacial lake
basins and stream valleys. They are poorly drained and nearly level, and typically have a black
to dark brown organic layer of about 51 inches in thickness. If adequately drained, these soils
have a fair to good potential to support corn and specialty crops. Wetness is a severe limitation,
making these soils often unsuitable for residential or similar development.
Fox-Casco-Matherton soils are found on outwash plains and terraces, and tend to be well drained
and gently sloping to very steep. The surface layer is typically dark, grayish brown silt loam
about 10 inches in thickness. These soils have fair to good potential to support commonly grown
farm crops. In addition, they have fair to good potential for residential and other urban uses. As
a result of the permeability of the underlying sand and gravel, pollution of groundwater is a
hazard if the soils are used for waste disposal.
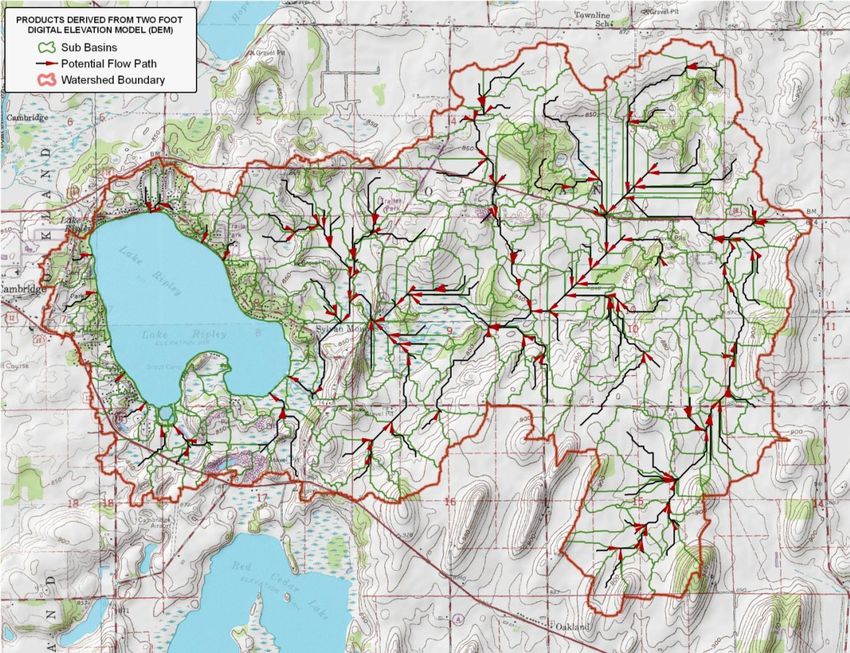
A detailed soils map of the Lake Ripley watershed is shown as Figure 15, with an accompanying
soils legend included on the following page.
51
U.S. Department of Agriculture. 1979. Soil Survey of Jefferson County.Figure 13: Lake Ripley Watershed Soils Map52 (Note: Map legend shown on next page) 52 Map produced by Gerry Kokkonen, GIS/Land-Use Specialist, Jefferson County Land & Water Conservation Department (2009), and based on U.S. Department of Agriculture Soil Survey
Soils
Abbr,   Name
   Ad, Adrian muck
   BpB, Boyer sandy loam, 1 to 6 percent slopes
   CaB2, Casco loam, 2 to 6 percent slopes, eroded
   CaC2, Casco loam, 6 to 12 percent slopes, eroded
   CrD2, Casco-Rodman complex, 12 to 20 percent slopes, eroded
   CrE, Casco-Rodman complex, 20 to 45 percent slopes
   DdB, Dodge silt loam, 2 to 6 percent slopes
   Ev, Elvers silt loam
   FoC2, Fox loam, 6 to 12 percent slopes, eroded
   FsA, Fox silt loam, 0 to 2 percent slopes
   FsB, Fox silt loam, 2 to 6 percent slopes
   Gd, Gilford sandy loam
   GsB, Grays silt loam, 2 to 6 percent slopes
   Ht, Houghton muck
   JuB, Juneau silt loam, 1 to 6 percent slopes
   KeC2, Kidder sandy loam, 6 to 12 percent slopes, eroded
   KfB, Kidder loam, 2 to 6 percent slopes
   KfC2, Kidder loam, 6 to 12 percent slopes, eroded
   KfD2, Kidder loam, 12 to 20 percent slopes, eroded
   KgB, Kidder loam, moderately well-drained, 2 to 6 percent slopes
   LaB, Lamartine silt loam, 2 to 6 percent slopes
   MmA, Matherton silt loam, 0 to 3 percent slopes
   MpB, McHenry silt loam, 2 to 6 percent slopes
   MpC2, McHenry silt loam, 6 to 12 percent slopes, eroded
   MvB, Moundville loamy sand, 1 to 6 percent slopes
   Ot, Otter silt loam
   Pa, Palms muck
   Pg, Pits, gravel
   RaA, Radford silt loam, 0 to 3 percent slopes
   RtD2, Rotamer loam, 12 to 20 percent slopes, eroded
   RtE2, Rotamer loam, 20 to 30 percent slopes, eroded
   SbA, St. Charles silt loam, moderately well-drained, 0 to 2 percent slopes
   SbB, St. Charles silt loam, moderately well-drained, 2 to 6 percent slopes
   SfB, St. Charles silt loam, moderately well-drained, gravelly substratum, 2 to 6 percent slopes
   Sm, Sebewa silt loam
   SoC2, Sisson fine sandy loam, 6 to 12 percent slopes, eroded
   TuB, Tuscola silt loam, 2 to 6 percent slopes
   Ud, Udorthents
   VwA, Virgil silt loam, gravelly substratum, 0 to 3 percent slopes
   Wa, Wacousta silty clay loam
   WmA, Wasepi sandy loam, 0 to 3 percent slopes
   WtA, Watseka variant loamy sand, 0 to 3 percent slopes
   WvA, Wauconda silt loam, 0 to 2 percent slopes
   WvB, Wauconda silt loam, 2 to 6 percent slopes
   WxB, Whalan loam, 2 to 6 percent slopes
   WyA, Whalan variant silt loam, 0 to 3 percent slopes
2-7    WATERSHED LAND USE

CURRENT LAND-USE REPRESENTATION

Agriculture represents the watershed’s dominant land use, with heavy residential development
mostly confined to within about a half-mile radius of the lake’s periphery (see Figure 16). Land-
use cover in the watershed currently consists of 48.42% (2,270 acres) cropland, 12.63% (592
acres) urban/residential, 11.58% (543 acres) wetland, 9.47% (444 acres) surface water, 6.32%
(296 acres) upland woods, 4.21% (197 acres) streets, 4.21% (197 acres) rural uncultivated land,
and 3.16% (148 acres) gravel pits.

PRE- TO POST-SETTLEMENT LANDSCAPE CHANGES

Prior to European settlement, lands draining to the lake were predominantly oak savanna that
supported extensive wetlands. Wetlands and other natural areas in the watershed are considered
critical for providing flood attenuation, pollutant filtration, wildlife habitat, and even spawning
and nursery areas for certain types of fish like northern pike. The native prairies, for example,
were rich in plant diversity with deep-penetrating root systems that greatly enhanced the porosity
of the soil and its ability to infiltrate rainfall (see Figure 17). While there is no empirical data on
pre-settlement infiltration rates in the Lake Ripley watershed, research has demonstrated that
such rates are considerably higher in forests and meadows as compared to farmlands.53 As
infiltration rates decrease, groundwater recharge also decreases and surface runoff increases.

Since European settlement, agricultural and residential development have eliminated most of the
area’s woodlands and prairies, as well as about two-thirds of the original 1,500 acres of wetlands,
mostly through ditching, land filling and drain tiling. Wetlands that still remain continue to be
threatened by polluted runoff, sedimentation, groundwater depletion, and the spread of invasive
species (i.e., buckthorn, reed canary grass, purple loosestrife, and narrow-leaf and hybrid
cattails). In addition, the length of the lake’s inlet tributary stream has been artificially extended
as a result of ditching and channelization. Over the last century, the inlet has increased from 2.5
miles54 to 4.25 miles in length.

Increased stream length and use of drain tiling have resulted in greater surface water runoff,
sediment delivery and nutrient transport to Lake Ripley and area wetlands. In fact, farm
drainage ditches that connect to Lake Ripley’s inlet were all found to be eroding in the mid-
1990s, contributing an estimated 2,654 tons or 75% of the total sediment load to the lake.55 Most

53
   U.S. Soil Conservation Service. 1972. National Engineering Handbook, Section 4: Hydrology.
Washington: U.S. Department of Agriculture, Soil Conservation Service.
   Knox, J.C. 1977. Human impacts on Wisconsin stream channels. Annals of the Association of
American Geographers 67(3):323-342.
   Knox, J.C. and J. Hudson. 1995. Physical and cultural change in the Driftless Area of southwest
Wisconsin. In Geographical Excursions in the Chicago Region, ed. M.P. Conzen, pp. 107-131. Chicago:
Association of American Geographers.
54
   1907 U.S. Geological Survey topographic map
55
   Wisconsin Department of Natural Resources, Wisconsin Department of Agriculture, Trade and
Consumer Protection, Lake Ripley Management District, and Jefferson County Land Conservation
of these inventoried ditches were subsequently either repaired (i.e., Long Sod Farms north of
USH 18) or plugged (i.e., two ditches at the Lake District Preserve) using Priority Lake Project
grants and other funding mechanisms. The stream segment lying between the lake and the mid-
point of the Preserve is considered mainly a sediment-depositional area.

The management of some ditches and drainage routes within the watershed are governed by
drainage districts. The locations of these special districts were determined using engineering
maps supplied to Jefferson County and the Farm Drainage Commission (Figure 18). Two of the
three districts located southeast of the lake are now in residential or otherwise non-agricultural
land use. The other district is located approximately two miles east of the lake and is greater
than 90% underground drain tile that outlets into a well-maintained drainage ditch. None of the
three drainage districts were found to be contributing sediment to Lake Ripley.56

IMPACTS OF DEVELOPMENT AND LAND-USE CHANGE

Development and associated hard surfaces have also decreased the soil’s capacity to infiltrate
rainfall and recharge the groundwater aquifer. Much of the water that once filtered through the
soil and replenished the groundwater supply now runs off of farm fields, transporting sediment
and algae-producing phosphorus into drainage ditches, wetlands and Lake Ripley. This
increased volume of surface drainage has also created a more incised and unstable inlet channel,
diminishing the functionality of adjacent wetlands as natural water quality buffers.

Agricultural runoff is estimated to contribute the greatest volume of phosphorus (in total) to Lake
Ripley. It is estimated that nearly 76% of phosphorus loading originates from agricultural land
uses, and mostly from row-cropped areas.57 However, the lake is also heavily impacted by
residential development around its periphery. These urbanized areas are estimated to contribute
17% of the total phosphorus loads to the lake.58 Since the watershed is of modest size and fairly
flat, the urbanized shorelands right next to the lake are likely to exert a relatively significant
influence on lake condition. In fact, the rate and amount of runoff can increase by a factor of ten
under typical lakeshore-development scenarios. Research has demonstrated that once watershed
development reaches a 10-12% impervious-cover threshold, waterways often experience declines
in certain fish species, among other problems.59 Impervious cover in the Lake Ripley watershed
is currently estimated to be 11% (see Table 5).

Studies also show that largemouth bass nesting success declines and green frogs begin to
disappear along shorelines with housing densities greater than 30 homes per mile.60 Lake Ripley

Department. 1998. Nonpoint Source Control Plan for the Lake Ripley Priority Lake Project. Wisconsin
Nonpoint Source Water Pollution Abatement Program. Publication WT-512-98.
56
   Ibid
57
   2009 analysis using Wisconsin Lake Modeling Suite (WiLMS), Version 3.3.18.1
58
   2009 phosphorus-loading analysis using Wisconsin Lake Modeling Suite (WiLMS), Verison 3.3.18.1
59
   Wang, L., J. Lyons, P. Kanehl, and R. Bannerman. 2001. Impacts of Urbanization on Stream Habitat
and Fish Across Multiple Spatial Scales. Springer Series in Environmental Management, Vol. 28, No. 2,
pp. 255-266.
60
   Meyer, M., J. Woodford, S. Gillum, and T. Daulton. 1997. Shoreland zoning regulations do not
adequately protect wildlife habitat in northern Wisconsin. U.S. Fish and Wildlife Service, State
Partnership Grant P-1-W, Segment 17, Final Report, Madison, Wisconsin.
has already surpassed this particular threshold, with a current lakeshore building density of about
39 lakefront homes per mile (160 lakeshore address points divided by 4.1 shoreline miles). As
housing density increases, the number of littoral treefalls per mile decreases, as does the
abundance of emergent and floating-leaved aquatic plants due to typical shoreline-grooming
practices. According to the Wisconsin Department of Natural Resources, nearly 80% of
Wisconsin’s threatened and endangered plant and animal species spend all or part of their life in
the lake’s littoral and shoreland zones.61 Therefore, development-related habitat alterations and
other near-shore disturbances threaten to cause local extinctions of such sensitive biota.
Preserving natural shoreline vegetation or restoring native, vegetative “buffers” can help
minimize these impacts (see Figure 19).

WATERSHED AREAS CRITICAL TO LAKE HEALTH

A map showing the location of areas critical to watershed health is shown as Figure 20. Areas
classified as “critical” include wetlands, lands supporting hydric soils (indicative of wetland-
supporting conditions), 100-year floodplains, perennially flowing streams and ditches, 10 acres
or more of contiguous forest (important for groundwater recharge and woodland habitat), and
12% or greater slopes (lands most susceptible to erosion). These areas represent a combined
1,519 acres (32% of the watershed), of which 254 acres are identified as being publicly owned
(161 acres), deed restricted (47 acres), or institutionally managed for conservation purposes (46
acres).62 Of the remaining “critical area” acreage, land-use threats are generally greatest to the
north and east of the Lake District Preserve, and around the East Bay wetland complex.
Protecting or restoring the condition of critical areas is important for absorbing and filtering
storm runoff, preserving groundwater recharge, controlling soil erosion, providing fish and
wildlife habitat, and maintaining downstream water quality.

OTHER AREAS OF INTEREST

Farmland parcels in the watershed that are currently enrolled in soil and water conservation
programs are shown on a map in Figure 21. Highlighted parcels include those that were enrolled
in the Farmland Preservation and Conservation Reserve Programs in 2008, and those that have
nutrient management plans on file in Jefferson County. These types of government programs
offer various incentives to participating landowners who implement specific conservation-
farming practices. The map also marks the locations of significant livestock and commercial
operations within the watershed. Livestock operations were identified through a 2009 roadside
survey conducted by the Jefferson County Land and Water Conservation Department, and should
be monitored given their potential of generating water quality challenges (e.g. manure runoff) if
not properly managed. At least one livestock operation that was not mapped (“beef 25-50
animals”) is located between the Oakland Town Hall, a partially reclaimed gravel pit, and the
Lake District Preserve.

   Woodford, J. E., and M. W. Meyer. 2003. Impact of Lakeshore Development on Green Frog
Abundance. Biological Conservaton 110: 277-284.
61
   Wisconsin Department of Natural Resources. 1996. Northern Wisconsin’s Lakes and Shorelands: A
report examining a resource under pressure.
62
   Figures derived by Gerry Kokkonen, GIS/Land-Use Specialist, Jefferson County Land and Water
Conservation Department (2009)
Figure 14: Lake Ripley Watershed Land-Use Cover63

63
  Map produced by Gerry Kokkonen, GIS/Land-Use Specialist, Jefferson County Land & Water
Conservation Department using Jefferson County 2008 Land-Use Inventory data
Figure 15: Rooting Depths of Native Prairie Plants Compared to Turf Grass64

64
     Illustration from U.S. Department of Agriculture’s Natural Resource Conservation Service
Figure 16: Farm Drainage Districts in Relation to Watershed Wetlands, Streams and Ditches65 65 Map produced by Gerry Kokkonen, GIS/Land-Use Specialist, Jefferson County Land & Water Conservation Department (2009), and based on engineering maps on file with Jefferson County and the Farm Drainage Commission
Figure 17: Illustration of Lakeshore Buffer66

66
     Illustration credit: Roxanna Esparza and Steve Adams
Table 5: Estimated impervious cover by land-use type in the Lake Ripley watershed67
TOTAL
% IMPERVIOUS IMPERVIOUS TOTAL
LAND COVER COVER IMPERVIOUS
LAND USE DESCRIPTION ACRES AREA COEFFICIENTa (ACRES) COVER (%)b
CROPLAND 2163.12 46.14 9.25 200.09 38.85
PUBLIC STREETS AND
HIGHWAYS 179.67 3.83 53.40 95.94 18.63
RURAL RESIDENTIAL (>2.5
ACRES) 373.82 7.97 10.60 39.62 7.69
LOW-DENSITY
RESIDENTIAL (0.5-0.99
ACRES) 168.77 3.60 21.20 35.78 6.95
QUARRY/GRAVEL MINE 144.05 3.07 21.20 30.54 5.93
MEDIUM-DENSITY
RESIDENTIAL (0.26-0.49
ACRES) 105.74 2.26 27.80 29.40 5.71
SUBURBAN RESIDENTIAL
(1-2.49 ACRES) 154.31 3.29 14.30 22.07 4.28
HIGH-DENSITY
RESIDENTIAL (0.14-0.25
ACRES) 53.49 1.14 30.00 16.05 3.12
WETLANDS (DNR
WETLAND INVENTORY) 523.73 11.17 1.90 9.95 1.93
URBAN RESIDENTIAL (0.07-
0.139 ACRES) 25.98 0.55 32.60 8.47 1.64
RESIDENTIAL BUSINESS 32.36 0.69 21.20 6.86 1.33
COMMUNICATION AND
UTILITIES 8.07 0.17 72.20 5.83 1.13
UPLAND WOODS 286.50 6.11 1.90 5.44 1.06
NON-PUBLIC GOLF
COURSES, GUN CLUBS 24.16 0.52 12.50 3.02 0.59
LIMITED BUSINESS 4.46 0.10 44.40 1.98 0.38
MUNICIPAL FACILITIES 4.70 0.10 35.40 1.67 0.32
MULTIFAMILY LOW RISE
(1-3 STORIES) 7.24 0.15 21.20 1.54 0.30
CEMETERIES 7.29 0.16 8.30 0.60 0.12
LIMITED COMMERCIAL 0.31 0.01 44.40 0.14 0.03
MULTIFAMILY LOW RISE
(1-3 STORIES) 0.11 0.00 44.40 0.05 0.01
SURFACE WATER 420.10 8.96 0.00 0.00 0.00
TOTALS: 4687.99 100% --- 515.03 100%
Total estimated percent impervious cover in watershed: 11%
a
= factor by which a specific land-use acreage is multiplied to arrive at an estimated acres of impervious cover
(higher values suggest greater amounts of impervious cover per unit of area)
b
= percentage of total watershed impervious cover represented by the specific land-use category
67
Information generated by Jefferson County Land & Water Conservation Department using 2008 land-
use data and the Monroe County of Indiana methodology for Impervious Cover Coefficient distinctionFigure 18: Lake Ripley Watershed Critical Areas68 68 Map prepared by Gerry Kokkonen, GIS/Land-Use Specialist, Jefferson County Land & Water Conservation Department (2009)
Figure 19: Livestock and Commercial Operations, and Farmland Enrolled in Soil and
Water Conservation Programs69

2-8    GROUNDWATER

ROLE OF GROUNDWATER

Groundwater and surface water are interconnected and should not be viewed in isolation. Lake
Ripley’s groundwatershed, while not precisely delineated, is another factor influencing its status.
A groundwatershed is an underground drainage area. Just as surface water flows over the surface
of the land in response to gravity, groundwater flows much more slowly through permeable soils
and fractures in bedrock in response to gravity.

69
  Map produced by Gerry Kokkonen, GIS/Land-Use Specialist, Jefferson County Land & Water
Conservation Department (2009)
You can also read