Phase 2: Cost Analysis - Value-Added Agribusiness Strategy - Prepared for: Saskatoon Regional Economic Development Authority - SREDA
←
→
Page content transcription
If your browser does not render page correctly, please read the page content below

Value-Added Agribusiness Strategy

                    Phase 2: Cost Analysis

Prepared for: Saskatoon Regional Economic Development Authority
DISCLAIMER

This report has been prepared by Wallace Insights in association with Nobilitas Consulting for the benefit of our client,
Saskatoon Regional Economic Development Authority (SREDA). The information contained herein including any analyses,
conclusions and recommendations represent our professional judgement in light of the information available at the time of
the report’s preparation. This report may be used only by the Client, their employees and assigns without written permission.

Issued for distribution on February 25, 2020.

Prepared by:

Wallace Insights
130 Le May Crescent
Saskatoon, SK, Canada S7S 1K9
Tel: (306) 291-7024

Project Number: W20-006

in association with

Nobilitas Consulting
810 Bellmont Crescent,
Saskatoon, Saskatchewan,
Tel: (306) 260 3112
hemant@nobilitasconsultinginc.ca

graphical assistance from

Acknowledgements
SREDA wishes to extend a special thank-you to the following who provided valuable information towards the production
of this cost analysis.

    x   Michael McMurray, Manager, Customer Facility Requests, TransGas Limited
    x   Randy Avery, Director, Customer Growth & Engagement, SaskWater
    x   Gwynn Morris, Account Manager, Key Accounts, SaskPower
    x   Madison Zablocki, University of Saskatchewan, Regional and Urban Planning, Planning 413 Practicum Student
    x   Galen Heinrichs, Regional Infrastructure Services, Technical Services, City of Saskatoon
Table of Contents

1.0 INTRODUCTION ..................................................................................................................... 1
2.0 PROJECT RIBBON OVERVIEW.................................................................................................... 2
3.0 IMPORTANT TAKEAWAYS FROM PHASE ONE ................................................................................ 4
      3.1 What Municipalities Would Like to Know..................................................................................................................................4
      3.2 Specific Engagement with Major Utilities..................................................................................................................................5
4.0 SERVICE LEVELS AND COMPETING AGRIBUSINESS PARKS IN WESTERN CANADA ..................................... 6
      4.1 Competing Agribusiness Park Locations in Western Canada .....................................................................................................6
5.0 COST ANALYSIS – SERVICING SCENARIOS – SASKATOON REGION ..................................................... 14
      5.1 Node 1 – RM of Corman Park No. 344......................................................................................................................................15
      5.2 Node 2 – RM of Vanscoy No. 345 .............................................................................................................................................18
      5.3 Node 3 – RM of Blucher No. 343...............................................................................................................................................21
      5.4 Water........................................................................................................................................................................................24
      5.5 Wastewater ..............................................................................................................................................................................25
6.0 SAMPLE LAND USE AND ZONING REGULATIONS .......................................................................... 29
      6.1 Official Community Plan ...........................................................................................................................................................29
      6.2 Sample Zoning Regulations ......................................................................................................................................................30
7.0 SUMMARY ........................................................................................................................ 31
8.0 REFERENCES
9.0 APPENDICES
1.0 Introduction
This report forms the second phase of a larger strategy (Project Ribbon) by the Saskatoon Regional Economic Development
Authority (SREDA) to elevate the level of preparedness and attract more value-added agribusiness industries to the
Saskatoon Region. The first phase of Project Ribbon involved an investigation into the challenges facing the Saskatoon
Region in attracting more agribusiness industry. Phase One also identified leading locations which are more prepared to
support the development of a new high-capacity agribusiness park.
  Figure 1: Final MCLDA (Aerial Overlay)
                                                                        Based on the analysis results in Phase One, three
                                                                        areas emerged within the Saskatoon Region which
                                                                        had higher levels of ‘preparedness’. The analysis
                                                                        yielded three general locations where the potential
                                                                        for the formation of a high-capacity agribusiness
                                                                        park is highest, shown in Figure 1.

                                                                        It is important to note the nature of high-capacity
                                                                        industrial parks did not appear to be suitable within
                                                                        cities. Given the high quantities of potable and non-
                                                                        potable water, very large land parcels required and
                                                                        cost of wastewater treatment, cities would have a
                                                                        difficult time providing these attributes and
                                                                        remaining cost competitive with other locations.
                                                                        This is not to say that high-capacity industrial parks
                                                                        could not be located within cities, but that
                                                                        significant reductions in costs would need to be
                                                                        provided to be competitive.

                                                                        Throughout the Phase Two study period, it became
                                                                        clear that the environment for developing a new
                                                                        agribusiness park is competitive in Western
                                                                        Canada. Very few jurisdictions did not list
                                                                        agribusiness attraction as a top priority within their
                                                                        strategic plans for economic development.
                                                                        Saskatoon will need to highlight its inherent
                                                                        advantages and look for ways to stand out amongst
                                                                        a crowded field of competitors.

                                                                        Fortunately, the prospects for growth are very high
                                                                        as the world searches for sustainable sources of
                                                                        food to feed a growing population. According to
Protein Industries Canada (PIC) CEO, Bill Greuel, JP Morgan recently estimated the global plant-based protein market will
reach $100 billion by 2035, and that is only 7% of the estimated global protein market. Saskatoon and area offer room to
grow this industry in the very heart of Canada’s pulse crop production region, offering excellent infrastructure, labour and
transportation networks.

              …the environment for developing a new agribusiness park is competitive in Western Canada.
               Saskatoon will need to highlight its inherent advantages and look for ways to stand out…

                                                                                                                     Page | 1
2.0 Project Ribbon Overview
SREDA and key stakeholders within the Saskatoon Region recognize the importance of the growing agri-food industry.
PIC was recently approved as one of five ‘superclusters’ in Canada and is set to receive $153 Million in matched federal
funding for the agribusiness supercluster. It is expected that this funding will be used to attract $250M in private investment
and a further $150M in venture capital to position Saskatchewan as a food processing, food technology venture capital
centre. While the PIC head office will be in Regina, it is expected that the supercluster funding will generate demand for
several agribusiness processing plants in Saskatchewan. Overall, the agribusiness sector is projected to contribute $10B to
$15B to Canada’s economy.

         “Value-added production is one of the most important economic drivers for the growth of
         Saskatchewan’s economy over the next decade.”
                                                              - Plan for Growth, Government of Saskatchewan

The Saskatchewan Growth Plan: the Next Decade of Growth 2020-2030, released November 2019, calls for a doubling of
current economic revenue from agribusiness activity by 2030, denoted in Table 1.

           Table 1: Saskatchewan Growth Plan, Revenue from Agribusiness
                                   Number of Agribusiness
                  Year                                           Agriculture Value-Added Revenue
                                         Companies
                  2000                       160                              $1.8B
                  2020                       300                              $4.3B
              2030 (goal)                                                      $10B

This Growth Plan also indicates that the Province wants to process 50% of the pulse crops produced in Saskatchewan. To
help reach this goal, the Province plans to invest more than $70 Million by 2030 to support new investment,
commercialize new technologies and enhance competitiveness. It appears therefore that the timing of SREDA’s Project
Ribbon Phase Two report is well positioned to assist the provincial government to capitalize on its 2030 growth plan
target. Location and preparedness will be the keys to success.

In 2016, SREDA embarked on an ‘Agri-Business Attraction Strategy’ (Project Ribbon) with the goal of making the
Saskatoon Region more competitive and attractive to agribusiness industries. The strategy has three phases:

                   Phase 1:
                 Agribusiness                                                                  Phase 3:
                                                          Phase 2:
               Forum, Emerging                                                            Business Attraction
              Themes & Location                         Cost Analysis
                                                                                            & Marketing
                   Analysis

Phase One included two components.

    a) An Agribusiness Forum – this led to formation of a ‘Water Supply Working Group’ and a report on the Emerging
       Themes to attract more agribusiness development in the Saskatoon Region.
    b) Location Analysis – Project Ribbon entailed looking at which areas of the Saskatoon Region were more prepared
       to attract Agribusiness development using eight key location factors.

                                                                                                                      Page | 2
Phase Two is a detailed Cost Analysis (the subject of this report). It looks more closely at the costs to bring key utility
services and upgrades to each of the three nodes identified in Phase One. This report is a pre-cursor to marketing, site
selection, procurement, and funding to provide a dedicated location for agribusiness development and prepare the Saskatoon
Region for new development in line with the Saskatchewan Plan for Growth and Statements of Provincial Interest.

This analysis was conducted on the following basis:

    1. The cost analysis needs to be as transferable as possible. Most of the costs in this analysis include relative costs or
       unit costs so that they can be relied on for various locations within each of the three nodes identified in Phase One.

    2. The locations chosen for analysis are only representative and are being used for cost estimation purposes only. They
       do not represent, in any way, a proposal for an agribusiness park at the specific locations chosen.

    3. The cost analysis focusses on mainly off-site (major) infrastructure costs to bring high capacities of water, electricity
       and natural gas to the locations chosen. The cost analysis does not provide costs associated with on-site utility hook-
       ups or direct services within the subdivision itself.

An important note
The cost analysis in this report is reliant on the identification of three (3) ‘representative locations’ for detailed costing to
be undertaken. The sites were not chosen for any other purpose than to provide a location for cost analysis. It should not
be assumed that an agribusiness park or development is proposed or recommended at any of the representative locations.

                                                                                                                        Page | 3
3.0 Important Takeaways from Phase One
The major takeaway from Phase One research was that it is critically important to have a location for agribusiness industries
ready for purchase and servicing solutions ready for development. The best way to attract more agribusinesses to the
Saskatoon Region is to elevate the level of preparedness. In other words, ‘plan for what you want’. This can be done by
focusing on the locational advantages in the Saskatoon Region for establishment of what could be called a new ‘high-
capacity agribusiness park’. There are four main themes which are key to elevating the level of preparedness to attract
agribusiness industry:

    x     Land and Location
    x     Access to Key Utilities
    x     Assistance, Incentives and Community Support
    x     Funding

Industries do comparative shopping and evaluate incentives or advantages between economic regions. Saskatchewan’s main
competitors are Alberta and Manitoba. Industries are looking at Saskatchewan mainly because we grow the largest quantity
of raw materials they need. Manitoba and Alberta lack this competitive advantage but do have other advantages, such as
lower electricity rates (Manitoba), and larger local markets (Alberta), but they also seem to have similar issues to
Saskatchewan in attracting these types of industries.

Large agribusiness companies like to have a range of location choices, but also need to eliminate sites as quickly as possible
and narrow down to a select few in the shortest possible time. Waiting for infrastructure and local bylaws to change is a
definite competitive disadvantage.

                The major takeaway from Phase One was that it is critically important to have a location for
                 agribusiness industries ready for purchase and servicing solutions ready for development.

3.1 What Municipalities Would Like to Know
It was determined in Phase One that municipalities would appreciate more information about a company’s needs in advance.
Once a company arrives in the region to attend a site selection meeting and they make their requirements known, there were
times the community realized that other sites may have better suited the company. A list of prepared, standard questions
was identified to help negate some of these issues.

Receiving information in advance would benefit those municipalities who are asked to source locations for prospective
industries. Large companies need to narrow down choices quickly. A custom solution to accommodate these industries
takes too long.

The following questions were obtained from discussions with officials in Portage la Prairie, Central Plains Region. These
are important to industry and it would benefit municipalities to have answers prepared in advance. Questions include:

    1.    Do you have land set aside, or identified, for agribusiness purposes?
    2.    Do you have a suitable water supply which can accommodate large users of potable water?
    3.    Do you have an area where over-size services can be easily obtained?
    4.    Is the location ready to go from a land use regulation (zoning) standpoint?
    5.    Does the location have easy access to rail and heavy haul highways?
    6.    Does the location have an economical solution for wastewater treatment?
    7.    What are the utility rates for gas, electricity and water and are they competitive?
    8.    Does the municipality offer incentive programs?
    9.    Is there a source of labour close by?
    10.   Are there any main competitors in the area?
                                                                                                                     Page | 4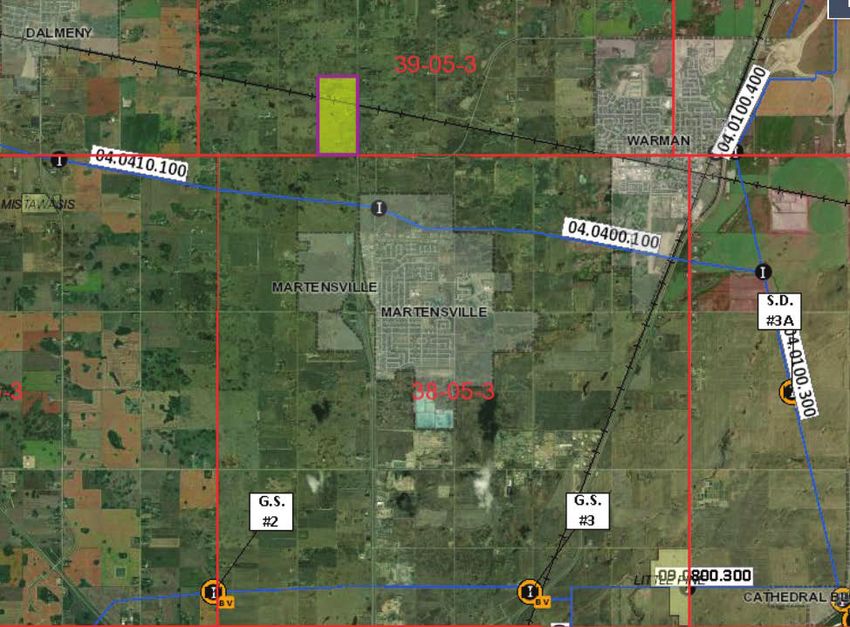
Lack of necessary services within the region is a key issue. Clustering is only an advantage if there are savings available
through shared infrastructure costs.

3.2 Specific Engagement with Major Utilities
Phase One engaged the three major utility companies, SaskPower, TransGas and SaskWater. Below is a brief summary of
the key information gathered from each of these major utilities.

Water
According to SaskWater, potable water is expensive. Generally speaking, it costs four-times (4x) as much to buy potable
water, on a per cubic meter basis, versus non-potable water. If a development can get by with only a small pipeline of
potable water and buy non-potable water, it may make more sense economically. Locations along the river have an obvious
cost advantage. SaskWater will invest in new infrastructure and thereby offset the initial capital cost for industry. The
amount of investment will be determined by the total water demand required and total capital cost of the infrastructure. In
general, the further you are from water the more expensive it gets to provide services for both water and wastewater. Also,
running any water lines through highly populated, or dense areas can be very complicated and expensive.

Pulling water out of the river downstream of the wastewater plant would also create a concern until you get far enough away
that any kind of a spill or the treated effluent is no longer a concern. To an extent, this tends to limit the area directly north
of Saskatoon. More information is needed before a decision could be made regarding drawing water from the river
downstream of the Saskatoon wastewater treatment plant.

The SaskWater pipeline that runs from the south end of Clarence Avenue out to Clavet has available capacity of
approximately 162m3/hour, beyond that it is limited. North of Saskatoon has approximately 403m3/hour available up to
Warman. This capacity may be increased in the near future by another 137m3/hour. Each kilometre of pipeline costs
approximately $325,000 (+/- 30%).

For non-potable water, an intake and pumphouse capable of supplying enough water for a wet pea processing facility
would cost approximately $9M (+/-30%). Pipeline costs vary dependent upon the distance from the pumphouse.

Natural Gas
Pressure is important for gas as much as capacity. An industrial agribusiness park would require a higher pressure of natural
gas than a residential development. Infrastructure network has different lines for different pressures. Block valves are an
important consideration when planning for a potential network expansion. Tying into block valves is much more cost
effective than to a pipeline.

TransGas would be open to a dialogue to expand infrastructure to meet new demand outside the existing network but cost
for new infrastructure is significant.

Electricity
Based on anticipated capacity requirements for industrial agribusiness parks, 138kV service voltage should be considered
as the minimum for customer side analysis and assumptions.

Schedule considerations are important as well as high voltage transmission line design as routing and construction could
take significant time. As an example, a 10 km 138 kV line could take >two years to design, route, and construct. The
further the required service point is from existing transmission infrastructure (lines and stations) the greater the cost. The
more information that can be provided in the service request for the area as a whole will better aid SaskPower in assessing
the immediate and future needs and plan interconnection service and system reinforcement for the area more effectively and
efficiently.

                                                                                                                         Page | 5
4.0 Service Levels and Competing Agribusiness Parks in Western Canada
Not all agribusiness industries or processes are the same or require the same level of service (Table 2). Each agribusiness
process identified below requires a different level of service in terms of electricity, natural gas, water and wastewater
treatment, with wet and conversion processes requiring the highest levels.

          Table 2: Type of Agribusiness Processes
                 Agribusiness                                Description                           Service
                Value-Added                                                                      Requirements
                   Process
             Cleaning and                  This involves the cleaning and packaging of                Light
             Packaging                     products in bulk form and typically does not
                                           involve processing of seeds. In this regard,
                                           cleaning and packaging is not viewed as value-
                                           added processing.
             Dry Processing                Crops are processed using a variety of ‘dry’               Light
                                           techniques such as pressing, milling, screening,
                                           or dehulling to produce a variety of products
                                           such as oils, juices, meal and flour.
             Wet Processing                Wet or liquid processing mainly involves                  Heavy
                                           extraction of products using water, bleaching
                                           agent, steam or an organic solvent. Extracts are
                                           plant oils, protein concentrates, etc. which can
                                           undergo a variety of refining techniques to create
                                           the desired product.
             Product Conversion            Chemical or enzymatic reactions can be used to            Heavy
                                           convert plant raw material into new products
                                           with unique properties. Examples include
                                           production of biodiesel from canola oil or
                                           conversion of starch to ethanol.

Thought needs to be given to the focus of the attraction strategy based on available and cost-effective service levels.

              Not all agribusiness industries or processes are the same or require the same level of service.

4.1 Competing Agribusiness Park Locations in Western Canada
The tables on the following pages show dedicated agribusiness locations and industrial parks located outside of the
Saskatoon Region within Manitoba, Alberta and Saskatchewan. This is being provided as a set of examples to help shape
a marketing strategy for the Saskatoon Region.

                                                                                                                     Page | 6
MANITOBA
                                                                                             Location
Park Name
                                     Parcel          Servicing                              relative to
    &            Land Use                                              Transportation                      Marketing
                                     Sizes         Characteristics                            Large
Municipality
                                                                                             Centres
  Carpere      Industrial        West Park –      Servicing includes   Regional rail       85 kms west    Lowest power
 Industrial    Parks located     161 acres;       water, wastewater,   service from both   of Winnipeg    costs of any
   Parks,      in NW and NE      ranging from 6   power, gas, and      CP and CN. Close                   province in
 Portage la    areas of          to 16 acres.     other municipal      proximity to                       Canada ($3.628
               Portage.          East Park –      facilities.          TransCanada.                       cents/kWh);
  Prairie,
               Serviced for      157 acres;                                                               competitive
 Manitoba      wet industries.   ranging from 8                                                           corporate tax
                                 to 40 acres.                                                             rates and
                                                                                                          incentives
                                                                                                          available.

Location Map

                                                                                                                 Page | 7
Location
Park Name
Servicing relative to
& Land Use Parcel Sizes Transportation Marketing
Characteristics Large
Municipality
Centres
Central Industrial area 30 to 140 acres. Separate water Immediately 85 kms west Nine separate
Plains Inc., just outside system from City. adjacent to of Winnipeg. municipalities
Portage la Portage la Regional system TransCanada formed Central
Prairie, Prairie. with reservoir. Highway. Plains Inc.
Designed with Industrial Central Plains
Manitoba
agribusiness in agreements to promoted their
mind. Large increase capacity of location once
parcels/large City’s wastewater land base
capacity. system. established.
Offers large
volumes of
sewage
treatment at
preferred rates.
Location Map
Page | 8Location
Park Name
Servicing relative to
& Land Use Parcel Sizes Transportation Marketing
Characteristics Large
Municipality
Centres
Dufferin Mainly 53-acre Rural water hookup 12 km from Close Marketing
Industrial agribusiness industrial park. is available. RM of Carman, MB on proximity to information is
Park, RM of companies. 47.9 acres Dufferin is Provincial US border, located on the
Dufferin Another available. responsible for Highway No. 3. and short town of
smaller Base price per water drainage and Potential access to drive to high- Carman’s
(near
industrial park acre: $8,500. maintenance of railroad service. density website. 15
Carman), located in the Businesses can road systems. Carman is located communities, Reasons to Do
Manitoba town. Can combine as Quality on the Central including Business in
accommodate many lots as infrastructure. Manitoba Winnipeg. Carman
a variety of necessary to 3-phase power is Railway line. 80 km includes
agriculture form the supplied by the There is a southwest of ‘Agriculture
services. desired RM. Carman offers Carman-Dufferin Winnipeg, Hub’ and
property size. natural gas Airport that also and 60 km ‘Agriculture
services. Low provides air north of the Research
overhead, low transport for small US border. Centre’ as the
taxes, affordable crafts. first and second
services and eager points listed.
labor force.
Location Map
Page | 9ALBERTA
Location
Park Name
Servicing relative to
& Land Use Parcel Sizes Transportation Marketing
Characteristics Large
Municipality
Centres
Calgary- The area is The total The corridor has a Calgary has one Ideal Leading smart
Olds Smart specifically for corridor is world-class of Canada’s distribution agri-food
Agri-Food Agri-food approx. 100 agriculture busiest airports, hub, as corridor in
Corridor production and km. The area is environment that two class 1 Calgary is Canada.
has a 2,000 spread over two allows for railroads and road within 95kms. Includes the
acre counties, which development, access to North This area is Olds
‘SmartFarm differ scaling and American and located in the SmartFarm.
research drastically, commercialization international CANAMEX Leading
center’ for with parcel needs. Access to markets. Calgary corridor. institute of the
both sizes from the ‘Olds is intersected by government’s
businesses and 4.94-acres to SmartFarm’ the TransCanada ‘Smart Agri-
the College of 80-acre technology and highway and Food
Olds. minimums. research center. Highway 2. Supercluster.’
Location Map
Page | 10Location
Park Name
Servicing relative to
& Land Use Parcel Sizes Transportation Marketing
Characteristics Large
Municipality
Centres
Canada’s 4,470 farms, 4.3 million Irrigation allows Connected by Located in The land has
Premier and over 11 total land acres for 65+ specialty road, rail, and air. both superior
Food thousand spread over crops to be grown Lethbridge irrigation and
Corridor businesses Lethbridge over 906,151 acres County and growing
primarily all County and of irrigated land. Taber county. conditions. The
focused on Taber County. 200 km to area is
agri-business. Both counties Calgary and recognized as a
have parcel size 100 km to hub for
minimums U.S. border. production.
ranging from 1
to 2 acres.
Location Map
Page | 11SASKATCHEWAN
Location
Park Name
Servicing relative to
& Land Use Parcel Sizes Transportation Marketing
Characteristics Large
Municipality
Centres
City of 760 acres of 100 to 120 acre Full urban services Major trucking Within city Promotes an
Moose Jaw dedicated parcels are being extended centre with close limits of ‘advanced
South East industrial land available – in 2019/2020 to access to the Moose Jaw level of
Agribusiness with high- city-owned. service the area TransCanada preparedness’.
capacity water, with water and Highway; 35 85 kilometres Land ready for
Park
sewer, rail. sewer. minutes to GTH; west of development
2-day service to Regina with servicing
Vancouver and cost estimates
Chicago. Major provided.
rail access with
both CN/CP
mainlines, plus
the SOO line to
Chicago.
Location Map
Page | 12Location
Park Name
Servicing relative to
& Land Use Parcel Sizes Transportation Marketing
Characteristics Large
Municipality
Centres
Chuka 150 acres of Various size Sites have access to Close access to Within Regina $385,000 per
Creek serviced options city water, power, Regina Bypass, City Limits. acre. Promote:
Business industrial sites allowing for natural gas, fibre TransCanada x Intermodal
Park, customization. optic, (septic Highway, GTH facility;
sewage installed), Intermodal x Visibility
Regina,
fire hydrants and Facility and x Close
Sask. light standards. Highway 33 proximity to
large city
x Emergency
response
services
Location Map
Page | 135.0 Cost Analysis – Servicing Scenarios
The focus of this report is on cost. The cost of providing the necessary location, land base, servicing and infrastructure
required for a new agribusiness park is included in the following sections. To undertake the cost analysis, one sample
location was chosen from within each of the three leading nodes identified in Phase One. These are shown in Figure 2
below.
Figure 2: Representative Site Locations
Each representative node was chosen based on the following criteria:
x It was located within a hot spot previously identified in the Phase One heat map.
x It contains mainly agricultural land with direct access to a highway.
x Large area which allows for multiple parcels and a range of sizes.
x It has direct access to a railway.
x One location in each of the following Rural Municipalities for analysis:
o RM of Corman Park
o RM of Vanscoy
o RM of Blucher
Page | 145.1 Node 1 – RM of Corman Park No. 344
Situated at the northwest corner of the intersection of Highways 12 and 784 (Figure 3). This area was identified as a hot
spot with a higher level of preparedness relative to other parts of the Saskatoon region. The node is served by a primary
provincial highway (Highway 12) and a secondary highway (Highway 784). The site is also served by the Canadian National
Railway mainline.
Figure 3: Sample Location in RM of Corman Park (Node 1)
Node 1 contains:
1. 304 Gross Acres (298 Net Acres)
2. 2,353 linear metres of roadway
3. 22,750 m2 (5.62 ac.) of roadway area
4. 1,048 linear metres of railway spurline
5. 9 parcels ranging from 12 acres to 62 acres
Page | 15Servicing and Cost
Capacity Required Cost for Node 1 Relative Cost Note
Element
Cost of Land $760,000 - $2,500 to $5,000/per 2020 values from
$1,520,000 acre Hammond Realty
Highway Upgrade (per Km) Primary Access $891,000 $1.1M per kilometre Highway 12 is a
primary highway.
Cost to upgrade Hwy
784 from secondary to
primary from Hwy 12
to 16 (0.81kms)
Primary highways
allow total axle
weights of up to
53,500 kg. Secondary
Highways allow total
axle weight of up to
49,000 kg.
Rail extension Rail Spur $1,904,829 - Cost per linear feet All-in estimates
(link to main line) $2,202,932 (ranges): including:
1,048 metres;
3,438.32 feet. (2015): x Track
$516 - $596/linear ft. x Turnouts
x Switch Points
(2020 est. @2.5% x Powered Turnout
x Warning System
CPI):
$554 - $640/linear ft.
Potable Water Service Peak Demand Flow: Projected 13,400 metres Potable water volumes
50,000 m3/yr. to estimated cost for domestic purposes
75,000 m3/yr. $1,827,000 $95.5/metre – only (i.e. office,
$177/metre bathroom, lunchroom,
etc.) available from 3rd
Average Flow: ($1,279,000 -
party suppliers. Pickup
11.42 m3/hour $2,375,000 class point at Warman Rd
D est. +/-30%) and 60th.
Non-potable Water Peak Demand Flow: Projected 15,500 metres SaskWater -
120 m3/hr. estimated cost Linear piping costs,
(440igal/min) $11,762,000 $527/metre - pumphouses, other
$979/metre infrastructure.
Average Flow: ($8,170,000 -
15.5 km of pipeline to
900,000 m3/yr. $15,174,000 POD from So. Sask.
(102.7 m3/hr.) class D est.) River.
Electricity 138 kv access $7M Source would be the The high initial costs
Martensville may not be sustainable
Switching Station. to these projects,
Transmission line thereby making a
staged expansion an
length is 11kms.
economic necessity.
Relative Cost: This analysis has
$636,364/km. assumed an
interconnection date of
March 2023 and the
commercial operation
Page | 16date as 2025. New
transmission services
can take 3 to 5 years.
Planning ahead is
essential.
Natural Gas Daily Flow: 6,000 – $4.3M – 7.4M In discussions with Tie-in to existing
30,000 Gj/d TransGas it was felt TransGas facilities 12”
Hourly Flow: 6,500 that due to the large pipeline.
– 34,000 m3/hr variance in cost by Odorized regulated
delivery station
Delivery Pressure: location, a relative cost
installed at customer
220 PSIG (1,517 could not be provided. location.
kPa)
Wastewater Treatment Please see comments regarding Wastewater Treatment Costs in Section 5.5.
Municipal $95,850 $10,650/lot (2019) From RM of Corman
Development Levies Park (rates under
review 2021)
Land Use/Zoning $51,705 to Application fee:
Amendments $76,705 $1,525 plus $20/lot,
plus Comprehensive
Development Review
Report (approx.
$50,000 - $75,000)
Subdivision Costs $11,300 $5,000, plus $700/lot x Plan of Proposed
Subdivision
x Plan of Survey
x ISC Registration
x Based on 9 parcels
Municipal Reserve $76,000 5% of raw land value If required. Some
Dedication municipalities do not
require MR money-in-
lieu dedication.
Total Estimated Cost Wastewater estimates
are not included in
$24,539,684 to $36,822,787 this Total. Please see
Section 5.5 for more
details.
Potential Revenue from $400,000/net acre x 298 net acres = $119,200,000 $400,000/acre -
Land Sales current average sale
price of fully serviced
industrial land in
Saskatoon area.
Page | 175.2 Node 2 – RM of Vanscoy No. 345
Situated straddling Highway 7 east of Vanscoy (Figure 4). This area was identified as a hot spot with a higher level of
preparedness relative to other parts of the Saskatoon Region. The node is served by a Primary Provincial Highway (7) and
Chennels Rd. The site is also served by the Canadian National Railway mainline.
Figure 4: Sample Location in RM of Vanscoy (Node 2)
Node 2 contains:
1. 327 Gross Acres (316 Net Acres)
2. 3,035 linear metres of roadway
3. 44,531 m2 (11 ac.) of roadway area
4. 1,059 linear metres of railway spurline
5. 12 parcels ranging from 7 acres to 34 acres
Page | 18Servicing and Cost
Capacity Required Cost for Node 2 Relative Cost Note
Element
Cost of Land $817,500 to $2,500 to $5,000 per 2020 values from
$1,635,000 acre Hammond Realty
Highway Upgrade (per Km) Primary Access $0 $1.1M per kilometre Primary highways
allow total axle
weights of up to
53,500 kg. Secondary
highways allow total
axle weight of up to
49,000 kg.
Subdivision served
entirely by primary
highway.
Rail extension Rail Spur $1,924,823 - Cost per linear feet All-in estimates
(link to main line) $2,226,054 (ranges): including:
1,059 metres;
3,474.41 feet (2015): x Track
$516 - $596/linear ft. x Turnouts
x Switch Points
x Powered Turnout
(2020 est. @2.5%
x Warning System
CPI):
$554 - $640/linear ft.
Potable Water Peak Demand Flow: Projected 15,000 metres Potable water volumes
50,000 m3/yr. to estimated cost for domestic purposes
75,000 m3/yr. $3,020,000 $140.9/metre – only (i.e. office,
$261.7/metre bathroom, lunchroom,
etc.) available from 3rd
Average Flow: ($2,114,000 -
party suppliers. City of
11.42 m3/hour $3,926,000 class Saskatoon supplier,
D est. +/-30%) new pipeline and
booster station.
Non-potable Water Peak Demand Flow: Projected 18,000 metres SaskWater -
120 m3/hr. estimated cost Linear piping costs,
(440igal/min) $6,913,000 $268.8/metre - pumphouses, other
$499.3/metre infrastructure.
Pipeline from QE
Average Flow: ($4,839,000 -
Pumphouse. Pump
900,000 m3/yr. $8,987,000) upgrades required.
(102.7 m3/hr.) class D est.)
Electricity 138 kv access $2.5 M Electricity from The high initial costs
existing transmission may not be sustainable
line. Length would be to these projects,
3kms. thereby making a
staged expansion an
Relative Cost:
economic necessity.
$833,333/km. This analysis has
assumed an
interconnection date of
March 2023 and the
commercial operation
date as 2025
Page | 19Natural Gas Daily Flow: 6,000 – $3.7M to $5.8M In discussions with Tie-in to existing
30,000 Gj/d TransGas it was felt TransGas facilities 12”
Hourly Flow: 6,500 that due to the large pipeline.
– 34,000 m3/hr variance in cost by Odorized regulated
location, a relative delivery station
Delivery Pressure:
cost could not be installed at customer
220 PSIG (1,517 provided. location.
kPa)
Wastewater Treatment Please see comments regarding Wastewater Treatment Costs in Section 5.5.
Municipal $90,000 $7,500 per lot The current levy rates
Development Levies are under review by
the RM. In Phase One,
it was determined that
development levies
may not be applied to
large-scale industrial
subdivisions such as
an agribusiness
industrial park.
Land Use/Zoning $1,200 - $1,600 RM of Vanscoy is not
Amendments an approving authority
for land use changes.
Community Planning
Branch would be
involved in decision.
Application Fee to
amend Official
Community Plan &
Zoning Bylaw $200 -
$600, plus advertising
($1,000)
10 – 12 week process.
Subdivision Costs $13,400 $5,000, plus $700/lot x Plan of Proposed
Subdivision
x Plan of Survey
x ISC Registration
x Based on 12 parcels
Municipal Reserve $58,860 5% of raw land value If required. Some
Dedication municipalities do not
require MR money-in-
lieu dedication.
Total Estimated Cost* Wastewater estimates
are not included in
$16,058,783 to $25,237,914 this Total. Please see
Section 5.5 for more
details.
Potential Revenue from $400,000/net acre x 316 net acres = $126,400,000 $400,000/acre -
Land Sales average sale price of
fully serviced
industrial land in
Saskatoon area.
Page | 205.3 Node 3 – RM of Blucher No. 343 Figure 6: STL Site
The sample site chosen in the RM of Blucher is situated northwest of the
Town of Allan at intersection of Highways 397 and 763 (Figure 5). This area
was identified within a hot spot with a higher level of preparedness relative to
other parts of the Saskatoon region. The node is served by primary provincial
highway (Highway 12) and a secondary highway (Highway 763). The site is
also served by the Canadian National Railway mainline and is located 35
kilometres from the Saskatoon Transportation Link (STL), shown in Figure 6.
STL is a 750-acre privately-owned inland transportation hub with zoning in
place for light and heavy industrial uses. STL has access to three highways
and is located at the confluence of both the CN and CP mainlines providing
excellent access to rail transport.
Figure 5: Sample Location in RM of Blucher (Node 3)
Node 3 contains:
1. 178 Gross Acres (160 Net Acres)
2. 1,832.9 linear metres of roadway
3. 73,316 m2 (18 ac.) of roadway area
4. 697.4 linear metres of railway spurline
5. 8 parcels ranging from 9 acres to 37 acres
Page | 21Servicing and Cost
Capacity Required Cost for Node 3 Relative Cost Note
Element
Cost of Land $445,000 to $2,500 to $5,000 per acre 2020 values from
$890,000 Hammond Realty
Highway Upgrade (per Primary Access $0 $1.1M per kilometre Highway 397 is a
Km) primary highway.
Primary highways
allow total axle
weights of up to
53,500 kg. Secondary
highways allow total
axle weight of up to
49,000 kg.
Rail extension (link to Main Line Access $1,208,695 - Cost per linear feet All-in estimates
main line) $1,396,326 (ranges): including:
665 metres;
2,181.76 feet (2015): x Track
$516 - $596/linear ft. x Turnouts
x Switch Points
x Powered Turnout
(2020 est. @2.5% CPI):
x Warning System
$554 - $640/linear ft.
Potable Water Peak Demand Flow: Projected 7,400 metres 10” Potable water volumes
50,000 m3/yr. to estimated cost 5,550 metres 6” for domestic purposes
75,000 m3/yr. $6,303,000 130 metres 4” only (i.e. office,
______________ bathroom, lunchroom,
etc.). Connection to
Average Flow: ($4,412,000 - 13,080 metres
SaskWater east supply
11.42 m3/hour $8,194,000 class system, a booster
D est. +/-30%) $337.3/metre – station and various
$626.5/metre pipeline sizes.
Clarence Avenue
booster station
upgrade.
Non-potable Water Peak Demand Flow: Projected 7,300 metres SaskWater -
120 m3/hr. estimated cost Linear piping costs,
(440igal/min) $6,958,000 $667.2/metre – pumphouses, other
$1,239/metre infrastructure.
Pipeline from
Average Flow: ($4,870,600 -
Bradwell Reservoir &
900,000 m3/yr. $9,045,400) 7.3km of 8” pipe.
(102.7 m3/hr.) class D est.)
Electricity 230kv (from $4M Electricity from existing The high initial costs
existing service) transmission line. Length may not be sustainable
would be 6kms. to these projects,
Relative Cost: thereby making a
staged expansion an
$666,667/km.
economic necessity.
This analysis has
assumed an
interconnection date of
March 2023 and the
commercial operation
date as 2025
Page | 22Natural Gas Daily Flow: 6,000 – $4.3M to $7.4M In discussions with Tie-in to existing
30,000 Gj/d TransGas it was felt that TransGas facilities.
Hourly Flow: 6,500 due to the large variance in
– 34,000 m3/hr cost by location, a relative Odorized regulated
delivery station
Delivery Pressure: cost could not be provided.
installed at customer
220 PSIG (1,517 location.
kPa)
Wastewater Treatment Please see comments regarding Wastewater Treatment Costs in Section 5.5.
Municipal $92,000 x Municipal Confirmed by Doran
Development Levies Infrastructure= Scott Oct.16-20
$10,000 per parcel; $11,500 per parcel
(2007 rate).
x Fire Protection: $1,000
per parcel;
x Recreation:
$500/parcel
Land Use/Zoning $51,500 - $500 per application, plus Amendment fee for
Amendments $76,500 CDR and advertising > 2 parcels $500, plus
a CDR ($50,000 -
$75,000), plus
advertising ($1,000)
Subdivision Costs $10,600 $5,000, plus $700/lot x Plan of Proposed
Subdivision
x Plan of Survey
x ISC Registration
x Based on 8 parcels
Municipal Reserve $22,250 5% of value of raw land; Most rural
Dedication $2,500 to $8,000 per municipalities do not
parcel require MR land
dedication. Money-in-
lieu of dedication is
preferred.
Total Estimated Cost* Wastewater
estimates are not
$19,412,645 to $31,127,076 included in this
Total. Please see
Section 5.5 for more
details.
Potential Revenue $400,000/net acre x 160 net acres = $64,000,000 $400,000/acre -
from Land Sales average sale price of
fully serviced
industrial land in
Saskatoon area.
Page | 235.4 Water
SaskWater’s engineering team analyzed the scenarios provided above for potable water and non-potable water services to
a specified location within:
o Rural Municipality (RM) of Corman Park No. 344 near Dalmeny, SK (Node 1).
o RM of Vanscoy No. 345 near Vanscoy, SK (Node 2).
o RM of Blucher No. 343 near Allen, SK (Node 3).
The volumes provided for the analysis included the following:
o Non-potable peak demand flow rate 120 m3/hr (440 igal/min) and an average flow rate of 900,000 m3/year (102.7
m3/hour).
o Potable demand flow range 50,000 m3/year- 75,000 m3/year and an average flow range of 11.42 m3/hour.
Potable water demand was based on domestic use only (i.e.: offices, washrooms, lunchrooms, etc.)
Node 1: RM of Corman Park:
SaskWater looked at various options available for the land location provided at the intersection between Highways 12 and
784 in the RM of Corman Park. The following is our recommendation for non-potable and potable water:
o Non-potable water recommendation: New intake (or infiltration wells), pump station and pipeline from the South
Saskatchewan River. Capital cost: $11.75M.
o Potable water recommendation: Pipeline tied into SaskWater’s 20” steel pipeline at the corner of Warman Road &
60th. Capital cost: $1.83M.
Node 2: RM of Vanscoy:
SaskWater looked at various options available for the land location provided at the intersection of Highway 7 and Minnesota
Road in the RM of Vanscoy. The following is our recommendation for non-potable and potable water:
o Non-potable water recommendation: Pipeline from the Queen Elizabeth Pump station
(QEP) to the site. Capital cost: $6.91M.
o Potable water recommendation: Purchase water from the City of Saskatoon at a to-be-determined point of delivery
with a pipeline to the site. A booster station would be required to provide adequate pressure to ensure the required
flow. Capital cost: $3.02M.
Node 3: RM of Blucher:
SaskWater examined various options for the land location provided, approximately 1,750 meters from the Town of Allan
by Highway 307 and the railway in the RM of Blucher. The following is our recommendation for non-potable and potable
water:
o Non-potable water recommendation: Pipeline from SaskWater’s Bradwell Reservoir, upgrades would be required
within the current infrastructure to provide the requested water volumes. Capital cost: $6.96M.
o Potable water recommendation: Pipeline to SaskWater’s Saskatoon Potable Water Supply System-East. Upgrades
may be required within the current infrastructure to provide the requested water volumes. Capital cost: $6.30M.
Page | 24Important Note:
SaskWater generally offers to invest in the construction cost of water supply projects. Once an opportunity has been
identified, SaskWater will enter into discussions towards a contribution that would go toward the construction of the water
supply infrastructure. To provide a frame of reference, SaskWater’s investment for infrastructure that would require
approximately 900,000 m3 of water delivered through a pipeline may be within the range of $4 - $6M, conditional upon
signing a long-term service agreement.
5.5 Wastewater
SaskWater could not provide a detailed cost estimate for wastewater treatment due to several factors. Effluent quality,
volume of water to be disposed and a wide range of treatment options available to processors makes it difficult to provide
an opinion on which treatment method would yield the best value. A meeting was arranged to determine what the City of
Saskatoon can receive for quantity and quality of wastewater and the costs. This information is helpful to determine which
option provides the best value or if the proponent should discharge direct to the river.
A high order estimate for a local wastewater plant to do pre-treatment before sending it to the city, could be in the $20-
$30M range. If the plant is designed to discharge direct to the river the capital may go up to $40- $55M range. An
additional question will also be around the cost of land, as none of these estimates take into consideration a large storage
pond for the wastewater that may be required.
SaskWater’s engineering team looked at two options for a wastewater solution to dispose of approximately 900,000 m3 per
year – BIOLAC by Parkson and Moving Bed Biofirm Reactor (MBBR) by Veolia.
BIOLAC, is a Biological Nutrient removal system based on activated sludge process. This is achieved by running the
wastewater through a number of oxic and anoxic basins. MBBR is based on an activated sludge process. MBBR’s main
focus is on Biological Oxygen Demand (BOD) and Nitrogen removal.
Meeting with City of Saskatoon
A meeting with Galen Heinrichs, Regional Infrastructure Engineer, at the City of Saskatoon was held on February 24, 2021
to discuss wastewater treatment options. We explored the feasibility of three options to treat up to 900,000 m3 of wastewater
per year utilizing the City of Saskatoon’s wastewater treatment plant.
In general, the cost of treating wastewater is highly dependent on the quality and concentration of pollutants contained
within the wastewater. Surcharges by the City are based on what goes through the waste plant. These charges are reflected
in the City’s utility bills charged to the customer. It is the opinion of the City that any agribusiness industry will require pre-
treatment of some kind to keep costs within reason. The options available range from simple filtration to complete on-site
processing using scalable membrane technology. The more filtering the better when using the City’s wastewater
infrastructure for disposal. There are also discounted rates that the City may offer if wastewater is processed during ‘off-
peak’ hours (ie. 11pm to 7am). The discounts will vary but could approximate to 35% in some circumstances.
On the next page are the summaries of each wastewater option explored.
Page | 25Option 1: Pre-Treatment of Wastewater Figure 7 – North 40 Biosolids Facility
Pre-treat of wastewater is highly recommended.
The City has a biosolids handling facility, shown
in Figure 7, located about three kilometres north
of Saskatoon which is a series of settling ponds
referred to as the ‘North 40’. Wastewater is
delivered via pipes to this facility where solids are
removed. A forcemain delivers waste to it, takes
out solids by spreading waste and removing
solids.
There is a large amount of existing capacity at the
North 40 facility to pre-treat more wastewater. In
a given scenario, the North 40 facility could serve
as a pre-treatment facility for a new agribusiness
park. A cost analysis would need to be undertaken
for a specific development proposal with quality
and quantity of wastewater specified.
Another consideration is the temporary storage of the wastewater on site until it can be released to the North 40 during off-
peak hours. It can take six hours for the flow of wastewater to reach the facility from some regional locations, so timing of
release is important to avoid costs during peak hours. The timing and delivery of wastewater is one factor, while the quality
is another. There are thresholds contained in The Sewer Use Bylaw No.. 9466 available on the City of Saskatoon website.
Overall, the matter comes down to storage capacity and pumping infrastructure. Economies of scale will start to occur when
there is pre-treatment (on-site or elsewhere) as surcharges apply based on the level of contaminants in the wastewater.
Option 2: Full On-site Treatment
Given some isolated locations within the Saskatoon Region, it may be cost effective to build on-site capacity. This option
is where the wastewater is treated to levels necessary to meet regulatory standards for discharge into a public waterway (i.e.
river). Although it may be more cost effective to look at this option, the benefits will depend on a specific example. In other
words, it may be feasible and desirable but should be considered on a case-by-case basis. The City has cost information
available which would assist in the analysis of this option.
Another factor to consider is that there are economies of scale by building a bigger on-site plant. Savings are realized on the
operation side where the bigger the plant, the cheaper (relatively) to operate and expand capacity. Bigger plants also make
it easier to meet regulatory requirements. Larger plants have built-in capacity and it is easier and less costly to add other
processes (ie. UV processing).
There are other smaller scale ‘modular’ or ‘scalable’ solutions available. The main drawback of these is the amount of
electricity used to power these facilities. Electricity is not cheap in Saskatchewan and these units require large amounts to
operate.
Option 3: Transporting or hauling wastewater to the City’s Wastewater plant
The City of Saskatoon will take wastewater which is hauled to the City; however, it would be too expensive to transport
wastewater into the City for the applications we are addressing in this report. Onsite treatment, pre-treatment with storage
and pumping are better options to explore. There is some existing piping infrastructure in the north along Highway 11 which
is gravity fed. Locations in the west or east are a bit trickier as you would need a forcemain.
Lastly, we examined the question about incentives, or negotiations about costs to encourage a project as described in this
report as an economic development initiative to grow the processing capacity within the Saskatoon Region. It is generally
Page | 26felt that it is worth having that conversation with the City. From the City’s perspective, issues of fairness and where and to
what level any subsidy would be offered will need to be addressed in these discussions.
5.6 Natural Gas
TransGas owns and operates the Transmission Utility and has exclusive franchise to transport natural gas within the
Province of Saskatchewan. TransGas has a Customer Dialogue process available where business, operational and rate
matters are openly discussed with a representative group of customers. Generally speaking, any potential customer who is
planning to use 500 or more gigajoules (Gj) per day would be a TransGas customer rather than a SaskEnergy customer.
It is important to note that although Saskatchewan has its own supply of natural gas, rising demand has reached levels to
the point that Saskatchewan needs to import natural gas from Alberta, as shown in Figure 8.
Figure 8: Saskatchewan Natural Gas Supply & Demand
Source: TransGas, 2021
Importing natural gas comes with added costs. These costs relate mainly to the use of pipelines and transmission
infrastructure in Alberta to bring the natural gas to several pick-up points in Saskatchewan. In general, these additional
costs, or ‘tolls’, add roughly $0.60 cents per Gj for Saskatchewan customers. These costs increase as the gas is transmitted
eastward. For example, the cost of natural gas in Saskatchewan is higher than it is in Alberta, and the cost of natural gas in
Manitoba is higher than it is in Saskatchewan.
A few important notes regarding natural gas costs include:
1. Natural gas prices are more volatile than many other commodities. Although the rate of volatility has declined
over time, as shown in Figure 9.
2. The price of natural gas has been declining as additional supply has been secured.
3. The cost for natural gas is uniform in Saskatchewan, however the cost to add infrastructure to bring natural gas
to individual sites can vary significantly depending on location.
Page | 27Figure 9: Saskatchewan Natural Gas Pricing
Source: TransGas, 2021
The Carbon Tax
Beginning on April 1, 2019 the Federal Government began charging the Carbon Tax. By April 1, 2020, the rate charged on
natural gas was $1.50/Gj. The Carbon Tax is set to rise over time and by 2030 the Carbon Tax will add approximately
$8.00/Gj to the cost of natural gas. The Carbon Tax is applied to natural gas uniformly across Canada so there is no cost
advantage/disadvantage created between provinces who produce and transport natural gas; however the carbon tax may
have competitive implications between Canada and the U.S. depending on the measures adopted in the U.S. to address
climate change.
The Federal Carbon Tax has exemptions available. It is up to the customer to determine if they qualify for the exemptions.
More information may be found here: https://www.canada.ca/en/services/environment/weather/climatechange.html.
5.7 Electricity
It is worth noting that more and more companies are looking at renewable and green energy options in their location
decisions. Besides maintaining an extensive and reliable electric network in the Saskatoon Region, SaskPower remains
committed to moving towards more renewable forms of energy production over the next decade. The goal is to realize 50%
of Saskatchewan’s energy needs from renewable sources by 2030. This means reducing emissions in electricity generation
by 40%. Wind energy, for example, currently comprises 5% of Saskatchewan generation capacity, will comprise 15% by
2024. This is an increase of 685 megawatts over the next 2-3 years. Furthermore, Saskatchewan shares with southern Alberta
some of the best conditions for solar energy generation in Canada. SaskPower’s goal is to add 60 megawatts of solar power
generation by the end of 2021. This will come from a series of utility-scale projects planned in Saskatchewan. These trends
should be consider in the marketing effort during the next phase of Project Ribbon.
Please see Section 9.0 Appendices for complete technical analysis from SaskPower, TransGas and SaskWater.
Page | 286.0 Sample Land Use and Zoning Regulations
A high-capacity industrial park would be expected to have a few major anchor tenants who are large food processors,
requiring large land area and high quantities of water, power and natural gas. The balance of the park would consist of
smaller, ancillary or complementary industrial and commercial uses related to these industries. The ability to cluster is seen
as attractive, but not critical. The location decisions made by agribusiness industries are based on a business case with cost
being a very important factor. In other words, it would be possible in the future to see only one or two major firms established
within a new industrial park, or as an expansion to an existing industrial location. The key is not the clustering, but the
economical and practical provision of utilities, water, wastewater, transportation and labour.
The following section provides some details around the types of land use
policies and zoning regulations which would be required to ensure that a new
agribusiness park does not end up becoming a general industrial area. The key
to success is to adopt a proper balance between land use control and flexibility
to ensure the agribusiness park is attractive to processors while allows enough
ancillary and accessory uses to make it economically viable.
All three representative sites are located outside of the P4G District, shown
in Figure 10.
6.1 Official Community Plans
Official Community Plans (OPCs) are statutory land use policy documents.
Prior to adopting a zoning bylaw, municipalities must have adopted land use
policies which guide how land is zoned and the how to regulate land use. The
OPCs within the identified RMs of Corman Park, Vanscoy and Blucher
should include statements of policy for the establishment of an area of land
focused on agribusiness development. Typical policy would specify a purpose
and intent of agribusiness land use specifying an advanced level of
preparedness. The allowance of large utility easements, or utility corridors Figure 10 - P4G Planning District Area
should be included as well as policy statements concerning locations within
close proximity to major transportation corridors, rail corridors and air transport.
Taking a pro-active approach by including these types of policy statements in OCPs is the first step toward an advanced
level of preparedness. Companies who are looking for locations and sites are often not prepared to wait while a municipality
undertakes a land use amendment to identify an appropriate or suitable location. The locations should be pre-determined
and land use policies and regulations in place.
Taking a pro-active approach by including policy statements in Official Community Plans is the first
step towards an advanced level of preparedness.
Page | 29You can also read