Recent changes in pan-Arctic sea ice, lake ice, and snow-on/off timing
←
→
Page content transcription
If your browser does not render page correctly, please read the page content below
The Cryosphere, 15, 4781–4805, 2021
https://doi.org/10.5194/tc-15-4781-2021
© Author(s) 2021. This work is distributed under
the Creative Commons Attribution 4.0 License.

Recent changes in pan-Arctic sea ice, lake ice, and snow-on/off
timing
Alicia A. Dauginis and Laura C. Brown
Department of Geography, Geomatics and Environment, University of Toronto Mississauga, Mississauga, L5L 1C6, Canada

Correspondence: Laura C. Brown (lc.brown@utoronto.ca)

Received: 11 February 2021 – Discussion started: 23 February 2021
Revised: 3 September 2021 – Accepted: 14 September 2021 – Published: 12 October 2021

Abstract. Arctic snow and ice cover are vital indicators of       the pan-Arctic highlights the complex relationships between
climate variability and change, yet while the Arctic shows        snow and ice, as well as their response to climatic change,
overall warming and dramatic changes in snow and ice cover,       and warrants detailed monitoring to understand how differ-
the response of these high-latitude regions to recent climatic    ent regions of the Arctic are responding to ongoing changes.
change varies regionally. Although previous studies have ex-
amined changing snow and ice separately, examining phenol-
ogy changes across multiple components of the cryosphere
together is important for understanding how these compo-          1   Introduction
nents and their response to climate forcing are intercon-
nected. In this work, we examine recent changes in sea ice,       The cryosphere is the second largest component of the global
lake ice, and snow together at the pan-Arctic scale using         climate system after the ocean, exerting significant effects on
the Interactive Multisensor Snow and Ice Mapping System           the Earth’s energy balance, atmospheric circulation, and heat
24 km product from 1997–2019, with a more detailed re-            transport (Lemke et al., 2007; Callaghan et al., 2011; Derk-
gional examination from 2004–2019 using the 4 km prod-            sen et al., 2012). The relevance for climate variability and
uct. We show overall that for sea ice, trends toward ear-         change is based on physical properties, such as high surface
lier open water (−7.7 d per decade, p < 0.05) and later fi-       reflectivity (albedo) and latent heat associated with phase
nal freeze (10.6 d per decade, p < 0.05) are evident. Trends      changes, both of which have a strong impact on the surface
toward earlier first snow-off (−4.9 d per decade, p < 0.05),      energy balance (Lemke et al., 2007). The extent and duration
combined with trends toward earlier first snow-on (−2.8 d         of snow and ice cover have direct feedbacks to the climate
per decade, p < 0.05), lead to almost no change in the length     system as they strongly influence planetary albedo (Rahm-
of the snow-free season, despite shifting earlier in the year.    storf, 2010; Derksen et al., 2012). Seasonal snow and ice
Sea ice-off, lake ice-off, and snow-off parameters were sig-      cover are also important for Arctic ecosystems as they rely
nificantly correlated, with stronger correlations during the      on snow and ice cover for feeding, transportation, and habitat
snow-off and ice-off season compared to the snow-on and           (Dersken et al., 2012). Additionally, the traditional ways of
ice-on season. Regionally, the Bering and Chukchi seas show       life of many northern residents depend on snow and ice cover
the most pronounced response to warming, with the strongest       for sources of food, transportation, and economic activities
trends identified toward earlier ice-off and later ice-on. This   (Derksen et al., 2012). Recent assessments reveal strong link-
is consistent with earlier snow-off and lake ice-off and later    ages between decreasing snow and ice cover and increasing
snow-on and lake ice-on in west and southwest Alaska. In          temperatures in the Arctic (e.g. Hernandez-Henriquez et al.,
contrast to this, significant clustering between sea ice, lake    2015; Johannessen et al., 2016; Druckenmiller and Richter-
ice, and snow-on trends in the eastern portion of the North       Menge, 2020). Reductions in sea ice extent, decreases in
American Arctic shows an earlier return of snow and ice. The      snow cover duration, and earlier melt onset in Arctic and
marked regional variability in snow and ice phenology across      sub-Arctic lakes have been reported (Serreze and Stroeve,
                                                                  2015; Surdu et al., 2016; Mudryk et al., 2018). Arctic sur-

Published by Copernicus Publications on behalf of the European Geosciences Union.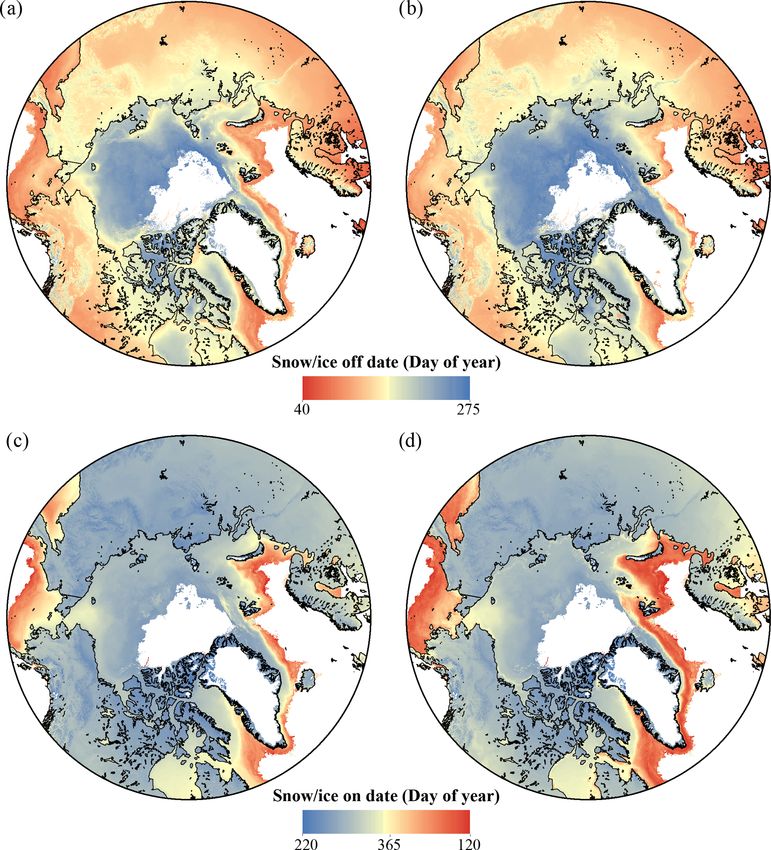
4782             A. A. Dauginis and L. C. Brown: Recent changes in pan-Arctic sea ice, lake ice, and snow-on/off timing

face air temperatures in 2019 were the second highest in            small leads and polynyas and can result in errors near coastal
the 120-year (1900–present) observational record (Drucken-          areas due to pixel-based land contamination (Howell et al.,
miller and Richter-Menge, 2020) and are projected to con-           2006; Brown et al., 2014). Johnson and Eicken (2016) note
tinue to increase well into the 21st century (Overland, 2020).      that strong brightness temperature contrasts across pixels can
Though the Arctic as a whole is undergoing climatic change,         result in falsely high estimates of sea ice concentration, par-
observations are often marked by regional differences tied          ticularly during the summer when there is open water near
in part to global connections via the atmosphere and ocean          coastal areas, while in contrast, it is known that passive mi-
(Druckenmiller and Richter-Menge, 2020). For example, sea           crowave data can underrepresent sea ice coverage when liq-
ice in the Alaska/Russia region has shown large reductions in       uid water is present (melt ponds on the ice, or wet snow) (e.g.
extent over the past decade, which has been linked to strong        Meier, 2005). SMMR and SSM/I are less commonly used in
warming and large sea surface temperature anomalies in this         lake ice applications as the spatial resolution limits analy-
area (Druckenmiller and Richter-Menge, 2020; Perovich et            ses to large lakes only. Additionally, the 85 GHz channel is
al., 2020). The Canadian Arctic Archipelago (CAA), how-             susceptible to considerable atmospheric interference, and the
ever, has been shown to exhibit earlier freeze trends during        25 km spatial resolution can result in large differences in wa-
recent years (e.g. Dauginis and Brown, 2020) and weaker             ter/land brightness temperatures (Cavalieri et al., 1999; How-
trends toward earlier melt onset compared to other Arctic           ell et al., 2009).
regions (e.g. Mahmud et al., 2016; Marshall et al., 2019).             Optical remote sensing data have also been used to moni-
Furthermore, the effect of warming on sea ice dynamics              tor Arctic snow and ice cover (e.g. Nitze et al., 2017; Young
in this region can be counterintuitive as warming could re-         et al., 2018) as they provide an improved spatial resolution
sult in increased ice import from the Arctic Ocean into the         (e.g. 500 m Moderate Resolution Imaging Spectroradiome-
CAA (Melling, 2002; Howell and Brady, 2019; Moore et                ter snow product) compared to passive microwave data. The
al., 2021). Therefore, monitoring Arctic snow and ice cover         use of optical imagery is limited to the spring and summer
is critical to improve our understanding of this complex            months in high-latitude regions as there is no source of il-
and variable region in the context of climate variability and       lumination during late fall and winter due to polar dark-
change.                                                             ness. Additionally, the poor temporal resolution of some op-
   Monitoring Arctic snow and ice cover largely relies on the       tical data (e.g. 16 d for Landsat, 8 d MODIS snow product)
use of satellite observations, as ground-based observations         can introduce uncertainty and inaccuracy into estimates of
are constrained by limited in situ data, large gaps and bi-         snow conditions on the Earth’s surface. Active microwave
ases in surface observing networks, and limited geographic          data have been used successfully in snow (e.g. Brown et
coverage (Brown et al., 2010; Brown and Duguay, 2011).              al., 2007), sea ice (e.g. Mortin et al., 2014), and lake ice
Satellite-based microwave data are most used in snow and ice        (e.g. Howell et al., 2009) applications. Active microwave al-
monitoring as they provide information regardless of solar il-      gorithms using synthetic aperture radar (SAR) provide high-
lumination and cloud cover (Brown et al., 2014). Microwave          resolution (20 to 100 m) retrieval of snow and ice parame-
measurements have been used to estimate snow (both on land          ters (e.g. Surdu et al., 2016; Zhu et al., 2018; Howell and
and on sea ice) and ice melt and freeze onset (e.g. Howell et       Brady, 2019). SAR estimates of snow and ice cover provide
al., 2006; Yackel et al., 2007; Wang et al., 2011; Zheng et al.,    the highest spatial resolution compared to other products,
2017; Bliss et al., 2017, 2019) at various spatial resolutions      and while previously limited by the moderate temporal res-
ranging from 6.25 to 25 km (Brown et al., 2014). The Spe-           olution, narrow swath width, and limited image availability
cial Sensor Microwave/Imager (SSM/I) and Scanning Multi-            across the Arctic (Brown et al., 2014; Howell et al., 2019), re-
channel Microwave Radiometer (SMMR) passive microwave               cent advances through additional sensors (e.g. RADARSAT
datasets have been widely used in snow and sea ice map-             Constellation Mission, Sentinel-1) have much improved both
ping (e.g. Cho et al., 2017; Lynch et al., 2016; Crawford et        temporal and spatial coverage as well as data availability.
al., 2018). Passive microwave data are well suited for snow         Multisensor approaches exploiting advantages of microwave
and ice monitoring due to all-weather imaging capabilities          and optical sensors have been used to estimate snow thick-
and long available records (since the late 1970s), though the       ness on first-year sea ice (e.g. Zheng et al., 2017) and to
coarse resolution (25 km) limits their application and reduces      resolve leads and polynyas at an improved spatial resolu-
the accuracy of estimates (Derksen et al., 2004; Mudryk et          tion (e.g. Ludwig et al., 2019). The all-weather capabilities
al., 2015; Pulliainen et al., 2020). There are well-documented      of microwave data combined with high temporal resolution
uncertainties in using passive microwave measurements to            of optical imagery can improve estimates of snow and ice
retrieve snow water equivalent and snow cover extent due to         parameters in the Arctic.
differences in snow and surface cover properties (e.g. snow            A combined approach to snow and ice mapping is possible
depth, snow grain size, topography, vegetation), which in-          with the use of the National Ice Center Interactive Multisen-
fluence microwave emission and backscatter (Brown et al.,           sor Snow and Ice Mapping System (IMS) product. IMS is
2010; Park et al., 2012; Tedesco et al., 2015). The coarse spa-     created using a variety of multi-sourced datasets (e.g. optical
tial resolution also limits the ability of the sensors to resolve   imagery, microwave data, ancillary data) and provides daily

The Cryosphere, 15, 4781–4805, 2021                                                    https://doi.org/10.5194/tc-15-4781-2021
A. A. Dauginis and L. C. Brown: Recent changes in pan-Arctic sea ice, lake ice, and snow-on/off timing                        4783

                                                                    2     Methodology

                                                                    2.1    Study regions

                                                                    In this study, regions north of 56◦ were considered when ex-
                                                                    amining pan-Arctic snow and ice phenology (Fig. 1) to in-
                                                                    clude much of the southern limits of the sea ice in the Bering
                                                                    Strait and large Arctic lakes that can be resolved using IMS.
                                                                    For the second section of the results, a regional approach was
                                                                    taken. For snow and lake ice, phenology parameters were
                                                                    considered on a hemispheric scale (i.e. North America and
                                                                    Eurasia). Further regional subdivisions are provided in Ta-
                                                                    ble 3 for the snow and lake ice trends. For sea ice, phenology
                                                                    parameters were examined in three broad regions (with some
                                                                    subregions included in Table 3): Canadian Arctic, Alaska/Far
                                                                    East Russia, and Eurasian Arctic. “Canadian Arctic” includes
                                                                    Baffin Bay, Hudson Bay, and the CAA; “Alaska/Far East
                                                                    Russia” includes the Beaufort, Chukchi, and Bering seas;
                                                                    “Eurasian Arctic” includes the East Siberian, Laptev, Kara,
                                                                    Barents, and Greenland seas. These regions were grouped
                                                                    based on similar trends in phenology parameters and dif-
                                                                    ferences in climate and weather characteristics at the hemi-
                                                                    spheric scale.
Figure 1. Map of the study area, including the main sea ice, snow
                                                                    2.2    Data
and lake ice regions (coloured), and subregions (numbered) in-
cluded in Table 3.
                                                                    Snow and ice data were obtained from the Interactive
                                                                    Multisensor Snow and Ice Mapping System archived at
maps of snow and ice cover at 24, 4, and 1 km spatial resolu-       the National Snow and Ice Data Center (2004–present,
tions (Ramsay, 1998; Helfrich et al., 2007). The daily tempo-       https://nsidc.org/data/G02156/versions/1, last access: 4 Oc-
ral resolution and all-weather monitoring capabilities make         tober 2021) as well as from the National Ice Center (2014–
IMS suitable in snow cover applications (e.g. Brubaker et           present, https://usicecenter.gov/Products/ImsHome, last ac-
al., 2005; Chen et al., 2012) and lake ice monitoring on large      cess: 4 October 2021) (U.S. National Ice Center, 2008). IMS
lakes (e.g. Brown and Duguay, 2012; Duguay et al., 2012,            is an operational product used to map daily snow and ice
2013, 2014, 2015; Duguay and Brown, 2018). Though not               cover over the Northern Hemisphere at 1 km (2014–present;
commonly used in sea ice applications, Brown et al. (2014)          not used in this study due to the limited time series), 4 km
show that IMS is advantageous over several automated algo-          (2004–present), and 24 km (1997–present) spatial resolu-
rithms for monitoring sea ice phenology. IMS is also able           tions. Analysts use a variety of multi-sourced datasets (for
to improve sea ice estimates by reducing land contamina-            a complete list of data sources, see the National Snow and
tion and better representing coastal regions compared to pas-       Ice Data Center, https://nsidc.org/data/g02156, last access:
sive microwave estimates (Brown et al., 2014), as well as           4 October 2021) to subjectively produce maps with discrete
to resolve finer-scale details between narrow ocean channels        values assigned to land, snow-covered land, water, and ice.
(Dauginis and Brown, 2020). This work expands on the work           Snow mapping primarily relies on visible imagery; however,
of Dauginis and Brown (2020) and examines changes in sea            if visible imagery is unavailable due to cloud occlusion or
ice, lake ice, and snow phenology from 1997–2019 across             low solar illumination, microwave data are used instead (Hel-
the pan-Arctic. The objectives of this paper are to (1) assess      frich et al., 2007; Brown et al., 2010). As misidentification
changes in sea ice, lake ice, and snow phenology from 1997–         errors associated with microwave data can occur, analysts
2019 across the pan-Arctic and (2) analyze regional changes         rely more on snow climatology compared to microwave data
in snow and ice phenology during more recent years (2004–           to estimate high-latitude snow cover during winter months
2019) across the pan-Arctic.                                        (Chang et al., 1996; Foster et al., 2005; Helfrich et al., 2007;
                                                                    Derksen, 2008; Brown et al., 2010). Ice cover analysis pri-
                                                                    marily relies on Advanced Very High Resolution Radiometer
                                                                    (AVHRR) or Moderate Resolution Imaging Spectroradiome-
                                                                    ter (MODIS) observations; however, microwave-based re-
                                                                    trievals and ice climatology are used when visible imagery is

https://doi.org/10.5194/tc-15-4781-2021                                                    The Cryosphere, 15, 4781–4805, 2021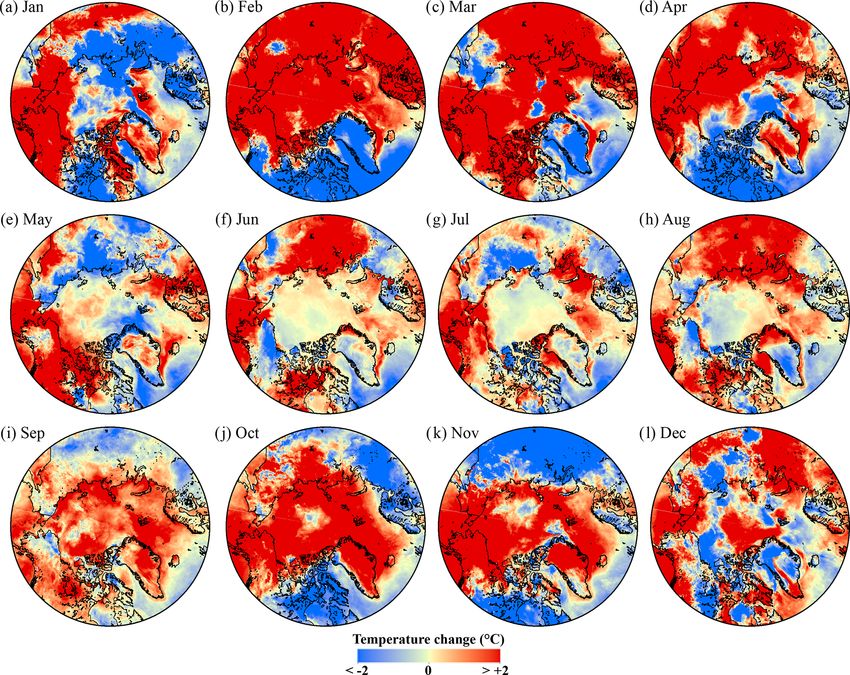
4784             A. A. Dauginis and L. C. Brown: Recent changes in pan-Arctic sea ice, lake ice, and snow-on/off timing

unavailable, with microwave retrievals representing approx-        other than March, April, and May (Wang et al., 2019). Re-
imately 30 %–35 % of the ice cover input (Helfrich et al.,         gionally, ERA5 performs best in the Central Arctic, followed
2007). IMS has been shown to outperform data from tradi-           by the Pacific Sector; the Atlantic sector shows good agree-
tional passive microwave products (AMSR-E, SSM/I, SSMI-            ment only while the 2 m temperatures are above −25 ◦ C
SSMIS) for both the timing and extent of first open water in       (Wang et al., 2019). We acknowledge that some small poten-
the Arctic (Brown et al., 2014). For example, through the          tially spurious regions of opposite trend directions appear in
Barrow Strait in the CAA, the ability of the 4 km IMS data to      some months of the temperature trend maps (e.g. February:
resolve narrow channels leads to 17 % more open water de-          eastern Siberia; March and October: Arctic Ocean); how-
tected than with SSM/I and 35 % more open water than de-           ever, these data are not used in a quantitative comparison and
tected with AMSR-E, validated with RADARSAT-1 (Brown               therefore do not affect the overall discussion.
et al., 2014). Overall, most pixels compared between IMS              Downwelling longwave radiation has been linked to melt
and the two passive microwave datasets for first-open-water        onset in the Arctic Ocean (e.g. Mortin et al., 2016). To fur-
dates were within ±5 d, with a greater percentage of the pix-      ther explore the linkages in the phenology data, downwelling
els in the categories beyond the ±5 d identifying open wa-         longwave radiation data from the Extended AVHRR Polar
ter earlier with IMS than the other products (Brown et al.,        Pathfinder (APP-x) were obtained from the NOAA National
2014). IMS has been shown to map higher snow cover frac-           Centers for Environmental Information (https://www.ncei.
tions during the spring melt period than other snow products       noaa.gov/data/avhrr-polar-pathfinder-extended/access/, last
(Brown et al., 2010; Frei and Lee, 2010) but is reported to        access: 4 October 2021) (Key et al., 2019). APP-x data are
have mostly between 80 %–90 % agreement with other snow            provided as 25 km EASE grid projection, processed for 04:00
products during the winter season of non-arctic North Amer-        and 14:00 LST. Due to large areas of missing data between
ica, with better agreement in the later part of the winter sea-    ∼ 59–64◦ N, the mean monthly values were created from the
son when deeper and more extensive snow cover is present           04:00 and 14:00 separately to avoid averaging errors where
(Chen et al., 2012). For lake ice, the 4 km IMS product occa-      data exist for one time and not the other (to avoid skewing the
sionally identifies earlier lake ice-on dates in regions of pro-   average with the diurnal differences). Some artificial patterns
longed cloud cover (e.g. northern Quebec, Canada), though          are evident in the data (e.g. March, Fig. 9c, near the pole);
both ice-on and ice-off timing detected using IMS are signif-      however, for the purpose of regional comparisons this is not
icantly correlated with, and comparable to, phenology dates        limiting as this region is not used in quantitative compar-
extracted from the MODIS snow cover product (Brown and             isons. Downwelling longwave radiation at the surface (LW↓)
Duguay, 2012).                                                     is calculated using a neural network to simulate a radiative
    Temperature data (2 m) are from the European Centre            model (see Key and Schweiger, 1998; Key et al., 2016). LW↓
for Medium-Range Weather Forecasts (ECMWF) ERA5                    was selected from APP-x rather than ERA5 as the APP-x
global reanalysis (Copernicus Climate Change Service,              dataset has been determined as climate data record quality
2017, https://doi.org/10.24381/cds.f17050d7; Hersbach et           and has been validated against in situ data with a bias of
al., 2020) and were compared to changes in snow and                only 2.1 W m−2 and RMSE of 22.4 W m−2 (with the higher
ice phenology. ERA5 provides coverage of the entire Arc-           RMSE values attributed to differences in surface snowfall
tic at a spatial resolution of approximately 31 km (0.25◦ ).       between the sampling site and the 25 km × 25 km area rep-
Monthly temperature data were used to calculate temperature        resented) (Key et al., 2016).
trends from 2004–2019. Temperature data near the surface
(1000 mbar) were reported to have a 0.89 K difference from         2.3   Methodology
radiosonde observations, and the ensemble spread is quite
low at ∼ 0.4 K or less, from 1979–2018, which can be used          The 24 and 4 km IMS products were used to examine
as an indicator of uncertainty (Hersbach et al., 2020). Com-       changes in snow and ice phenology dates across the pan-
pared to radiosonde temperature profiles in the Fram Strait,       Arctic following the methodology of Brown et al. (2014) and
ERA5 had the smallest bias (≤ 0.3◦ ) and RMSE (≤ 1.0◦ ) and        Dauginis and Brown (2020). For each pixel, consecutive days
the highest correlation coefficients (≥ 0.96) over four other      of IMS imagery were compared to determine the first and
reanalysis datasets tested (ERA-Interim, JRA-55, MERRA-            last changes between snow/ice and land/water to determine
2, CFSv2) (Graham et al., 2019). The 2 m air temperature           the timing of the snow/ice-on and off parameters examined.
in ERA5 has improved fit to observations in the Arctic com-        The phenology parameters used in this study and their defi-
pared to its predecessor ERA-Interim (Hersbach et al., 2020),      nitions can be found in Table 1. Only the first and last change
though Wang et al. (2019) show ERA5 has a warm bias over           from ice and water and vice versa are tracked for this work,
sea ice compared to observation data from buoys. The iden-         giving first and final dates of change. In sea ice regions dom-
tified warm bias is stronger in the cold season, particularly      inated by thermodynamics, there is little difference between
when the 2 m air temperature is below −25 ◦ C (daily mean          first and final timing, whereas in more active ice regions there
value of 5.4 ◦ C); however, monthly mean differences be-           could be a more notable difference between the first and fi-
tween ERA5 and buoys are ∼ 2 ◦ C or less through all months        nal timings as the ice moves past that pixel. Most lakes are

The Cryosphere, 15, 4781–4805, 2021                                                   https://doi.org/10.5194/tc-15-4781-2021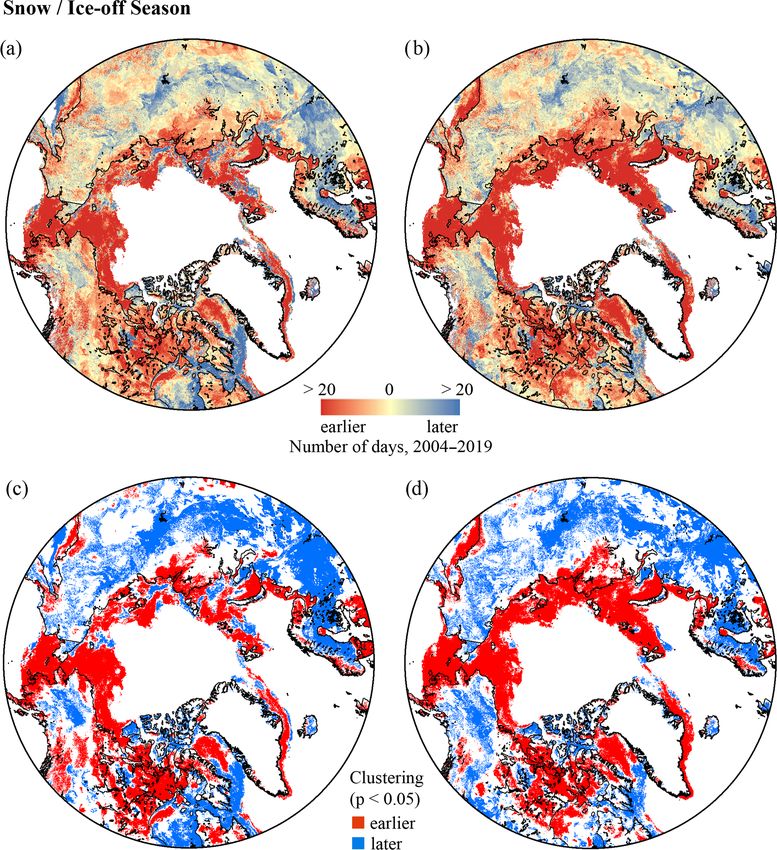
A. A. Dauginis and L. C. Brown: Recent changes in pan-Arctic sea ice, lake ice, and snow-on/off timing                                 4785

Table 1. Sea ice, lake ice, and snow phenology parameters and definitions in this study.

                                Parameter                              Definition
     FOWS                            First open water (sea ice)        The first change from ice to water for a given pixel
     FOWL                            First open water (lake ice)
     WCIS                            Water clear of ice (sea ice)      The last change from ice to water, signalling ice-free
     Water clear of ice (lake ice)   WCIL                              conditions for the remainder of the season
     FOS                             Freeze onset (sea ice)            The first detection of ice for a given pixel
     FOL                             Freeze onset (lake ice)
     CICS                            Continuous ice cover (sea ice)    The date of the last change from water to ice
     CICL                            Continuous ice cover (lake ice)
     first_sOFF                      First snow-off                    The first change from snow-covered land to snow-free land for
                                                                       a given pixel
     final_sOFF                      Final snow-off                    The last change from snow-covered to snow-free land, sig-
                                                                       nalling snow-free conditions for the remainder of the season
     first_sON                       First snow-on                     The first change from snow-free land to snow-covered land
     final_sON                       Final snow-on                     The last change from snow-free to snow-covered land

dominated by thermodynamics and return similar first and                 package=pracma, last access: 4 October 2021), which re-
final dates; however, lakes with more ice motion (e.g. Lake              moves the linear trend from a given dataset by computing the
Onega and Ladoga) may show a difference in their timings.                least-squares fit of a straight line to the data and subtracting
For snow, warmer regions where more frequent snowmelt oc-                the resulting function from the data (Borchers, 2019). The
curs tend to show a larger variation in first and final dates            detrended data were then used to calculate Spearman corre-
compared to the northern regions where the snow typically                lation coefficients between phenology parameters and tem-
remains on the ground for the season. Open-water duration                perature.
and snow-free duration are defined as the time between the                   To evaluate spatial trends in snow and ice phenology, 4 km
final change in the spring to the first change in the fall (WCIS         IMS phenology dates, 2 m air temperature data, and LW↓
to FOS , and last_sOFF to first_sON ). The 24 km IMS product             were analyzed using the Zhang method of trend analysis,
was used to examine trends in mean snow and sea ice phe-                 available in the zyp package in R (Bronaugh and Werner,
nology dates across the pan-Arctic from 1997–2019. For lake              2019). This method of trend analysis was proposed by Zhang
ice, only the 4 km IMS product (2004–2019) was used since                et al. (2000) and has been successfully used to represent
the 24 km product can only detect very large lakes (Fig. 2). In          trends in temperature and precipitation (Zhang et al., 2000),
addition to detecting more lakes, the 4 km IMS product can               lake ice phenology (Murfitt and Brown, 2017), and sea ice
also provide more detailed information on lake ice phenol-               and snow phenology (Dauginis and Brown, 2020. The Zhang
ogy within each lake, as shown in Fig. 2.                                method is suitable for analyzing spatial trends in this study
   To investigate the relationship between phenology pa-                 as it employs non-parametric tests and accounts for autocor-
rameters and temperature, and phenology parameters and                   relation. The linear trend is removed from the time series if
LW↓ (two important drivers of phenology in the arctic), re-              it is significant, and the autocorrelation computation repeats
gional correlations between variables were examined using                until the differences in the estimates of the slope and autore-
Spearman’s rank correlation coefficient (ρ) as this method               gressive model in two consecutive iterations are smaller than
describes the overall strength of the relationship between               1 % (Bronaugh and Werner, 2019). The Mann–Kendall test
two variables and does not require data to follow indepen-               is applied to the resulting time series and the Sen slope of
dent normal distributions (non-parametric) (Hauke and Kos-               the trend is computed (Bronaugh and Werner, 2019). The fi-
sowski, 2011). All data were projected to match the IMS                  nal result is the Sen slope (amount of increase or decrease)
data, and the centre point of all grid cells within each specific        at each location over the given time period, as well as the
region was used for the analysis. Datasets were detrended                significance of each trend (Bronaugh and Werner, 2019). In-
prior to correlation analysis to ensure relationships were not           terannual and regional variability in snow and ice conditions
a result of a shared trend but rather driven by actual rela-             will inherently affect phenology parameters, particularly for
tionships between variability in phenology parameters and                sea ice, which may not entirely clear out of some regions
temperature (Pizzolato et al., 2014). Data were detrended us-            in a particular season, leading to no ice-off or ice-on phe-
ing the pracma package in R (https://CRAN.R-project.org/                 nology detected for that year (Dauginis and Brown, 2020).

https://doi.org/10.5194/tc-15-4781-2021                                                          The Cryosphere, 15, 4781–4805, 2021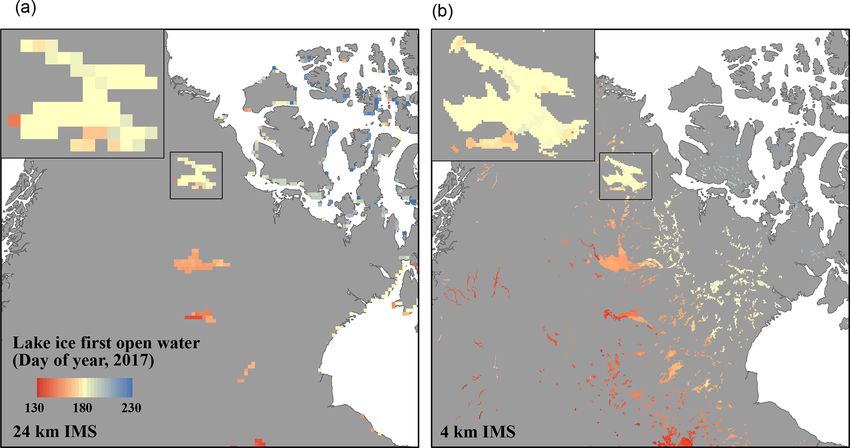
4786 A. A. Dauginis and L. C. Brown: Recent changes in pan-Arctic sea ice, lake ice, and snow-on/off timing
Figure 2. Comparison of 24 km (a) and 4 km (b) lake ice first open water in 2017.
Pixels with less than 14 years of phenology data (e.g. re- (average) is evident in the sea ice phenology as a result of
gions where ice-off only occurs occasionally) are treated as the resolution differences, mainly attributed to the improved
No Data, meaning the spatial extent of the trend examina- ability of the 4 km product to resolve smaller-scale features
tion represents the geographic region where snow/ice-off has and changes in the ice cover extent than the 24 km product
occurred in at least 14 of the last 16 years. can detect (e.g. leads, polynyas, nearshore conditions, and
Finally, clustering in the trend data was explored using lo- changes at the ice edges) (Brown et al., 2014; Dauginis and
cal indicators of spatial association (Anselin, 1995) through Brown, 2020). The overall agreement between the products
Esri ArcGIS. Clusters of spatially statistically significant is < 1 d for the snow phenology dates.
trends of high and low trend strengths were mapped. Clusters Sea ice open-water dates both show significant negative
crossing the shorelines indicate significantly clustered trends (earlier) trends (Fig. 4a), with a larger negative trend detected
between the sea ice and snow or lake ice phenology param- for first open water (FOWS , −7.72 d per decade, p < 0.05)
eters and show regions of interest where the phenology vari- compared to water clear of ice (WCIS , −3.31 d per decade,
ables were responding with similar trend strength over the p < 0.05). Snow-off dates show similar trends to ice-off pa-
study period. rameters, with both first snow-off (first_sOFF , −4.90 d per
decade, p < 0.05) and final snow-off (final_sOFF , −3.21 d
per decade, p > 0.05) becoming earlier (Fig. 4b). Trends for
3 Results and discussion lake ice first-open-water and water-clear-of-ice dates from
2004–2019 are negative (−0.76 and −0.02 d per decade,
3.1 Trends and correlations p > 0.05), though neither are statistically significant. We ac-
knowledge that the 16-year time series (Fig. 4c) does not pro-
Mean snow, sea ice, and lake ice phenology dates across vide a comparative time span to the other trends examined;
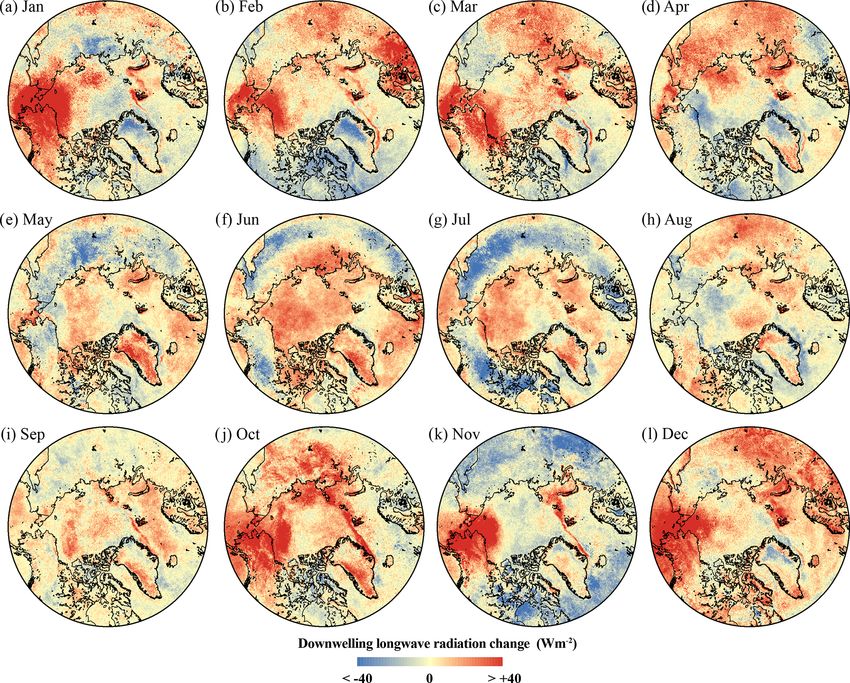
the pan-Arctic are shown in Fig. 3 (4 km IMS, 2004–2019). however, it should be noted that the direction of the trends is
Mean snow, sea ice, and lake ice phenology trends for the negative (earlier) and therefore follows a similar pattern ob-
24 km (1997–2019) and 4 km (2004–2019) IMS products are served in snow and sea ice trends during the 1997–2019 melt
shown in Fig. 4. Overall, the pan-Arctic shows trends to- season.
ward a longer snow-free and ice-free season (Fig. 4) from Sea ice freeze onset (FOS ) shows a slightly positive (later)
1997–2019, with trends toward earlier snow-off and ice-off trend (0.36 d per decade, p > 0.05), while the continuous
and later freeze detected. While the annual variability is sim- ice cover (CICS ) trend is much larger and statistically sig-
ilar between the 24 and 4 km mean phenology dates, a dif- nificant (10.60 d per decade, p < 0.05) (Fig. 4d). Both first
ference of 3.5 d later for ice-off and 3.4 d earlier for ice-on
The Cryosphere, 15, 4781–4805, 2021 https://doi.org/10.5194/tc-15-4781-2021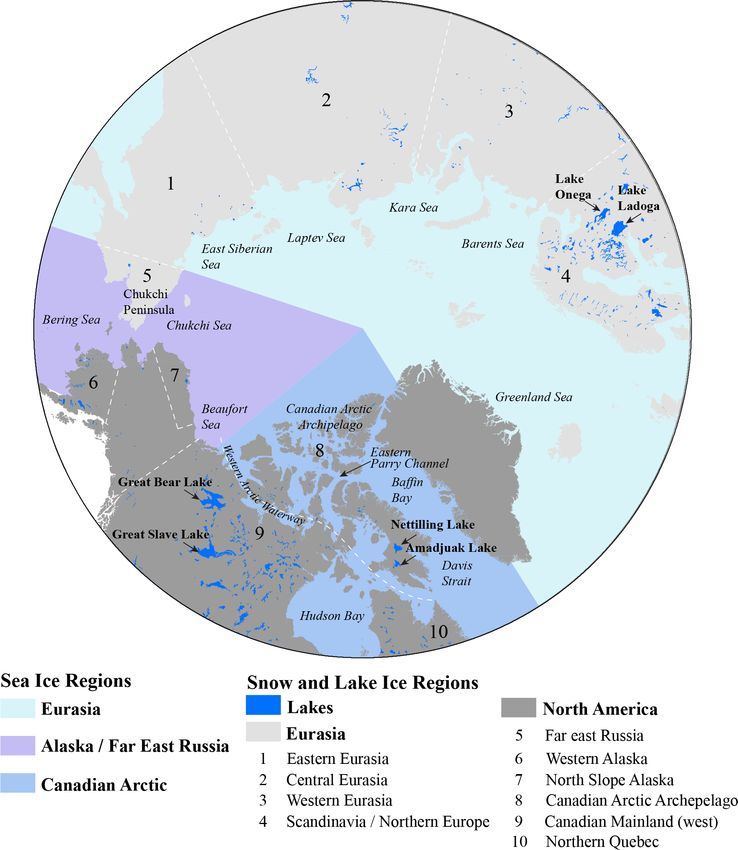
A. A. Dauginis and L. C. Brown: Recent changes in pan-Arctic sea ice, lake ice, and snow-on/off timing                                         4787

Figure 3. Mean 4 km IMS (2004–2019) (a) sea ice first open water (FOWS ), first snow-off (first_sOFF ), and lake ice first open water (FOWL );
(b) sea ice water clear of ice (WCIS ), final snow-off (final_sOFF ), and lake ice water clear of ice (WCIL ); (c) sea ice freeze onset (FOS ), first
snow-on (first_sON ), and lake ice freeze onset (FOL ); and (d) sea ice continuous ice cover (CICS ), final snow-on (final_sON ), and lake ice
continuous ice cover (CICL ). White regions indicate where either no snow/ice forms or snow/ice remains all year in 14 or more years of the
dataset.

and final snow-on (first_sON , final_sON ) trends are negative,              Non-significant trends are detected in lake ice parameters,
indicating that the pan-Arctic saw earlier snow onset over                   with the resulting open-water duration in Arctic lakes in-
the 1997–2019 study period. First snow-on is becoming ear-                   creasing by 6.86 d per decade from 2004–2019 (p > 0.05)
lier by 2.79 d per decade (p < 0.05), while final snow-on is                 (Fig. 5). Almost no trend in snow-free duration is identified
becoming slightly earlier by 0.64 d per decade (p > 0.05)                    (−0.27 d per decade, p > 0.05; Fig. 5), despite first snow-off
(Fig. 4e). Lake ice freeze onset (FOL ) and continuous ice                   trending significantly earlier (Fig. 4b).
cover (CICL ) exhibit trends toward later freeze (4.97 and                      Examining the pan-Arctic links between the phenol-
4.44 d per decade, p > 0.05; Fig. 4f), and although caution                  ogy parameters shows that while the first-open-water and
should be taken with the short time span, it should again be                 first-snow-off dates are not significantly correlated, the
noted that lake ice freeze dates show an overall shift toward                final-snow/ice-off parameters are (sea ice water-clear-of-
later freeze.                                                                ice and final-snow-off dates, ρ = 0.46 and 0.64, p <
   Overall, snow and ice cover are coming off earlier across                 0.05, for 24 and 4 km IMS products respectively) (Ta-
the pan-Arctic, while trends during the freeze season vary                   ble 2). During the snow-off and ice-off season, lake ice
for sea ice, lake ice, and snow. Earlier sea ice water-clear-of-             first-open-water (FOWL ) and water-clear-of-ice (WCIL )
ice dates contribute to longer open-water duration detected                  dates are significantly correlated with their equivalent
across the pan-Arctic (4.85 d per decade, p > 0.05; Fig. 5).                 snow and sea ice-off parameters from 2004–2019 (Ta-

https://doi.org/10.5194/tc-15-4781-2021                                                               The Cryosphere, 15, 4781–4805, 2021
4788               A. A. Dauginis and L. C. Brown: Recent changes in pan-Arctic sea ice, lake ice, and snow-on/off timing

Figure 4. Mean 24 km (1997–2019) and 4 km (2004–2019) (a) IMS sea ice first open water (FOWS ) and water clear of ice (WCIS ), (b) first
snow-off (first_sOFF ) and final snow-off (final_sOFF ), (c) lake ice first open water (FOWL ) and water clear of ice (WCIL ), (d) sea ice freeze
onset (FOS ) and continuous ice cover (CICS ), (e) first snow-on (first_sON ) and final snow-on (final_sON ), and (f) lake ice freeze onset (FOL )
and continuous ice cover (CICL ). Sen’s slope and significance are indicated for each phenology parameter using the 24 km IMS product.
Note that for lake ice, only the 4 km IMS product was used in this study.

ble 2). Stronger relationships are identified between lake                    Examining snow and ice cover at the pan-Arctic scale pro-
ice and sea ice-off parameters (ρFOW Sea Ice and Lake Ice =                vides important information on how the cryosphere is re-
0.62 and ρWCI Sea Ice and Lake Ice = 0.72, p < 0.05) compared              sponding to climate change as a whole; however, the large
to lake ice and snow (ρfirst snow−off and FOW Lake Ice = 0.55              degree of spatial variability warrants further investigation
and ρfinal snow−off and WCI Lake Ice = 0.51, p < 0.05). Snow-on            into snow and ice conditions at regional scales. For exam-
dates show small positive correlations with sea ice freeze pa-             ple, Dauginis and Brown (2020) demonstrate that the CAA is
rameters, though none are statistically significant (Table 3).             responding differently to warming compared to other regions
No significant correlations are detected between lake ice and              of the Arctic; their findings show later summer clearing of ice
sea ice and lake ice and snow parameters during the freeze                 and earlier sea ice freeze and snow onset since 2004 (due, at
season, though similar to the snow/ice-off season, stronger                least in part, to increased ice dynamics through the CAA),
correlations are detected between lake ice and sea ice freeze              in line with findings from previous studies that showed no
compared to lake ice-on and snow-on (Table 2).                             significant trends toward earlier sea ice melt onset dates in

The Cryosphere, 15, 4781–4805, 2021                                                              https://doi.org/10.5194/tc-15-4781-2021
A. A. Dauginis and L. C. Brown: Recent changes in pan-Arctic sea ice, lake ice, and snow-on/off timing 4789
per decade (Stroeve and Notz, 2018). The response of snow
cover to changes in climatic and hydrologic regimes also
varies regionally, with northern Canada and eastern Siberia
experiencing increased snowfall, while Scandinavia and re-
gions around the Greenland ice sheet are experiencing in-
creasing rainfall (Box et al., 2019). Additionally, ice cover
duration in Arctic lakes since 2004 shows interannual and
regional variability, with lakes in western Russia showing
anomalies ranging from 59 d shorter to 57 d longer, while
smaller anomalies were identified in Canadian lakes (Duguay
and Brown, 2018). Therefore, the following section will ex-
amine regional variability in sea ice, lake ice, and snow phe-
Figure 5. Pan-Arctic open-water duration for oceans (1997–2019), nology from 2004–2019 using the 4 km IMS product as the
snow-free duration (1997–2019) over land, and open-water duration
higher spatial resolution (compared to the 24 km product) al-
for lakes (2004–2019). Sen’s slope of the trend and significance are
shown.
lows finer-scale changes in snow and ice cover to be detected.
3.2 Regional variability
Table 2. Pan-Arctic Spearman rank correlations (ρ) for snow and
ice phenology dates using the 24 km (1997–2019) and 4 km (2004–
3.2.1 Snow-off and ice-off season
2019) IMS products. An asterisk (*) represents statistically signifi-
cant correlations at the 95 % confidence level.
Short-term trends in sea ice, snow, and lake ice phenology
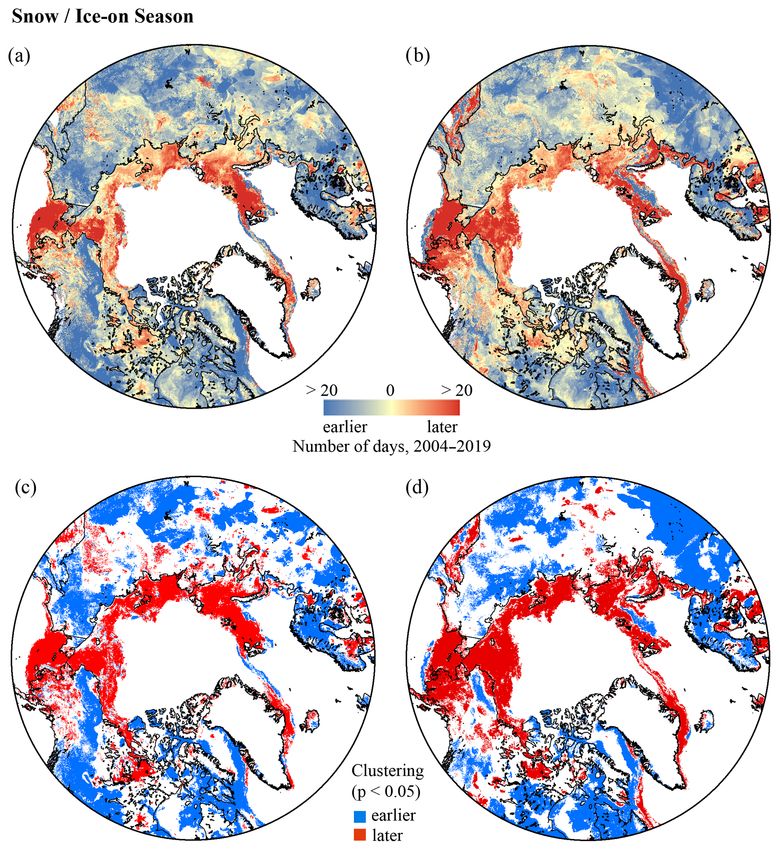
rho ( ρ) from 2004–2019 are presented in Figs. 6 (snow/ice-off)
and 7 (snow/ice-on) along with maps identifying significant
First melt local clustering in the trends, indicating similar trends
first_sOFF FOWL between the phenology parameters. Median values of the
spatial trends in Figs. 6 and 7 for regions defined in Fig. 1
FOWS 0.38 (24 km)
0.62* (4 km) are reported throughout the following section and included
0.38 (4 km)
in Table 3. Correlations with 2 m air temperature for the
FOWL 0.55* (4 km) – three main sea ice regions and two main snow/lake ice
Final melt regions (Fig. 1) are presented in Table 4. Overall, sea ice,
snow, and lake ice show tendencies toward earlier melt,
final_sOFF WCIL with the exception of (1) Eurasian snow-off parameters,
WCIS 0.46* (24 km) which show little change from 2004–2019 compared to
0.72* (4 km)
0.64* (4 km) other Arctic regions, and (2) sea ice first open water in
WCIL 0.51* (4 km) –
the Canadian Arctic. The Alaska/Far East Russia region
exhibited the largest trends toward earlier sea ice-off
First freeze (medianFirst Open Water Sea Ice = 23 d), and North America
first_sON FOL showed larger trends toward earlier snow-off and lake ice-off
compared to Eurasia (North America: medianFirst snow−off =
FOS 0.15 (24 km) 8 d, medianFirst Open Water Lake Ice = 4 d; Eurasia
0.23 (4 km)
0.08 (4 km)
medianFirst snow−off = 0 d, medianFirst Open Water Lake Ice = 1 d).
FOL −0.27 (4 km) –
Final freeze
Canadian Arctic
final_sON CICL In the Canadian Arctic, sea ice has a wide range of ice-off
CICS 0.37 (24 km) timing, spanning from March in the far southern reaches to
0.37 (4 km) early May in the north for nearshore, polynya, and lead re-
0.24 (4 km)
gions and to late August clearing from the channels of the
CICL 0.19 (4 km) –
CAA – in the portions where clearing occurs. The major-
ity of the region experiences ice-off conditions through June,
July, and August, and these months show significant (neg-
the CAA (e.g. Mahmud et al., 2016; Marshall et al., 2019). ative) correlations between regional mean sea ice-off dates
Other Arctic regions have shown significantly earlier sea ice and the regional mean 2 m temperature (as well as May and
melt onset: Barents Sea 8.2 per decade, Kara seas 5.1 per WCIS , Table 4), indicating that earlier sea ice-off dates here
decade, Baffin Bay 6.6 per decade, and Greenland Sea 7.1 are strongly related to air temperature during the ice-off sea-
https://doi.org/10.5194/tc-15-4781-2021 The Cryosphere, 15, 4781–4805, 20214790 A. A. Dauginis and L. C. Brown: Recent changes in pan-Arctic sea ice, lake ice, and snow-on/off timing
Table 3. Regional analysis (see Fig. 1) of the median trend strength (days/16 years) and direction (− earlier, + later) for all of the phenology
parameters: first open water (FOW, subscript S denotes sea ice, L denotes lake ice), water clear of ice (WCI, subscript S denotes sea ice, L
denotes lake ice), freeze onset (FO, subscript S denotes sea ice, L denotes lake ice), complete ice cover (CIC, subscript S denotes sea ice, L
denotes lake ice), first and final snow-off (_SOFF ), and first and final snow-on (_SON ).
Melt Freeze
Sea ice FOWS WCIS FOS CICS
Canadian Arctic region +2 −7 −11 −9
Canadian Arctic Archipelago −4 −7 −12 −8
Hudson Bay +2 −7 −10 −10
Baffin Bay −9 −18 −7 −6
Davis Strait +24 +11 −22 −10
Alaska/Far East Russia region −23 −31 +8 +14
Beaufort Sea −30 −37 +6 +8
Chukchi Sea −25 −31 +8 +19
Bering Sea −34 −41 +27 +52
Eurasia region −14 −28 +7 +10
East Siberian Sea −15 −24 +5 +7
Laptev Sea −11 −28 +8 +8
Kara Sea −16 −32 +7 +10
Barents Sea −15 −34 +16 +13
Greenland Sea −13 −25 +2 +15
Melt Freeze
Snow/lake ice First_SOFF Final_SOFF FOWL WCIL First_SON Final_SON FOL CICL
North American Arctic −8 −6 −4 −4 −8 −3 +2 0
Canada Mainland west −11 −10 −5 −5 −5 −4 +5 +1
Northern Quebec −7 −5 +9 +9 −8 −16 −4 −2
Alaska/Far East Russia −3 0 −18 −19 −5 +1 +9 +11
Western Alaska −17 −15 −22 −27 +3 +22 +33 +25
North Slope −8 −1 +3 +3 −21 0 −8 −9
Far East Russia 0 1 NA NA −9 −4 NA NA
Nettilling Lake −3 +2 −3 −1
Amadjuak Lake −1 0 +3 +2
Great Slave Lake −6 −4 +3 +1
Great Bear Lake −4 −8 +8 +6
Lake Hazen −1 −4 +3 −11
Eurasia 0 0 −1 −2 −9 −7 +8 +8
Scandinavia/Northern Europe 0 0 −1 −1 −13 −9 +28 +19
NW Eurasia +5 +3 +1 −2 −8 −13 −4 −6
Central Eurasia 0 0 −7 −9 −9 −4 −2 −4
NE Eurasia −1 −1+2 +2 −9 −8 −6 −9
Lake Ladoga* NA −9 +13 NA
Lake Onega −5 −6 +28 +15
* FOWL and CICL are not included for Lake Ladoga as the lake did not fully freeze in several of the study years. NA: not available.
son. LW↓ shows significant (negative) correlations to WCIS first-snow-off dates are significantly correlated with both 2 m
in September, which is also when ice can clear from the chan- temperature and LW↓ values for April and May, while fi-
nels of the CAA (where it clears) (Table 5). For the North nal snow-off is significantly correlated only with May (when
American Arctic region, snow-free timing ranges from mid- much of the mainland area of Canada becomes snow-free,
April in the south to mid-July in the north. Regional mean Fig. 3). Lake ice-off timing spans from April in the south to
The Cryosphere, 15, 4781–4805, 2021 https://doi.org/10.5194/tc-15-4781-2021A. A. Dauginis and L. C. Brown: Recent changes in pan-Arctic sea ice, lake ice, and snow-on/off timing 4791 Figure 6. Trends in 4 km IMS (2004–2019) (a) sea ice first open water (FOWS ), first snow-off (first_sOFF ), and lake ice first open water (FOWL ); (b) sea ice water clear of ice (WCIS ), final snow-off (final_sOFF ), and lake ice water clear of ice (WCIL ); (c) significant trend clusters in FOWs, FOWL , and first_SOFF ; and (d) significant trend clusters in WCIS , WCIL , and final_SOFF . July in the northern islands (very few lake pixels experience pared to their surrounding areas (Fig. 3): snow-free timing ice-off in August, other than Lake Hazen). Both first and final occurs here in May, while the ice remains on the large lakes lake ice-off regional mean dates are significantly correlated until June/early July due to the extra energy required to melt with May and June 2 m air temperatures, while the bulk of ice vs. snow. the ice-off dates in this region are through June and July; it is Sea ice is clearing out of the Canadian Arctic earlier, while established that there is lag in air temperatures crossing the the first detection of open water (FOWS ) shows a later trend, 0 ◦ C isotherm and the timing of lake ice-off – up to about albeit with considerable regional variability. In the CAA, a month on average for lakes across Canada (Duguay et al., earlier first open water is detected (median = 4 d), though 2006). Regional mean LW↓ through this region shows sig- changes toward earlier water clear of ice are mostly confined nificant (negative) correlations between first and final open to the southern channels, where temperature increases are water in both June and July (as well as May WCIL , Table 5). larger in August and September (Fig. 8h and i). The signif- A strong example of the lag between lake ice-off and snow- icant clustering between water and land pixels in the north- off can be seen using Great Bear and Great Slave lakes com- ern CAA (Fig. 6c and d), with predominantly later trends for https://doi.org/10.5194/tc-15-4781-2021 The Cryosphere, 15, 4781–4805, 2021
4792              A. A. Dauginis and L. C. Brown: Recent changes in pan-Arctic sea ice, lake ice, and snow-on/off timing

Figure 7. Trends in 4 km IMS (2004–2019) (a) sea ice freeze onset (FOS ), first snow-on (first_sON ), and lake ice freeze onset (FOL ); (b) and
sea ice continuous ice cover (CICS ), final snow-on (final_sON ), and lake ice continuous ice cover (CICL ); (c) significant trend clusters in
FOs, FOL , and first_sON ; and (d) significant trend clusters in CICS , CICL , and final_sON .

both open water and snow-off (no lakes are large enough in                in July and August ranging from 0.01 to 3 ◦ C (Fig. 8g and h)
this area to be detected by IMS), indicates ice and snow are              where the notable trends toward earlier ice-off are detected
responding similarly in this region. For example, the eastern             (Fig. 6a and b). Later first-open-water trends are evident for
Parry Channel and the surrounding area (Cornwallis Island,                Hudson Bay (median = 2 d), with earlier water-clear-of-ice
Bathurst Island, and northern Somerset Island) show signifi-              trends (median = 7 d). The median temperature increase dur-
cant clustering between the sea ice and snow trends (Fig. 6c              ing July over Hudson Bay is 0.55 ◦ C, though while the ma-
and d), further highlighting this region of later ice/snow-off            jority of the northern and western portions show warming
(Dauginis and Brown, 2020). The Baffin Bay/Davis Strait                   trends, the eastern and more southern portions exhibit cool-
region overall shows a median trend of 1 d earlier; how-                  ing (Fig. 8g). These regions of cooling correspond with the
ever, the northern portion (Baffin Bay) and southern por-                 region of predominantly later FOWS trends (median = 2 d).
tion (Davis Strait) show opposite trend directions (9 d ear-              Significant clustering is shown in the ice and snow-off trends
lier vs. 24 d later, respectively) (Fig. 6a, Table 3). Warming            along the southern stretches of Hudson Bay and nearshore
trends are identified over the northern region of Baffin Bay

The Cryosphere, 15, 4781–4805, 2021                                                            https://doi.org/10.5194/tc-15-4781-2021
A. A. Dauginis and L. C. Brown: Recent changes in pan-Arctic sea ice, lake ice, and snow-on/off timing                                 4793

Table 4. Regional Spearman rank correlations (ρ) for snow and ice phenology dates and monthly 2 m temperature from 2004–2019 using
4 km IMS. For sea ice, Canadian Arctic includes Baffin Bay, Hudson Bay, and the CAA; Alaska/Far East Russia includes the Beaufort,
Chukchi, and Bering seas; and Eurasian Arctic includes the East Siberian, Laptev, Kara, Bering, and Greenland seas (see Fig. 1). Months
were selected for each phenology parameter based on mean phenology dates in Fig. 3. Bold represents statistically significant correlations at
the 95 % confidence level.

                                Sea ice
                                Melt       Canadian Arctic       Alaska/Russia Arctic        Eurasian Arctic
                                           FOWS         WCIS      FOWS           WCIS       FOWS         WCIS
                                Mar       −0.174       −0.309    −0.356        − 0.524       0.059      −0.024
                                Apr       −0.344       −0.315      0.103       −0.038      − 0.579      − 0.741
                                May       −0.471       − 0.562     0.185         0.488     −0.135       −0.068
                                Jun       −0.441       −0.482    −0.165        −0.006      −0.209       −0.300
                                Jul       − 0.553      − 0.653   − 0.632       −0.435        0.529        0.118
                                Aug       − 0.668      − 0.591   −0.468        −0.224        0.247        0.262
                                Sep       − 0.747      − 0.579     0.518         0.712       0.026        0.118
                                Freeze     Canadian Arctic       Alaska/Russia Arctic        Eurasian Arctic
                                              FOS         CICS      FOS          CICS          FOS        CICS
                                Sep         0.447       0.553    −0.300        −0.165       0.318       −0.059
                                Oct         0.141       0.306    −0.179         0.144       0.462        0.285
                                Nov         0.491       0.582     0.050         0.062       0.271        0.026
                                Dec         0.341       0.415     0.094        −0.206       0.524        0.047
                                Jan         0.124      −0.029    −0.171         0.115       0.124        0.024
                                Feb         0.026       0.035     0.165         0.226       0.376        0.047
                                Mar         0.594       0.224     0.429         0.215      −0.024       −0.426
                                Apr         0.238       0.038    −0.047        −0.462      −0.288        0.015

                   Snow and lake ice
                   Melt                         Eurasia                                      North America
                             first_soff   final_soff    FOWL       WCIL       first_soff   final_soff    FOWL      WCIL
                   Mar         0.050         0.124     −0.406    −0.359              –            –           –         –
                   Apr        −0.235       − 0.629     − 0.665   − 0.665       − 0.618      −0.382      −0.409    −0.400
                   May        −0.338       − 0.691     −0.194    −0.365        − 0.612      − 0.603     − 0.506   − 0.532
                   Jun         0.156       −0.226      −0.109    −0.176        −0.432       −0.241      − 0.615   − 0.638
                   Jul        −0.288       − 0.500     −0.203    −0.326        −0.321       −0.259      −0.485    −0.488
                   Freeze                       Eurasia                                      North America
                              first_son   final_son        FOL      CICL      first_son    final_son       FOL      CICL
                   Aug        −0.046        0.121            –         –        0.639        0.336            –        –
                   Sep        −0.096       −0.421        0.309     0.209        0.557        0.046        0.118   −0.088
                   Oct         0.246       −0.111       −0.229    −0.156        0.543        0.407        0.088    0.100
                   Nov         0.114        0.296        0.309     0.212       −0.193       −0.136        0.565    0.509
                   Dec         0.093        0.132        0.426     0.332        0.071       −0.064        0.138    0.103
                   Jan             –       −0.257       −0.076    −0.100            –            –        0.165    0.279
                   Feb             –       −0.107        0.432     0.526            –            –            –        –

regions (Fig. 6c and d), indicating links in the response of ice           first_sOFF = 11 d, median final_sOFF = 10 d, Table 3). Links
and snow in those regions.                                                 between the sea ice trends and the snow and lake ice trends
  Earlier trends for snow and lake ice-off parameters are                  are evident in the region spanning east from Victoria Island
detected across North America. Looking at the western                      into the central mainland Arctic region, where significant lo-
mainland areas of the Canadian Arctic, snow-off trends are                 cal clustering is identified, with more clustering evident dur-
predominantly earlier over the 2004–2019 period (median                    ing first snow-off and ice-off events. Lake ice first open wa-

https://doi.org/10.5194/tc-15-4781-2021                                                           The Cryosphere, 15, 4781–4805, 2021
4794 A. A. Dauginis and L. C. Brown: Recent changes in pan-Arctic sea ice, lake ice, and snow-on/off timing
Table 5. Regional Spearman rank correlations (ρ) for snow and ice phenology dates and monthly downwelling longwave radiation (APP-x)
from 2004–2019. For sea ice, Canadian Arctic includes Baffin Bay, Hudson Bay, and the CAA; Alaska/Far East Russia includes the Beaufort,
Chukchi, and Bering seas; and Eurasian Arctic includes the East Siberian, Laptev, Kara, Bering, and Greenland seas (see Fig. 1). Months
were selected for each phenology parameter based on mean phenology dates in Fig. 3. Bold represents statistically significant correlations at
the 95 % confidence level.
Sea ice
Melt Canadian Arctic Alaska/Russia Arctic Eurasian Arctic
FOWS WCIS FOWS WCIS FOWS WCIS
Mar 0.385 0.338 − 0.659 −0.456 0.156 0.106
Apr 0.021 0.103 −0.124 −0.141 −0.259 −0.326
May −0.244 −0.253 − 0.526 −0.391 0.100 −0.338
Jun −0.079 −0.100 −0.171 −0.032 0.253 −0.006
Jul 0.012 −0.115 −0.235 −0.009 −0.003 −0.274
Aug −0.162 −0.182 −0.171 0.147 0.097 −0.091
Sep −0.168 − 0.497 0.144 0.450 −0.215 −0.406
Freeze Canadian Arctic Alaska/Russia Arctic Eurasian Arctic
FOS CICS FOS CICS FOS CICS
Sep 0.512 0.241 −0.068 −0.238 −0.056 −0.209
Oct 0.585 0.379 0.053 −0.156 0.506 0.171
Nov 0.485 0.306 −0.197 0.082 0.221 −0.079
Dec 0.412 0.671 0.229 0.456 0.256 −0.044
Jan 0.300 0.218 0.265 0.665 0.462 0.129
Feb 0.268 0.409 0.279 0.594 0.506 −0.065
Mar 0.232 0.191 0.468 0.562 0.347 −0.118
Apr 0.344 0.385 0.185 −0.056 0.224 0.009
Snow and lake ice
Melt Eurasia North America
first_soff final_soff FOWL WCIL first_soff final_soff FOWL WCIL
Mar 0.112 0.379 −0.171 −0.185 – – – –
Apr 0.003 − 0.318 −0.300 −0.447 − 0.647 −0.415 −0.535 −0.538
May −0.421 −0.629 −0.232 −0.282 − 0.529 − 0.515 −0.556 − 0.565
Jun −0.182 −0.374 0.191 0.038 −0.156 −0.106 − 0.044 − 0.082
Jul −0.279 − 0.447 −0.297 −0.382 −0.238 −0.174 − 0.406 − 0.403
Freeze Eurasia North America
first_son final_son FOL CICL first_son final_son FOL CICL
Aug 0.232 −0.021 – – 0.264 0.318 – –
Sep 0.346 −0.321 0.259 0.221 0.568 0.118 0.271 0.024
Oct 0.236 −0.082 0.047 0.106 0.264 0.332 −0.135 −0.162
Nov −0.250 0.232 0.188 0.309 −0.243 −0.229 0.247 0.071
Dec −0.236 −0.075 0.188 0.091 −0.346 −0.286 0.071 −0.018
Jan – −0.446 0.188 0.191 – – 0.218 0.306
Feb – −0.261 0.238 0.353 – – – –
ter and water clear of ice are both trending earlier here as sistent with negative ice cover duration anomalies (shorter
well (median = 5 d for both), with larger trends detected in ice cover duration) for 9 of the last 14 years identified by
the eastern portions, likely related to strong warming over Duguay and Brown (2018). While the snow trends surround-
the region in May and June (Fig. 8e and f). Examining Great ing these large lakes are also earlier, they are not significantly
Slave Lake and Great Bear Lake indicates that trends for wa- clustered with the lake ice trends, with the exception of the
ter clear of ice are 4 and 8 d (median values) earlier, con- eastern portion of Great Bear Lake and a small portion of
The Cryosphere, 15, 4781–4805, 2021 https://doi.org/10.5194/tc-15-4781-2021A. A. Dauginis and L. C. Brown: Recent changes in pan-Arctic sea ice, lake ice, and snow-on/off timing 4795 Figure 8. Trends in monthly 2 m temperature from 2004–2019 in (a) January, (b) February, (c) March, (d) April, (e) May, (f) June, (g) July, (h) August, (i) September, (j) October, (k) November, and (l) December. the western edge. The western portion of Great Slave Lake tion anomalies observed during the last 6 seasons (Duguay shows mostly earlier ice-off trends, while the surrounding and Brown, 2018). Lake Hazen, in the far north, indicates snow trends show very slight tendency toward later snow- trends toward earlier first open water and water clear of ice off, which aligns with both cooling temperature trends and overall; however, while the eastern portion of the lake shows less LW↓ in that region (e.g. June, Figs. 8f and 9f). Interest- earlier ice-off trends, the western portion does indicate later ingly, the temperature and radiation trends here clearly show ice-off trends (with ice cover remaining the longest on the the effect of the lakes on their surroundings with contrast- western portion of the lake for several years). ing trends for the lakes compared to land to the west. Lake ice-off dates in northern Quebec (bordered by Hudson Bay Alaska/Far East Russia and Baffin Bay) show later trends, with both ice-off param- eters showing median trends of 9 d later, which corresponds Mean sea ice-off timing in this region is quite different for the to a widespread cooling pattern over northern Quebec in July Bering Sea (mainly April through May, with some late March from 2004–2019 (Fig. 8g). North of this region, the two large first open water) and the Chukchi/Beaufort seas (mainly late lakes on Baffin Island, Nettilling Lake and Amadjuak Lake, August through mid-September). Significant (negative) cor- show that trends for first open water are 3 d (median values) relations between sea ice-off dates and air temperature are earlier for both lakes, though from 2004–2018 these lakes identified in this broad region only for FOWS in May; how- showed positive ice cover duration anomalies for 7 of the ever, warming patterns are present over the Bering/Chukchi last 14 ice seasons, with most of the longer ice cover dura- seas for almost all months since 2004 (Fig. 8). Interest- https://doi.org/10.5194/tc-15-4781-2021 The Cryosphere, 15, 4781–4805, 2021
4796              A. A. Dauginis and L. C. Brown: Recent changes in pan-Arctic sea ice, lake ice, and snow-on/off timing

Figure 9. Trends in downwelling longwave radiation 2004–2019 in (a) January, (b) February, (c) March, (d) April, (e) May, (f) June, (g) July,
(h) August, (i) September, (j) October, (k) November, and (l) December.

ingly, both ice-off parameters show positive correlations with              Sea ice in the Alaska/Far East Russian coastal region
September temperatures – likely an artifact of the large re-             shows large trends toward earlier ice-off, with first-open-
gion compared, as only the far northern sections of this re-             water trends indicating 30 d earlier in the Beaufort Sea, 25 d
gion experience ice-off in September (Table 4). LW↓ in this              earlier in Chukchi Sea, and 34 d earlier in the Bering Sea
region is significantly correlated with the ice-off parameters           (median values, with slightly larger values for WCIS ). The
in both March and May and is likely a reflection of the condi-           Chukchi and Bering seas have shown larger sea surface tem-
tions initiating melt onset (e.g. Mortin et al., 2016), as timing        perature warming trends in August compared to the Arctic-
of onset is correlated with timing of ice retreat (Stroeve et            wide August mean, and the September sea ice extent in
al., 2016). Snow-free timing in this region is predominantly             the Chukchi Sea was well below the 1981–2010 median in
through late April, early May in the interior, and mid-June              2012, 2018, and 2019 (Druckenmiller and Richter-Menge,
on the North Slope and Chukchi Peninsula, with regions of                2020; Perovich et al., 2020). First-snow-off trends across
higher elevations not becoming snow-free until August. Lake              Alaska/Far East Russia (median = 3 d earlier) are smaller
ice-off timing spans from May in the southern coastal regions            compared to Canada, though western Alaska shows strong
to July in the northern coastal regions. This land region is in-         trends toward earlier snow-off. Strong warming over west-
cluded in the North American Arctic snow and lake ice cor-               ern Alaska from 2004–2019 during April (Fig. 8d) may
relations, discussed in the previous section.                            contribute to earlier snowmelt in the region. The median
                                                                         lake ice first-open-water date shows trends of 18 d earlier

The Cryosphere, 15, 4781–4805, 2021                                                           https://doi.org/10.5194/tc-15-4781-2021
You can also read