LAKE ERIE DISSOLVED OXYGEN MONITORING PROGRAM
←
→
Page content transcription
If your browser does not render page correctly, please read the page content below

LAKE ERIE DISSOLVED OXYGEN MONITORING PROGRAM TECHNICAL REPORT

  LAKE ERIE DISSOLVED OXYGEN
     MONITORING PROGRAM
    T E C H N I C A L                                 R E P O R T

  Dissolved Oxygen and Temperature Profiles for the Open Waters of the
          Central Basin of Lake Erie during Summer/Fall of 2016

                                                                                            Prepared By:
                                                          United States Environmental protection Agency
   June 2021                                                         Great Lakes National Program Office
   EPA 950-R-21-004
JUNE 2021                                                                   PAGE | 1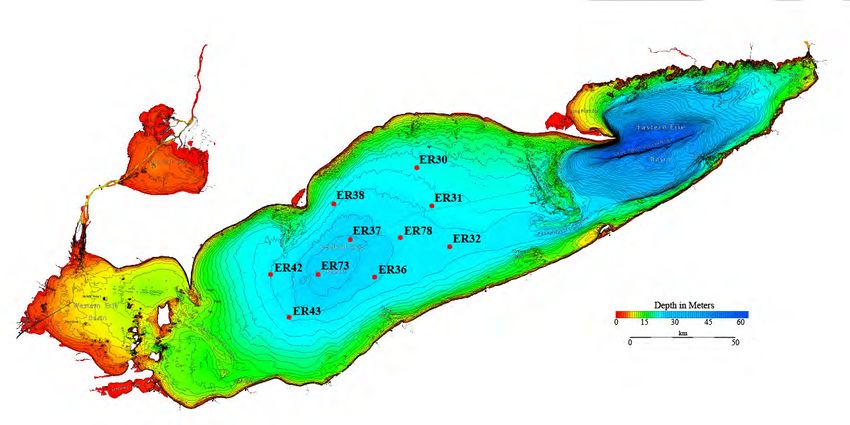
LAKE ERIE DISSOLVED OXYGEN MONITORING PROGRAM TECHNICAL REPORT

ACKNOWLEDGMENTS
This work was supported with Great Lakes Restoration Initiative (GLRI) funding to the U.S.
Environmental Protection Agency (EPA) Great Lakes National Program Office (GLNPO) as part of EPA
Contract No. EP-C-15-012, Technical, Analytical, and Regulatory Mission Support for the Water Security
Division, with CSRA LLC, a General Dynamics Information Technology company (hereinafter referred
to as “CSRA”), under the direction of Louis Blume, Project Manager. The United States Geological
Survey (USGS) supported this work via the USGS Great Lakes Deepwater Program supplemented with
GLRI funding through Interagency Agreement DW 014 92453901. Special thanks to the captains and
crews of the EPA R/V Lake Guardian and the USGS R/V Muskie for field support. We gratefully
acknowledge the support of the following team members in the preparation of this Technical Report:

 Affiliation                                        Team Members

 EPA GLNPO                                          Jeffery May, Louis Blume

 CSRA                                               Kathleen Marshall, Kenneth Miller

Cover photo: Wendy Luby.

Citation: U.S. EPA 2021. Lake Erie Dissolved Oxygen Monitoring Program Technical Report: Dissolved
Oxygen and Temperature Profiles for the Open Waters of the Central Basin of Lake Erie during
Summer/Fall of 2016. (EPA 950-R-21-004)

JUNE 2021                                                                                    PAGE | I
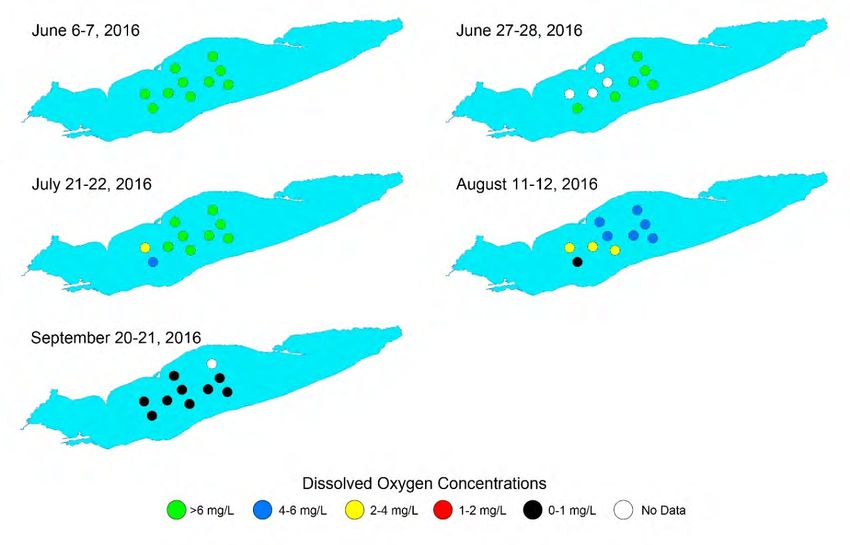
LAKE ERIE DISSOLVED OXYGEN MONITORING PROGRAM TECHNICAL REPORT

CORRIGENDUM
June 2021 update: Figure 1 on page 3 of the original version of this report (reproduced below, top)
contained two incorrectly labeled stations (ER73 and ER78 were labeled as “ER43”). Figure 1 has been
corrected on page 3 in this revised version of the report (reproduced below, bottom). The interpretation of
trends presented in this report is unchanged.
Original Figure 1:

Corrected Figure 1:

JUNE 2021                                                                                         PAGE | II
LAKE ERIE DISSOLVED OXYGEN MONITORING PROGRAM TECHNICAL REPORT

TABLE OF CONTENTS
Acknowledgments..........................................................................................................................................I
Corrigendum .................................................................................................................................................II
List of Tables .............................................................................................................................................. III
List of Figures............................................................................................................................................. III
1      Executive Summary .............................................................................................................................. 1
2      Introduction........................................................................................................................................... 1
3      Methods................................................................................................................................................. 2
4      Quality Assurance and Quality Control ................................................................................................ 4
5      Results and Discussion.......................................................................................................................... 5
6 Conclusions......................................................................................................................................... 11
References................................................................................................................................................... 12
Appendix A - Quality Control Results...................................................................................................... A-1

LIST OF TABLES
Table 1. Acceptance criteria for DO and temperature data......................................................................... 4
Table 2. Mean water temperature (± SD) and DO for each survey in 2016. ................................................ 6
Table 3. Generalized linear model (GLM) results for the relationships between SurveyDay and
hypolimnion temperature, thickness and DO concentration......................................................................... 9
Table 3a. Overall GLM results. .................................................................................................................... 9
Table 3b. GLM fit statistics. ......................................................................................................................... 9
Table 3c. GLM estimates of deviations in model intercept and slope used to calculate rate of
change in water temperature, thickness and DO concentration of the hypolimnion for years
2007-2015 compared to 2016 reference year.............................................................................................. 10
Table A-1. Quality control (QC) scorecard of 2016 CTD-collected temperature and dissolved
oxygen (DO) data not meeting acceptance criteria. .................................................................................. A-1

LIST OF FIGURES
Figure 1. Map of GLNPO dissolved oxygen (DO) monitoring stations in the central basin of
Lake Erie....................................................................................................................................................... 3
Figure 2. Example of a temperature and DO depth profile from Lake Erie central basin in
late summer................................................................................................................................................... 3
Figure 3. 2016 station means of hypolimnion DO concentrations in the central basin of Lake Erie. .......... 5
Figure 4. Hypolimnion temperatures in the central basin of Lake Erie from 2007-2016. ............................ 7
Figure 5. Hypolimnion thicknesses in the central basin of Lake Erie from 2007-2016. .............................. 8
Figure 6. Hypolimnion DO concentrations in the central basin of Lake Erie from 2007-2016.................... 8
Figure 7. Dissolved oxygen depletion rate in the central basin of Lake Erie from 1970-2016. ................ 11

JUNE 2021                                                                                                                                         PAGE | III
LAKE ERIE DISSOLVED OXYGEN MONITORING PROGRAM TECHNICAL REPORT

1 EXECUTIVE SUMMARY                                   2 INTRODUCTION
The United States Environmental Protection            Lake Erie has been severely impacted by
Agency (EPA) Great Lakes National Program             excessive anthropogenic loadings of
Office (GLNPO) Lake Erie Dissolved Oxygen             phosphorous resulting in abundant algal growth
Monitoring Program monitors the oxygen and            and is a factor that contributes to dissolved
temperature profiles at 10 stations in the central    oxygen (DO) depletion in the bottom waters of
basin of Lake Erie during the stratified season to    the central basin. Total phosphorus loads to
assess water quality trends and measure progress      Lake Erie reached their peak in the late 1960s
made in achieving water quality improvements.         and early 1970s with annual loads in excess of
                                                      20,000 metric tonnes per annum (MTA)
During the course of the 2016 sampling season
                                                      (Maccoux, et al., 2016). In 1978, Canada and the
(June 6 – September 21):
                                                      U.S. signed the Great Lakes Water Quality
•   Six surveys were conducted during the 2016        Agreement (GLWQA) which sought to reduce
    sampling season using the EPA R/V Lake            future phosphorus loadings to 11,000 MTA. In
    Guardian and USGS R/V Muskie.                     order to determine if the areal extent or duration
•   Surface water temperatures increased from         of the oxygen-depleted area was improving or
    15.1°C to 24.3°C, while hypolimnion               further deteriorating, annual monitoring of the
    temperatures increased from 8.6°C to 16.2°C.      water column for thermal structure and DO
•   Hypolimnion dissolved oxygen (DO)                 concentration was needed throughout the
    concentrations during the sampling season         stratified season. The U.S. Environmental
    decreased from approximately 10.5 mg O2/L         Protection Agency (EPA) Great Lakes National
    to 0.2 mg O2/L.                                   Program Office (GLNPO) established the Lake
•   Low DO conditions (< 6 mg O2/L) were first        Erie Dissolved Oxygen Monitoring Program in
    recorded at two stations on July 21-22, 2016.     1983. This program was designed to collect
•   Hypoxic conditions (< 2 mg O2/L) were first       necessary DO concentration data to calculate an
    recorded at one station on August 11-12, 2016.    annual normalized rate of DO depletion in the
    Low DO (< 6 mg O2/L) was observed at all          central basin of Lake Erie. Additionally, these
    other stations during this sampling event.        data could be used by federal and state water
•   Nine of the 10 stations were anoxic (< 1 mg       quality agencies to assess the effectiveness of
    O2/L) on September 20-21, 2016.                   phosphorus load reduction programs.
•   The annual corrected DO depletion rate was        Numerous phosphorus reduction programs were
    3.38 mg O2/L/month.                               implemented in support of the GLWQA, and by
When compared to the previous 10-year record,         the early 1980s, the annual phosphorus load to
the hypolimnion at the beginning of the 2016          Lake Erie had been reduced to near targeted
sampling season was similar in temperature, but       amounts (Dolan, 1993). Correspondingly, the
thicker and contained more DO. While surface          load reduction resulted in the decrease of the
water values are centrally located within the         total area affected by low oxygenated waters
observed range for the last 10 years, the             (Makarewicz and Bertram, 1991). By the mid-
hypolimnion temperature became one of the             1990s, the total extent of the hypoxic area (DO
warmest in recent years near the end of the season.   levels below 2 mg/L) had decreased such that
The corrected annual oxygen depletion rate            the total impacted area was smaller (in km2)
referenced above was slightly above the median        than had been observed in previous decades.
for the 2007-2016 time period and was similar to      However, by the 2000s the annual area affected
the 46-year long term average from 1970-2016.         by hypoxia had increased, returning to the larger
                                                      areal extent seen in the late 1980s (Zhou, et al.,
                                                      2013). The average hypoxic area in the central
                                                      basin since the early 2000s is approximately
                                                      4,500 km2 (1,737 mi2) (U.S.EPA, 2018), while
                                                      the largest hypoxic extent recorded in the past

JUNE 2021                                                                                      PAGE | 1
LAKE ERIE DISSOLVED OXYGEN MONITORING PROGRAM TECHNICAL REPORT
decade – 8,800 km2 (3,398 mi2) – occurred in
2012, following the record-setting algal bloom
3 METHODS
in 2011 (U.S. EPA, 2018). Annually, 10 sites (Figure 1) in the relatively
In 2012, the GLWQA was updated to enhance homogenous area of the central basin offshore
water quality programs to ensure the “chemical, waters (Lesht, et al., 2018) are sampled at
physical and biological integrity” of the Great approximately 3-week intervals, during the
Lakes (Canada and United States, 2012). As part of stratified season (June-October). Sampling usually
Annex 4 (Nutrients Annex) of this agreement, the begins in early June, when the water column
governments of the U.S. and Canada are required to begins to stratify, or separate, into a warmer upper
adapt the following Lake Ecosystem Objectives: layer (epilimnion) and a cooler bottom layer
(hypolimnion) and typically concludes in late
• minimize the extent of hypoxic zones in the September to mid-October just before the water
waters of the Great Lakes associated with column seasonally destratifies, or “turns over,”
excessive phosphorus loading, with particular and assumes a uniform temperature profile. The
emphasis on Lake Erie; EPA R/V Lake Guardian is used as the sampling
• maintain the levels of algal biomass below the platform whenever scheduling and other operating
level constituting a nuisance condition; constraints permit. In the event that the R/V Lake
• maintain algal species consistent with healthy Guardian is not available for one or more
aquatic ecosystems in the nearshore waters of scheduled sampling times, alternate vessel support
the Great Lakes; is used to conduct the sampling. For 2016, the
• maintain cyanobacteria biomass at levels that USGS R/V Muskie was used to conduct two
do not produce concentrations of toxins that surveys. At each station visit, the thermal structure
pose a threat to human or ecosystem health in of the water column is recorded by an electronic
the waters of the Great Lakes; profiling CTD (Conductivity, Temperature, Depth
• maintain an oligotrophic state, relative algal (pressure) sensor) while DO concentrations are
biomass, and algal species consistent with measured and recorded by an additional oxygen
healthy aquatic ecosystems, in the open waters sensor integrated into the CTD instrument
of Lakes Superior, Michigan, Huron and package. For 2016, a SeaBird Scientific SBE
Ontario; and 911plus CTD, SBE 19plus V2 SeaCAT Profiler
• maintain mesotrophic conditions in the open CTD and SBE 25plus Sealogger CTD were used
waters of the western and central basins of Lake for collecting water temperature data, while a
Erie, and oligotrophic conditions in the eastern SBE43 Dissolved Oxygen Sensor, which was
basin of Lake Erie. integrated into each of the SBE CTDs, was used
for collecting DO data. Comparison analyses using
GLNPO continues to monitor the thermal structure the standard QC criteria for the DO program are
and DO concentrations in the central basin of Lake conducted to ensure comparable data are being
Erie throughout the stratified season each year. collected between different instrumentation
This ensures that data are available to assess the whenever more than one SBE CTD is used during
objectives put forth in the GLWQA, but also allow a given season. Samples from each instrument are
for the evaluation of status and trends over time. assessed. The resulting temperature and DO depth
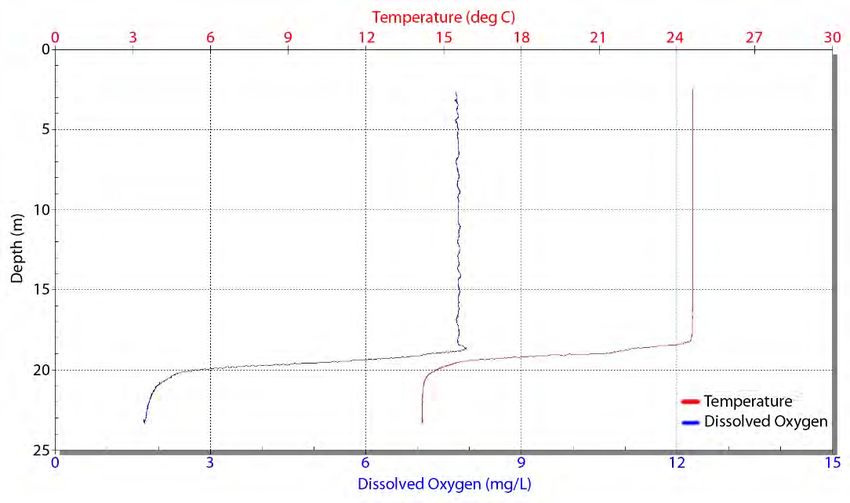
This report summarizes the results of the 2016 profiles, which provide a visual display of the
Lake Erie Dissolved Oxygen Monitoring Program thermal structure and DO content of the water
surveys and places those results within the context (Figure 2), are used for calculating the annual DO
of historical data. depletion rate (U.S. EPA, 2016).
JUNE 2021 PAGE | 2LAKE ERIE DISSOLVED OXYGEN MONITORING PROGRAM TECHNICAL REPORT Figure 1. Map of GLNPO dissolved oxygen (DO) monitoring stations in the central basin of Lake Erie. Quality Assurance samples are collected at two of samples collected at 2 meters below the surface the 10 stations during each survey and used to and at 1 meter above the lake bottom. Temperature confirm the accuracy of the sensor measurements. measurements from the sensor are compared to Dissolved oxygen measurements from the sensor surface water thermometer readings obtained from are compared to those determined by the Winkler the hull mounted transducer on the research vessel. micro-titration method (U.S. EPA, 2016) for water Figure 2. Example of a temperature and DO depth profile from Lake Erie central basin in late summer. JUNE 2021 PAGE | 3
LAKE ERIE DISSOLVED OXYGEN MONITORING PROGRAM TECHNICAL REPORT

After each survey, water temperature and DO
concentration data from the CTDs are averaged for
                                                       4 QUALITY ASSURANCE AND
the epilimnion and hypolimnion. A grand mean of             QUALITY CONTROL
hypolimnion DO concentration is calculated for
                                                       GLNPO’s DO monitoring surveys operate under
each station to generate a map of bottom DO
                                                       an approved Quality Management Plan (QMP), a
concentrations for the central basin of Lake Erie at
                                                       Quality Assurance Project Plan (QAPP), and
the time of sampling.
                                                       standard operating procedures (SOP) (U.S. EPA,
To reduce the amount of inter-annual variability in    2014). In 2016, QAPP Revision 09, dated March
DO data from Lake Erie, an annual corrected            2016, was used. The overall quality objective for
oxygen depletion rate is calculated using a            this project is to acquire measurements of DO and
Microsoft Access program                               temperature at the central basin stations in Lake
(LakeErieDOv05.mdb). This software statistically       Erie that are representative of the actual conditions
adjusts the data for vertical mixing and seasonable    present at the time of sampling.
variability and normalizes it to a constant
                                                       Acceptance criteria for DO and temperature
temperature and hypolimnion thickness according
                                                       (Table 1) are based on the Relative Percent
to the procedures used by Rosa and Burns (1987).
                                                       Difference (RPD) between two independently
The resultant or “corrected” annual rate of DO
                                                       derived measurements. By definition, RPD is
depletion (mg O2/L/month) is artificial for any
                                                       the difference between two measurements
given year, but permits the identification of time
                                                       divided by the average of both and expressed as
trends with more precision.
                                                       a percent value.
For comparisons between years, results over a 10-
                                                       The accuracy criteria for acceptable DO
year period (2007-2016) were compared
                                                       measurements is an RPD of 10% between sensor
statistically using a general linear model (GLM)
                                                       and averaged Winkler values or an absolute
approach to test whether there is a significant
                                                       difference between measurement methods of 0.5
difference in the relationship between time
                                                       mg/L when DO concentrations are less than 5
(expressed as Julian day minus 150 to place the y-
                                                       mg/L. A maximum RPD of 2% is the acceptable
intercept near the beginning of the sampling
                                                       accuracy for water temperature. Acceptable levels
period; referred to as SurveyDay in Table 3) and
                                                       of precision are defined as a maximum difference
either hypolimnion temperature, thickness or DO
                                                       of 0.2 mg/L between Winkler replicates and
concentration (Tables 3a, 3b and 3c). This
                                                       agreement within 5% between sensor
approach assumes a constant rate of change per
                                                       measurements for DO. Acceptable precision for
day in the unadjusted measurements (i.e.,
                                                       water temperature was defined as agreement
hypolimnion temperature, thickness and DO) over
                                                       within 2% between sensor measurements.
the full June to October sampling period within
each year, which differs slightly from the Rosa        Table 1. Acceptance criteria for DO and
and Burns (1987) method that only assumes a            temperature data.
constant rate of change between sampling events,
                                                                        Accuracy           Precision
but not across the entire sampling period. The          Parameter
                                                                         criteria           criteria
GLM model includes a separate factor for the
sampling year, and a Julian day x year interaction                                   • 2% between sensor
                                                        Temperature     2% RPD
term, which is used to test whether the rate of                                        measurements
change in the hypolimnion temperature, thickness        Dissolved
or DO varies significantly between years (i.e.,         oxygen          10% RPD
whether the estimated slope varies between years).                                   • 0.2 mg/L between
                                                        (≥ 5 mg/L)                     Winkler replicates
Statistical significance of the GLM model tests
                                                        Dissolved       0.5 mg/L     • 5% between sensor
was set at alpha=0.05. Statistical analysis was
                                                        oxygen           absolute      measurements
performed using the GLM procedure in SAS
Version 9.4 (SAS Institute, Cary, NC).                  (< 5 mg/L)      difference

JUNE 2021                                                                                          PAGE | 4
LAKE ERIE DISSOLVED OXYGEN MONITORING PROGRAM TECHNICAL REPORT
For this project, completeness is the measure of 10.5 mg O2/L during the first survey to 8.1 mg
the number of samples obtained compared to the O2/L in the epilimnion and to 0.2 mg O2/L in the
number that was expected to be obtained under hypolimnion at the end of the sampling season.
normal conditions. The completeness goal is to
Low DO concentrations (< 6 mg O2/L) in the
obtain DO and water temperature profiles within
hypolimnion were first detected at the two western-
accuracy and precision limits at 90% of all
most sampling stations (ER42 and ER43) during
designated stations during each survey.
the July 21-22 cruise (Figure 3). By mid-August, all
stations had DO concentrations below 6 mg O2/L,
5 RESULTS AND DISCUSSION and one station had become anoxic (ER43, < 1 mg
During the first survey (June 6-7, 2016), all O2/L). By the September 20-21 survey, all stations,
stations were stratified with an average except one (ER30), were experiencing anoxic
temperature difference of nearly 6.5°C between conditions (Figure 3). However, during this survey,
the epilimnion and hypolimnion layers, and most the hypolimnion at four stations (ER30, ER32,
stations remained stratified throughout the ER36 and ER43) was very thin (≤ 1.0 m), making it
sampling period (Table 2). Over the sampling difficult to position the CTD (Conductivity,
season, average temperatures increased in the Temperature, Depth (pressure) sensor) within this
epilimnion from 15.1°C to 24.3°C and in the water layer. As such, ER30 may also have been
hypolimnion from 8.6°C to 16.2°C. Average anoxic, but due to a very deep thermocline present
dissolved oxygen (DO) concentrations during the at this site, the hypolimnion (if one was present)
sampling season decreased from approximately was not able to be sampled, resulting in no data.
Figure 3. 2016 station means of hypolimnion DO concentrations in the central basin of Lake Erie.
JUNE 2021 PAGE | 5LAKE ERIE DISSOLVED OXYGEN MONITORING PROGRAM TECHNICAL REPORT
Table 2. Mean water temperature (± SD) and DO for each survey in 2016.*
Epilimnion Hypolimnion
N
2016 Survey Dates CTD Used Temperature DO Temperature DO Thickness
(#)
(°C) (mg/L) (°C) (mg/L) (m)
June 6-7 SBE 911+ 10 15.05 ± 0.77 10.47 ± 0.25 8.63 ± 0.18 10.55 ± 0.63 8.71 ± 1.54
June 27-28 SBE 25 6 19.19 ± 0.43 8.02 ± 0.43 9.82 ± 0.37 8.52 ± 0.65 5.51 ± 1.20
July 21-22 SBE 911+ 10 22.55 ± 0.91 8.61 ± 0.28 11.22 ± 0.74 7.55 ± 2.11 4.92 ± 2.82
August 11-12 SBE 911+ 10 24.32 ± 1.18 8.36 ± 0.28 11.53 ± 0.82 3.94 ± 1.53 4.83 ± 1.18
September 6-7 SBE 19 0 ND ND ND ND ND
September 20-21 SBE 911+ 9 23.02 ± 0.49 8.08 ± 0.25 14.47 ± 0.69 0.21 ± 0.23 2.49 1.95
*
N indicates the number of stations used to calculate survey averages; ND indicates no data available.
COMPARISON TO HISTORICAL RESULTS period. Not only does a thicker hypolimnion
contain a greater quantity of DO, but it has also
Over the course of the summer, DO levels in the
been shown to be associated with an overall
bottom waters of Lake Erie’s central basin steadily
slower depletion rate (Charlton, 1980; Bouffard,
decline (Burns, et al., 2005). Variability in the rate
2013). However, by the end of the season, the
of DO depletion, its severity, and its duration are
hypolimnion was one of the thinnest observed
related to year-to-year differences in the thickness
(Figure 5). The rate of change in hypolimnion
and temperature of the bottom water layer, as well
thickness varied significantly between years
as winter ice coverage. Year-to-year differences in
(Table 3b), with the hypolimnion thickness
the hypolimnion characteristics are determined by
decreasing faster in 2016 than for all years prior to
the weather over Lake Erie in the spring (i.e.,
2013 other than 2010 (Table 3c).
average air temperature and wind velocity).
Rapidly climbing air temperature with calm winds The average hypolimnion oxygen concentration at
will result in a thinner, warmer epilimnion and a the start of the 2016 season was one of the highest
thicker, cooler hypolimnion that retains more DO concentrations observed over the 10-year period
longer into the season. A cooler, windy spring will (Figure 6). It remained relatively high throughout
permit the entire water column to warm before the most of the season, dropping to 2 mg O2/L at the
lake stratifies, resulting in a deeper thermocline third latest date over the 10-year period
depth and a warm, thin hypolimnion that is more (approximately September 1st). The rate of change
prone to oxygen depletion earlier in the season for unadjusted DO did not vary significantly
(Conroy, et al., 2011). Furthermore, reduced ice between years (Table 3b).
coverage over the winter will result in earlier
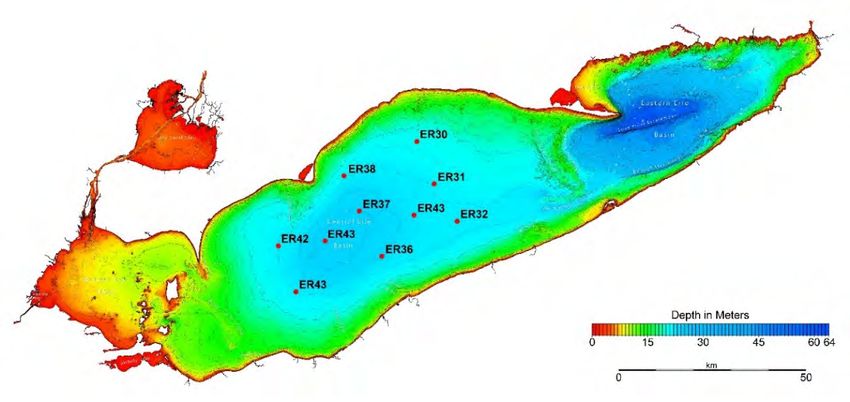
The corrected annual oxygen depletion rate for
springtime mixing and a longer stratification
2016 was 3.38 mg O2/L/month (Figure 7). This is
period, thus increasing the risk of oxygen
fairly typical, approximately 0.08 mg O2/L/month
depletion in the hypolimnion (Perello, 2017).
above the median for the 2007-2016 time period.
In 2016, the hypolimnetic temperature remained The June 27-28 and September 6-7 survey data
near the previous 10-year average through most of were not included in the 2016 oxygen depletion
the season; however, by the end of the season rate analysis.
temperature had increased to one of the highest
In 2016, there were three surveys for which data
levels observed over this time period (Figure 4).
were either not collected or failed QA checks (as
The rate of change in hypolimnion temperature
described in Table A-1 of Appendix A), which
varied significantly between years (Table 3b), with
limited their use in trend analysis. During the June
the hypolimnion temperature increasing
27-28 survey, no QC samples were collected.
significantly faster in 2016 than in 2008, 2009,
Therefore, the SeaBird data values could not be
2011, 2012 and 2014 (Table 3b, 3c).
evaluated to ensure the instrumentation was
At the start of the 2016 season, the hypolimnion functioning properly and within acceptance limits.
was one of the thickest observed over the 10-year No data were available for the September 6-7
JUNE 2021 PAGE | 6LAKE ERIE DISSOLVED OXYGEN MONITORING PROGRAM TECHNICAL REPORT
survey due to the instrumentation not functioning data were collected. Data from the ER30 (Figure
properly. The new SeaBird used during this survey 1), during the September 20-21 survey could not
was not set up correctly; the minimum be included, as hypolimnion values were not
conductivity required to turn on the water pump sampled due to the absence of the hypolimnion at
was set to a value appropriate for seawater. As that station.
such, the water pump never turned on and no valid
17
15
2007
13 2008
Temperature (C)
2009
2010
11
2011
2012
9 2013
2014
2015
7 2016
5
145 165 185 205 225 245 265
Julian Day
Figure 4. Hypolimnion temperatures in the central basin of Lake Erie from 2007-2016.
JUNE 2021 PAGE | 7LAKE ERIE DISSOLVED OXYGEN MONITORING PROGRAM TECHNICAL REPORT
14
12
10 2007
2008
Thickness (meters)
2009
8
2010
2011
6
2012
2013
4 2014
2015
2 2016
0
145 165 185 205 225 245 265
Julian Day
Figure 5. Hypolimnion thicknesses in the central basin of Lake Erie from 2007-2016.
12
10
2007
Dissolved Oxygen (mg/L)
8 2008
2009
2010
6
2011
2012
4 2013
2014
2015
2 2016
0
145 165 185 205 225 245 265
Julian Day
Figure 6. Hypolimnion DO concentrations in the central basin of Lake Erie from 2007-2016.
JUNE 2021 PAGE | 8LAKE ERIE DISSOLVED OXYGEN MONITORING PROGRAM TECHNICAL REPORT
Table 3. Generalized linear model (GLM) results for the relationships between SurveyDay and hypolimnion temperature, thickness and DO concentration.
In the model, the SurveyDay term is defined as Julian day minus 150 to place the y-intercept near the beginning of the sampling period. The GLM model includes
a separate factor for the sampling year, and a Julian day x year interaction term, which is used to test whether the rate of change in the hypolimnion temperature,
thickness or DO varies significantly between years (i.e., whether the estimated slope varies between years). Statistical significance of the GLM model tests was set
at alpha=0.05.
Table 3a. Overall GLM results.
Temperature Thickness DO concentration
Source DF Sum of Mean F Sum of Mean Sum of Mean
p-value R2† F statistic p-value R2 F statistic p-value R2
Squares Square statistic * Squares Square Squares Square
Model 19 232.64 12.24 64LAKE ERIE DISSOLVED OXYGEN MONITORING PROGRAM TECHNICAL REPORT
Table 3c. GLM estimates of deviations in model intercept and slope used to calculate rate of change in water temperature, thickness and DO concentration of the
hypolimnion for years 2007-2015 compared to 2016 reference year.
Temperature (˚C) Thickness (m) DO concentration (mg/L)
Parameter
#
Estimate Standard Error T statistic p-value Estimate Standard Error T statistic p-value Estimate Standard Error T statistic p-value
Intercept in 2016 7.7807 0.4243 18.34LAKE ERIE DISSOLVED OXYGEN MONITORING PROGRAM TECHNICAL REPORT
Oxygen Depletion Rate (mg O2/L/Month) 5
4
3
2
1
0
1970 1975 1980 1985 1990 1995 2000 2005 2010 2015
Year
Figure 7. Dissolved oxygen depletion rate in the central basin of Lake Erie from 1970-2016.
Data sources: Burns et al. (2005) and EPA GLNPO (unpublished).
years. The 2016 hypolimnion was the second
6 CONCLUSIONS thickest at the start of the sampling season, but by
The U.S. EPA GLNPO Lake Erie Dissolved Oxygen the end of the season it was one of the thinnest
Monitoring Program monitors the oxygen and (see Figure 5). Consequently, oxygen
temperature profiles at 10 stations in the central basin concentrations decreased during the season from
of Lake Erie to assess water quality trends and approximately 10.5 mg O2/L to 8.1 mg O2/L in the
measure progress made in achieving water quality epilimnion and to 0.2 mg O2/L in the hypolimnion.
improvements. Six surveys were conducted in 2016 Low-oxygen conditions (< 6 mg O2/L) were
from June 6 to September 21 (Table 2); however, recorded in the hypolimnion at two western
data from two of these surveys did not meet the stations in July and at all stations in August.
QAPP requirement for completeness due to Hypoxic hypolimnion conditions (< 2 mg O2/L)
instrumentation issues during those surveys (i.e., were recorded at one western station in August
June 27-28 and September 6-7 surveys). and at all stations meeting acceptance criteria in
late September (n=9). Compared to the previous
When compared to the previous 10-year record 10-year period (2007-2015), the average
(2007-2015), the hypolimnion at the beginning of hypolimnion oxygen concentration for 2016 was
the 2016 sampling season was similar in the second highest at the beginning of the
temperature, but thicker and contained more sampling season and remained at higher levels
dissolved oxygen (DO). Water temperatures throughout the season, not dropping to 2 mg O2/L
increased from 15.1°C to 24.3°C in the epilimnion until the third latest date for this time period (see
and from 8.6°C to 16.2°C in the hypolimnion Figure 6). The corrected annual oxygen depletion
during the sampling season. These temperature rate for 2016 was 3.38 mg O2/L/month, which was
values are centrally located within the observed slightly above the median for the 2007-2016 time
range for the last 10 years (see Figure 4); however, period and was similar to the 46-year long term
near the end of the season, the hypolimnion average from 1970-2016 (Figure 7).
temperature became one of the warmest in recent
JUNE 2021 PAGE | 11LAKE ERIE DISSOLVED OXYGEN MONITORING PROGRAM TECHNICAL REPORT
REFERENCES
Bouffard, D., J.D. Ackerman, and L. Boegman. 2013. Factors Affecting the Development and Dynamics
of Hypoxia in a Large Shallow Stratified Lake: Hourly to Seasonal Patterns. Water Resources
Research. 49(5): 2380-2394.
Burns, N.M., D.C. Rockwell, P.E. Bertram, D.M. Dolan and J.J. Ciborowski. 2005. Trends in Temperature,
Secchi Depth, and Dissolved Oxygen Depletion Rate in the Central Basin of Lake Erie, 1983-2002. J.
Great Lakes Res. 31 (Supplement 2): 35-49.
Canada and United States. 2012. Protocol Amending the Agreement Between Canada and the United
States of America on Great Lakes Water Quality, 1987.
Charlton, M.N. 1980. Hypolimnion Oxygen Consumption in Lakes: Discussion of Productivity and
Morphometry Effects. Can. J. Fish. Aquat. Sci. 37(10): 1531-1539.
Conroy, J.D., L. Boegman, H. Zhang, W.J. Edwards, and D. A. Culver. 2011. “Dead Zone” Dynamics in
Lake Erie: the Importance of Weather and Sampling Intensity for Calculated Hypolimnetic
Oxygen Depletion Rates. Aquat. Sci. (2011) 73:289-304.
Dolan, D.M. 1993. Point Source Loadings of Phosphorus to Lake Erie: 1986-1990. J. Great Lakes Res.,
19(1993). Pp. 212-223.
Lesht, B.M., R.P Barbiero and G.J. Warren. 2018. Using Satellite Observations to Assess the Spatial
Representativeness of the GLNPO Water Quality Monitoring Program. J. Great Lakes Res.
44(2018): 547-562.
Maccoux, M.J., A. Dove, S.M. Backus, and D.M. Dolan. 2016. Total and Soluble Reactive Phosporus
Loadings to Lake Erie. A Detailed Accounting by Year, Basin, Country and Tributary. J. Great
Lakes Res. 42(2016): 1151-1165.
Makarewicz, J.C. and P.E. Bertram. Evidence for the Restoration of the Lake Erie Ecosystem – Water Quality,
Oxygen Levels, and Pelagic Function Appear to be Improving. Bioscience. 1991. 41(4), 216-223.
Perello, M. M., D. D Kane, P. Golnick, M.C Hughes, M.A Thomas, and J.D. Conroy. 2017. Effects of
Local Weather Variation on Water-Column Stratification and Hypoxia in the Western, Sandusky,
and Central Basins of Lake Erie. Water, 9(4), 279-291. https://doi.org/10.3390/w9040279
Rosa, F. and N.M. Burns. 1987. Lake Erie Central Basin Depletion Changes from 1929-1980. J. Great
Lakes Res. 13(4):684-696.
U.S. Environmental Protection Agency (U.S. EPA). 2014. United States Environmental Protection
Agency Region 5, Quality Management Plan.
U.S. Environmental Protection Agency (U.S. EPA). 2016. Dissolved Oxygen and Temperature Profiles
for the Central Basin of Lake Erie Quality Assurance Project Plan Revision 09, dated March
2016. U.S. EPA Great Lakes National Program Office.
U.S. Environmental Protection Agency (U.S. EPA). 2018. U.S. Action Plan for Lake Erie. Retrieved from
https://www.epa.gov/sites/production/files/2018-03/documents/us_dap_final_march_1.pdf.
Zhou, Y., D.R Obenour, D. Scavia, T.H Johengen, and A.M. Michalak. 2013. Spatial and Temporal
Trends in Lake Erie Hypoxia, 1987-2007. Environ. Sci. Technol. 47(2): 899-905.
JUNE 2021 PAGE | 12LAKE ERIE DISSOLVED OXYGEN MONITORING PROGRAM TECHNICAL REPORT
APPENDIX A - QUALITY CONTROL RESULTS
A summary of 2016 results not meeting acceptance criteria is provided in the table below.
Table A-1. Quality control (QC) scorecard of 2016 CTD-collected temperature and dissolved oxygen (DO) data not meeting acceptance criteria.
Survey Issue Cause Decision Corrective Actions
Accuracy of CTD DO data was Adhere to QAPP and SOPs.
No water samples were collected.
not assessed Caution should be used with this
June 27-28
Data were not collected at 4 stations due dataset. This CTD was not used during the rest of
Incomplete dataset
to malfunctioning CTD. the season.
The hypolimnion was less than 2m thick Changes to sampling methodology are
at one of the stations sampled (ER32), so being considered to move water sampling
DO accuracy check exceeded thermocline/epilimnion waters may have container to the same height as CTD.
QC criterion been in the water sample. All data are considered acceptable Currently the Niskin bottle on the Rosette
The surface water sample at this station because failures were likely caused Sampler may be collecting water up to 1
Aug 11-12 met the QC criterion. by water sampling and analytical m away from the CTD.
error that would not have impacted
An inexperienced technician ran Winkler CTD DO data. Exploring the possibility of incorporating
Winkler precision check analyses on one station which may have an automatic titration system to reduce
exceeded the QC criterion resulted in the greater variability in these subjectivity differences between
two samples. technicians.
Accuracy of CTD DO data was
No water samples were collected. Adhere to QAPP and SOPs.
not assessed No DO data are acceptable because
Sept 6-7 instrumentation did not function
properly. Minimum conductivity frequency for
The DO pump on the CTD did not turn on
Incomplete dataset pump turn on was changed to appropriate
during any of the casts.
freshwater value.
Changes to sampling methodology are
The hypolimnion thickness was only 0.7
All data are considered acceptable being considered to move water sampling
m and 2.1 m at two of the sampled
DO accuracy check exceeded because failures were likely caused container to the same height as CTD.
Sept 20-21 stations (ER32 and ER42, respectively),
QC criterion by water sampling error that would Currently the Niskin bottle on the Rosette
so thermocline/epilimnion waters may
not have impacted CTD DO data. Sampler may be collecting water up to 1
have been in the water sample.
m away from the CTD.
JUNE 2021 PAGE | A-1You can also read