Looking at the Bright Side: The Motivation Value of Overconfidence - Si Chen, Hannah Schildberg-Hörisch - DICE
←
→
Page content transcription
If your browser does not render page correctly, please read the page content below
No 291

         Looking at the Bright Side:
         The Motivation Value
         of Overconfidence

         Si Chen,
         Hannah Schildberg-Hörisch
         May 2018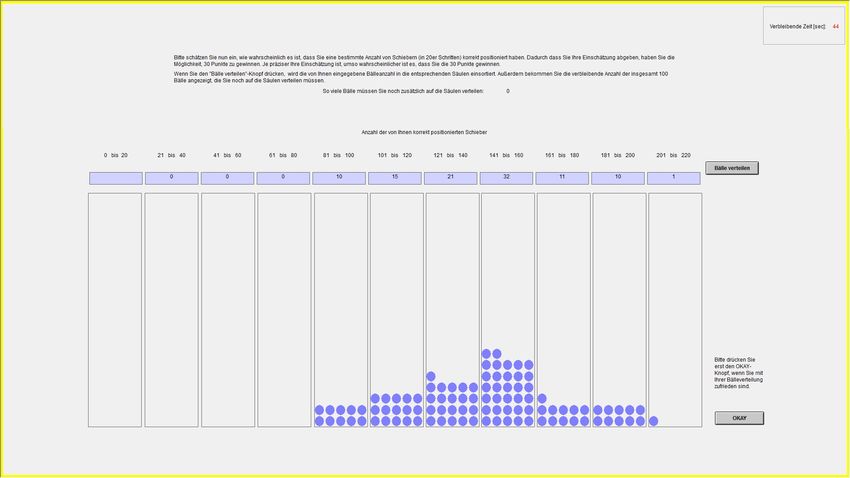
IMPRINT

DICE DISCUSSION PAPER

Published by

düsseldorf university press (dup) on behalf of
Heinrich‐Heine‐Universität Düsseldorf, Faculty of Economics,
Düsseldorf Institute for Competition Economics (DICE), Universitätsstraße 1,
40225 Düsseldorf, Germany
www.dice.hhu.de

Editor:

Prof. Dr. Hans‐Theo Normann
Düsseldorf Institute for Competition Economics (DICE)
Phone: +49(0) 211‐81‐15125, e‐mail: normann@dice.hhu.de

DICE DISCUSSION PAPER

All rights reserved. Düsseldorf, Germany, 2018

ISSN 2190‐9938 (online) – ISBN 978‐3‐86304‐290‐5

The working papers published in the Series constitute work in progress circulated to
stimulate discussion and critical comments. Views expressed represent exclusively the
authors’ own opinions and do not necessarily reflect those of the editor.
Looking at the Bright Side:
                  The Motivation Value of Overconfidence
                                                     Si Chen∗

                                     Bonn Graduate School of Economics

                                         Hannah Schildberg-Hörisch†

                         Düsseldorf Institute for Competition Economics and IZA

                                                    May 2018

                                                    Abstract

            The motivation value of confidence postulates that individual effort provision is increasing
        in beliefs on one’s own productivity. This relationship also holds for overconfident individuals
        who have exaggerated productivity beliefs (motivation value of overconfidence). We present first
        empirical evidence on the existence of a motivation value of absolute overconfidence that many
        microeconomic models build on. Moreover, we document that debiasing information increases the
        accuracy of productivity beliefs of overconfident individuals but comes at the cost of diminished
        effort provision – a result that is of obvious relevance for many contexts such as labor relations or
        learning at school. As a further conceptual contribution, we offer a novel strategy for identifying
        significant overconfidence at the individual level.
            JEL Classification: C91; D91
            Keywords: overconfidence; effort provision; laboratory experiment

   ∗
       Address: Bonn Graduate School of Economics (BGSE), Kaiserstrasse 1, 53113, Bonn, Germany, email: sichen@uni-
bonn.de
   †
     Address: Düsseldorf Institute for Competition Economics (DICE), Heinrich-Heine-Universität Düsseldorf, Oeco-
nomicum, 34.31, Universitätsstr. 1, 40225, Düsseldorf, Germany, email: schildberg-hoerisch@dice.hhu.de

                                                         1
1. Introduction
Overconfidence is a widespread and well-documented phenomenon (Plous, 1993, Alicke and Govorun,
2005, Moore and Healy, 2008, Skala, 2008). It refers to an overestimate of one’s own ability or
productivity.1 Empirical evidence on the consequences of overconfidence highlights diverse negative
implications. For example, overconfident individuals tend to underestimate personal risks and hence
are more likely to engage in poor financial planning, physically damaging behaviors, and risky
driving (e.g. Davidson and Prkachin, 1997, Benartzi, 2001, Bhattacharya, Goldman, and Sood,
2004, Sandroni and Squintani, 2007). Overconfident managers are prone to corporate investment
distortions (Malmendier and Tate, 2005), value-destroying mergers (Malmendier and Tate, 2008),
and debt conservatism (Malmendier, Tate, and Yan, 2011). In experimental financial markets,
overconfidence causes excess entry in competitive markets (Camerer and Lovallo, 1999) and reduces
the trading performance (Biais et al., 2005). Overconfident individuals are also more likely to
self-select into competition, even when their performance is poor so that they should not enter
competition (Bartling et al., 2009, Dohmen and Falk, 2011, Danz, 2014). However, some empirical
evidence stresses benefits of overconfidence as well. For example, overconfidence can lead to higher
social status (Kennedy, Anderson, and Moore, 2013) and overconfident individuals are better able to
persuade others (Schwardmann and van der Weele, 2016). Galasso and Simcoe (2011) and Hirshleifer,
Low, and Teoh (2012) show that overconfident CEOs are more likely to pursue innovations.
In this paper, we empirically investigate a further possible consequence of overconfidence that has
attracted particular attention by a growing number of microeconomic models (Bénabou and Tirole,
2002, Compte and Postlewaite, 2004, Gervais and Goldstein, 2007, Krähmer, 2007, Ludwig, Wichardt,
and Wickhorst, 2011): the motivation value of overconfidence. The motivation value of overconfidence
postulates that individuals with higher beliefs on their own ability, even the overconfident ones,
will exert higher effort if effort and ability are complements. Intuitively, individuals with higher
beliefs on their own ability anticipate greater return to effort and hence work harder. Whether this
implication holds true empirically is not obvious though: the less confident might work harder in
the hope of compensating their (perceived) lack of ability by extra effort, while the overconfident
may become smug and slack. This intuition is formally captured by models that build on satisficing
instead of optimizing behavior as introduced by Simon (1955): if individuals are satisficers who
1
In this paper, we investigate the consequences of absolute overconfidence or overestimation, i.e. an overestimate of
one’s own productivity compared to an objective measure of it. In contrast, relative overconfidence or overplacement
refers to an overestimate of oneself relative to others (Moore and Healy, 2008).
2stop an activity as soon as their reach their individual, less-than-maximum target utility level, more
confident individuals are predicted to exert less effort, ceteris paribus. Since the concept of satisficing
was introduced by Simon (1955), it has been applied to a wide range of contexts such as behavioral
theories of the firm (Cyert and March, 1992) and has stimulated models of incomplete preferences,
models of behavior under ambiguity, theories of rational inattention and search theories (compare
Hey, Permana, and Rochanahastin (2017) and the references cited therein). In psychology, satisficing
is considered a heuristic that is ecologically rational, i.e. that, in particular decision environments,
can outperform alternative, rational decision strategies (Gigerenzer and Goldstein, 1966). Empirical
evidence in line with satisficing as opposed to optimizing behavior in work contexts and risky choice
has been documented for students, cab drivers, farmers and managers alike (Camerer et al., 1997,
Payne, Laughhunn, and Crum, 1980, 1981, Lopes, 1987). For example, cab drivers seem to set a
loose daily income target and quit working once they have reached that target (Camerer et al., 1997).
The prominence of the motivation value of overconfidence as a basic ingredient of microeconomic
models with overconfident agents contrasts a lack of empirical evidence in favor of it. As a first
contribution, our paper aims at closing that gap by providing an empirical test of the motivation
value of overconfidence, using a laboratory experiment. Moreover, we test an important implication of
the motivation value of overconfidence, namely that informing overconfident individuals about their
own productivity will reduce their effort provision. We hypothesize that such de-biasing information
will lead to a downward adjustment in productivity beliefs, which in turn, will decrease overconfident
individuals’ effort provision. Finally, we move beyond existing research on overconfidence by offering
a new empirical strategy to identify significant absolute overconfidence at the individual level. It
is based on a definition of absolute overconfidence that allows for probabilistic beliefs on one’s
own productivity (as opposed to point beliefs) and acknowledges that observational measures of
productivity are noisy albeit informative about the actual underlying productivity. Combining these
two insights, we define an individual as overconfident if the median of her belief distribution exceeds
the upper limit of the 95% confidence interval around her actual underlying productivity, which
we construct based on noisily measured productivity. This definition implies that overconfident
individuals assign more than 50% probability mass of the belief distribution to productivity levels
higher than their actual productivity. In other words, they believe that it is more likely that they
have a higher productivity than their true productivity than vice versa.
We first present a model that isolates the motivation value of confidence in the most simple,
non-strategic setup. From the model, we derive two hypotheses: First, there is a motivation value
3of confidence, i.e. individuals with a higher belief on their own productivity exert higher effort.
This relationship also holds for overconfident individuals who have exaggerated productivity beliefs.
Second, informing overconfident subjects about their own productivity will decrease their effort
provision.
We then proceed by testing the two hypotheses in a laboratory experiment with 5 stages. Stage
1 measures individual productivity in a modified version of the slider task proposed by Gill and
Prowse (2018). The task does not allow subjects to perfectly monitor their own productivity, which
offers scope for over- or underconfidence. In stage 2, subjects’ probabilistic beliefs on their own
productivity in stage 1 are elicited using a visualized “ball allocation task”. In the ball allocation
task, subjects are asked to allocate 100 balls that each represent one percentage point probability
into 11 bins that illustrate intervals of increasing productivity. Combining the data on observed
productivity from stage 1 and median productivity beliefs from stage 2, we can identify overconfident
subjects. In stage 3, subjects are randomly assigned to the treatment with information (INFO) or
the treatment with no information (NOINFO) about their own productivity in stage 1. In stage 4,
subjects work on the same real effort task as in stage 1. They can, however, choose individually
how much effort to exert by stopping working on the task. Finally, in stage 5 we again use the ball
allocation task to elicit subjects’ belief distributions on their productivity in stage 4.
In line with the motivation value of confidence, we find that subjects with a higher belief on
their own productivity exert higher levels of effort in stage 4. This relationship also holds and is
particularly strong for overconfident subjects (motivation value of overconfidence). The exogenous
variation in information provision across treatments INFO and NOINFO provides causal evidence
that informing overconfident subjects about their own productivity results in a downward adjustment
of their productivity beliefs and lower effort provision.
Our results provide an empirical backing for decision theoretic models in which the motivation
value of overconfidence serves as a key mechanism through which enhanced effort provision can
compensate the suboptimal individual decision making accompanying overconfidence. For example,
Bénabou and Tirole (2002) emphasize that overconfidence in one’s chance of success can mitigate less
than optimal effort provision due to weak willpower and show that it can be optimal to maintain an
upwardly-biased confidence level. Compte and Postlewaite (2004) model an agent whose probability
of success in a sequence of tasks and the likelihood of undertaking a task are increasing functions of
her confidence. They show that the agent is better off when she is moderately overconfident because
the gain from enhanced performance offsets the loss of the suboptimal decision to undertake the task.
4Other models rely on the motivation value of overconfidence as a basic ingredient when studying
interactions of overconfident agents. Gervais and Goldstein (2007) focus on a firm with complementary
effort among agents. The synergy between agents makes the existence of an overconfident agent who
exerts more effort beneficial for the entire firm. In a similar vein, Ludwig, Wichardt, and Wickhorst
(2011) model team work with two agents whose efforts are complements in a joint project. An
overconfident agent engaging in excessive effort provision can improve the welfare of both agents by
encouraging the unbiased agent to also exert higher effort. Analysing repeated contests, Krähmer
(2007) shows that a contestant who is overly confident in her relative ability exerts more effort, and
thus wins more often in contests, which reinforces the biased judgment. As a result, a worse but
overconfident contestant and her overconfidence can prevail in contests in the long run.
Our findings also contribute to the empirical literature on the consequences of overconfidence
and add insights on factors that motivate effort (DellaVigna and Pope, 2017). In particular, our
results suggest boosting confidence as an effective and potentially cost-efficient way to enhance effort
provision.2 The negative impact of de-biasing information on the effort provision of overconfident
individuals is of obvious relevance in diverse principal-agent contexts such as interactions between
employers and employees or teachers and students. For example, employers could restrain from
providing accurate feedback to an overconfident employee in order to continue benefiting from her
exaggerated effort provision. Our findings also offer an explanation for why teachers are often
reluctant or, for younger students, sometimes even prohibited to provide clear-cut, but possibly
worse than expected feedback on students’ skills, namely to avoid demotivating their students in
future learning efforts. In a recent study, Fischer and Sliwka (forthcoming) show that students with
higher beliefs in their learning ability indeed invest more in learning material when preparing for a
test. Their experiment on the implications of relative confidence for learning dynamics focuses on
the distinction between confidence in (the stock of) knowledge and confidence in the ability to learn.
In contrast, we focus on the relation between absolute overconfidence, debiasing information and
effort provision using a real effort task which has no scope for learning (increasing ability) over time
– a setup that is closer to the theoretical models discussed above that rely on a motivation value of
overconfidence.
In terms of research methods, we offer a clean conceptual definition of absolute overconfidence
and a new empirical strategy to identify significant absolute overconfidence at the individual
2
Santos-Pinto (2008) show theoretically that principals benefit from agents’ overconfidence and the resulting
over-provision of effort if self-image and effort are complements.
5level. Previous papers on absolute overconfidence have directly compared point beliefs on absolute
performance to measured performance to identify overconfidence (e.g. Blavastkyy, 2009, Urbig, Stauf,
and Weitzel, 2009, Clark and Friesen, 2009, Ludwig and Nafziger, 2011, Sautmann, 2013, Hollard,
Massoni, and Vergnau, 2016). Only Ludwig and Nafziger (2011) discuss the risk of misclassifying
individuals due to measurement error and compare average point beliefs on absolute performance to
average performance to identify overconfidence at the group level only. The other papers use that
approach to identify absolute overconfidence at the individual level, ignoring possible misclassification
due to measurement error. Moreover, Malmendier and Tate (2005, 2008), Malmendier, Tate, and
Yan (2011), Galasso and Simcoe (2011), Hirshleifer, Low, and Teoh (2012) use indirect approaches to
categorize CEOs as overconfident based on their options exercise behavior or their portrayal in the
press.3 In contrast, the key conceptual contribution of our paper is to propose a precise definition of
absolute overconfidence that regards observed productivity as a noisy measure of actual productivity
and accounts more generally for individual probabilistic productivity beliefs. That means, we allow for
the possibility that individuals are not 100% sure about their productivity as a point belief suggests.
Based on that definition, we offer a novel strategy for identifying significant overconfidence at the
individual level that can be applied more broadly in future work.
The remainder of the paper is structured as follows. In section 2, we provide a definition of
absolute overconfidence and show how we can build on that definition in order to empirically identify
absolute overconfidence at the individual level. In section 3, we model how beliefs on own productivity
translate into effort provision. Based on this model, we derive hypotheses concerning the motivation
value of (over)confidence as well as on the effect of information about actual productivity on the
effort provision of overconfident subjects. The experimental design that we use to test the two
hypotheses is described in section 4. Section 5 presents results. We discuss our findings and conclude
in section 6.
3
In particular, Malmendier and Tate (2005) and Galasso and Simcoe (2011) classify CEOs as overconfident if they,
e.g., hold nontradeable in-the-money executive stock options until expiration rather than exercising them after the
vesting period or if they exercise options of their own company later than suggested by a rational benchmark, since
such behaviors suggest overconfidence in the own ability to keep the company’s stock price rising. Malmendier and
Tate (2008), Malmendier, Tate, and Yan (2011), Hirshleifer, Low, and Teoh (2012) additionally rely on a CEO’s
characterization as “confident” or “optimistic” in the press.
62. Definition and Identification of Absolute Overconfidence
In this paper, we study absolute overconfidence, i.e. overestimation of one’s own productivity in
a given task with respect to an objective measure of own productivity.4 Consequently, identifying
absolute overconfidence requires two elements: an individual’s belief on her own productivity and
information on her actual underlying productivity.
We move beyond previous approaches to identify overconfident individuals in two respects: we
propose a definition of absolute overconfidence that takes individual probabilistic productivity beliefs
(as opposed to point beliefs) into account and regards observed productivity as a noisy measure of
actual productivity. Based on that definition, we offer a novel strategy for identifying significant
overconfidence at the individual level.
To our judgment, assuming probabilistic productivity beliefs as opposed to point beliefs is more
plausible and robust for several reasons. First, point beliefs imply that individuals are absolutely
certain in their beliefs, which is often not the case. Second, when individuals are asked to reveal a
point belief, it is often not clear what is actually elicited: mean, median, or mode of their belief
distribution. Even when the moment to be measured is explicitly specified, it can be too complicated
to understand and measurement may eventually fail to elicit the moment accurately. Finally, a
framework building on belief distributions is more general and contains point beliefs as a special
case.5 Despite these advantages, we are not aware of other papers that use probabilistic beliefs to
identify overconfident individuals.
Based on the assumption of probabilistic beliefs, we define an individual as overconfident if the
median of her belief distribution exceeds her actual underlying productivity. The intuition behind
this definition is that an individual is overconfident if she assigns more than 50% probability mass of
the belief distribution to productivity levels higher than her true productivity, i.e. if she believes that
4
In principle, overconfidence can result from overestimating own productivity for a realistic assessment of task
difficulty and/or from underestimating exogenous task difficulty (compare Heidhues, Koszegi, and Strack (forthcoming)
who portray an agent who simultaneously holds beliefs on her ability and an external fundamental, which, together
with effort, determine her performance). Our use of the term overconfidence covers both possible sources of absolute
overconfidence.
5
For those reasons, probabilistic beliefs have become widely used. For over a century, researchers have elicited
beliefs in the form of probability distributions and it has become a common practice in surveys since the early 1990s
(Manski and Neri, 2013). Experimental economists often favor probabilistic belief elicitation for its superior predictive
power of choice behavior, e.g. Nyarko and Schotter (2002). Experimental economic research using probabilistic beliefs
is growing (e.g. Manski and Neri, 2013, Neri, 2015, Gee and Schreck, 2018).
7it is more likely that her productivity exceeds her true productivity than vice versa. As a further
advantage, like any quantile, the median is more robust than the mean when it comes to outliers in
the belief distribution. In Section 4, we will describe a ball allocation task that we use to elicit belief
distributions from which we infer median beliefs.
We now turn to the difference between observed and actual underlying productivity. Any
measurement of productivity is subject to noise, and therefore only partially represents the actual
productivity underlying the measurement. Due to temporary variation in unobserved factors such as
luck, concentration, or distraction measuring productivity repeatedly may reveal different observed
values for the same individual given the same actual underlying productivity. This measurement
error could result in misclassifying individuals in terms of overconfidence. As a consequence, observed
productivity alone is not a reliable benchmark to compare the productivity beliefs with.
In order to avoid misclassification due to measurement error, we consider observed productivity as
a random draw from a productivity distribution that is shaped by the actual underlying productivity.
Assume that for an individual i, the outcome of a task is binary: either a success with probability pi
or a failure with probability 1 − pi . pi is the actual underlying productivity of individual i. The
number of realized successes then obeys the binomial distribution B(pi , n), where n corresponds to
the number of observed task outcomes. By the Central Limit Theorem, the observed success rate
(observed productivity) is asymptotically normal,
pi (1 − pi )
qi ∼ N (pi , ),
n
where qi is the observed productivity. With 95% probability, the actual productivity falls into the
q
confidence interval around the observed productivity [qi − 1.96σi , qi + 1.96σi ], where σi = qi (1−q
n
i)
.
The boundaries of the confidence interval can be computed using the observed productivity qi and
the number of observed outcomes n.
We identify an individual as significantly overconfident if the median of her belief distribution mi
exceeds the upper limit of this confidence interval, i.e. mi > qi + 1.96σi . Analogously, an individual
is classified as underconfident if mi < qi − 1.96σ. Individuals with qi − 1.96σi ≤ mi ≤ qi + 1.96σi
are well-calibrated since their productivity beliefs are either accurate or very similar to their actual
productivity. We summarize our definition of significant absolute overconfidence at the individual
level in definition 1.
Definition 1 In tasks with a binary outcome, an individual i is significantly overconfident if
8mi > qi + 1.96σi , where mi is the median of her belief distribution, qi is observed productivity,
q
σi = qi (1−q
n
i)
, and n is the number of observed task outcomes.
3. Model and Hypotheses
In this section, we first specify a theoretical model on how productivity beliefs translate into effort
provision. We then derive hypotheses concerning the motivation value of (over)confidence as well as
the effect of information provision about actual productivity on the effort provision of overconfident
subjects.
Model
A single agent has to decide on the effort level e ∈ [e, ē] to exert in a task with production function
Q(e, p), where p denotes her a priori unknown productivity, p ∈ [0, 1]. The agent’s utility function
takes the following form6 :
U (e, p) = rQ(e, p) − L(e). (1)
For each unit produced, the agent gains a utility increment of r > 0, e.g. a piece rate payment.
Effort provision induces a cost represented by the loss function L(e). Suppose Q(e, p) and L(e) are
continuous and twice differentiable. We introduce the following assumptions:
Assumption 1 (i) Qe > 0, Qee ≤ 0, (ii) Qp > 0, (iii) Le > 0, Lee ≥ 0 (iv) Qep > 0, ∀e ∈ [e, ē], ∀p ∈
[0, 1].
Part (i) implies that the marginal return to effort is positive and monotonically decreasing. Part (ii)
assumes that production is strictly monotonically increasing in productivity for given effort level.
Part (iii) guarantees that the marginal utility loss is positive and monotonically increasing in effort.
Part (iv) formalizes complementarity between effort and productivity.7 Under these assumptions,
the following proposition holds:
Proposition 1 Holding a higher belief on own productivity leads to higher effort provision.
Proof: Let pl and ph denote two productivity beliefs with pl < ph , el and eh the respective
utility maximizing effort levels. The following first order conditions must hold: rQe (eh )|ph = Le (eh )
and rQe (el )|pl = Le (el ). By Qep > 0, rQe (eh )|pl < rQe (eh )|ph , which implies rQe (eh )|pl < Le (eh ).
Suppose el ≥ eh . Since Qee ≤ 0 and Lee ≥ 0, we then have rQe (el )|pl ≤ rQe (eh )|pl < Le (eh ) ≤ Le (el ),
6
For the sake of simplicity, the utility function refers to a risk-neutral individual. Results remain qualitatively the
same if we introduce risk aversion or risk proclivity.
7
These assumptions are satisfied by our experimental design and the data we obtain.
9which contradicts equation rQe (el )|pl = Le (el ). Therefore, for rQe (el )|pl = Le (el ) to hold, it must
be that el < eh . qed
To introduce belief updating, we consider the following three-period model. At the center of our
interest is an overconfident agent, whose prior belief on her own productivity is unrealistically high.
In period 1, let her belief on her productivity be pb0 , pb0 > p, where p is her actual productivity.8
The agent exerts her utility maximizing effort e0 based on her productivity belief pb0 , which results
in output q = Q(e0 , p), while the agent has anticipated to produce qb0 = Q(e0 , p0 ). Since Q is
monotonically increasing in p, q < qb0 . In period 2, the agent is informed about the real output q
and, as a response, adjusts her productivity belief to pb1 , which satisfies Q(e0 , pb1 ) = q. Given Qp > 0,
it must hold that pb1 < pb0 . That is, faced with adverse feedback, the agent adjusts her belief on her
productivity downwards. In period 3, the agent exerts her utility maximizing effort e1 regarding pb1 .
As pb1 < pb0 , it follows directly from Proposition 1 that e1 < e0 .
Corollary 1 An unexpectedly low productivity feedback causes a decrease in effort provision.
Median Utility Maximization
When probabilistic beliefs are taken into account, pb0 and pb1 refer to the medians of individual belief
distributions. Following the monotonicity of the production function in argument p, inserting a
median belief into the utility function gives the median of the agent’s ex-ante probabilistic belief
on her ex-post utility. This effectively implies that the agent exerts the effort level that maximizes
the median of her utility distribution. The study of quantile maximization dates back to Manski
(1988) who points out that “if actions are characterized by probability measures of outcomes, then
we should consider rational any pattern of behavior consistent with the existence of a preference
ordering on the space of these probability measures.” More recently, quantile maximization was
axiomatized by Rostek (2010).
In our set-up, the intuition for assuming median utility maximization is the following: Let the
optimal effort corresponding to median belief on productivity be e∗ . An agent with probabilistic
productivity belief believes that it is unlikely (less probable than 50%) that her productivity is lower
than her median belief. Due to the positive monotonicity of optimal effort in productivity belief
(Proposition 1), she would not exert lower effort than e∗ . At the same time, she believes that it is
8
For expositional clarity, we set aside probabilistic beliefs for now, allowing us to proceed without imposing any
assumption on the belief probability distribution. Later, probabilistic belief will be introduced by using the median of
the belief distribution as p in the model.
10also unlikely (less likely than 50%) that her productivity is higher than the median belief. Hence,
the effort she exerts will not exceed e∗ . Combining the arguments above, her optimal effort level is
e∗ , which means the agent chooses her effort provision to maximize median utility.
Hypotheses
Based on the model, we derive the following two hypotheses.
Hypothesis 1 (motivation value of confidence) A higher belief on own productivity leads to
higher effort provision.
When faced with an effort-intensive task, individuals have to decide how much effort to exert.
Without knowledge about their true productivity, they need to rely on their belief on their productivity
to make this decision. Whether diligence is induced by higher or lower confidence in one’s own
productivity constitutes the first research question that we aim to answer.
Our model assumes that individuals choose their effort level by balancing expected marginal
benefits and marginal costs of effort provision in order to maximize their utility. As a consequence,
individuals with higher productivity beliefs will exert higher effort since they expect to obtain higher
marginal benefits from effort provision. This motivation value of confidence is particularly relevant
for individuals who overestimate their own productivity, due to its potential to offset the suboptimal
decision making caused by overconfidence through exaggerated effort provision (e.g. Bénabou and
Tirole, 2002, Compte and Postlewaite, 2004).
In contrast, if individuals are satisficers (Simon, 1955) instead of utility maximizers, more
confident individuals are predicted to exert less effort. In general, satisficers will stop an activity
(such as information search or, in our case, effort provision) as soon as they reach their individually
accepted target outcome level (so-called “aspiration level”) – despite the fact that they could obtain
an even better outcome by continuing the activity. In our case, the aspiration level corresponds
to an individual target utility level that is less than the maximal attainable utility. If effort and
productivity are complements, more productive individuals can reach a given aspiration level by
exerting less effort than less productive individuals. As a consequence, satisficing individuals with
higher productivity beliefs are predicted to exert less effort.
Hypothesis 2 Informing overconfident individuals on their own productivity reduces their effort
provision.
When overconfident individuals receive feedback on their actual productivity, they will adjust
their productivity beliefs downwards. As predicted by Hypothesis 1, this downward adjustment of
11productivity beliefs due to de-biasing information will reduce effort provision.
4. Experimental Design and Implementation
We designed a laboratory experiment to test Hypotheses 1 and 2. Figure 1 presents an overview of
the experimental design that consists of five stages.
Figure 1: Overview of Experimental Design
Stage 1: modified slider task
Measure individual productivity in a modified slider task.
Stage 2: ball allocation task
Elicit belief distribution on own productivity in stage 1.
Stage 3: exogenous treatment variation
INFO and NOINFO
(Info.: Stage 1 productivity)
Stage 4: modified slider task with voluntary length
Measure individual effort level.
Stage 5: ball allocation task
Elicit belief distribution on own productivity in stage 4.
Questionnaire
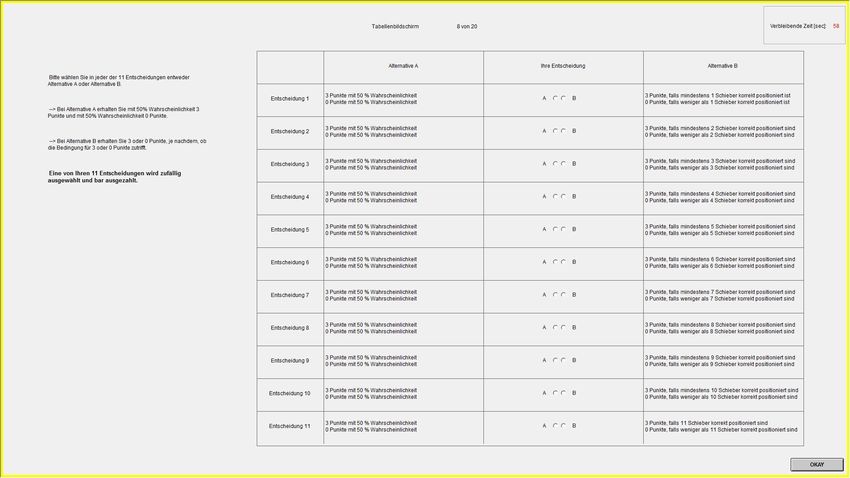
Stage 1: In stage 1, we measure individual productivity using an adapted version of the well-
established slider task (Gill and Prowse, 2018). Subjects worked on 20 slider screens that each
displayed 11 sliders (see Figure 2).9 The subjects’ task was to drag each slider with the mouse and
to position it into the small interval [49.5, 50.5] at the middle of a scale that ranged from 0 to 100.
For each subject, the proportion of correctly positioned sliders among all 220 sliders serves as the
measure of individual productivity. Subjects earned a piece rate of 1 point for each successfully
9
We used 11 sliders per screen to eliminate obvious focal points in the later belief elicitation. Slider screens and
“choice list screens” were shown alternately, each 20 times. The choice list screens elicited subjects’ median beliefs on
their own productivity in an incentive compatible way. A detailed description of the choice list screens, the reasons
why we do not use them in the main analysis, and related robustness checks are provided in Appendix B.
12Figure 2: A Slider Screen
positioned slider. At the end of the experiment, each point was exchanged into 0.05 Euro.
In contrast to the original version of the slider task (Gill and Prowse, 2018), the numerical
position of each slider was not displayed on screen and subjects could only guess the slider’s position
by eye-balling. Thus, subjects could not perfectly monitor their productivity, offering scope for over-
or underconfidence. Further advantages of the slider task are that it does not require prior knowledge
and does not exhibit a time trend in performance, in line with the assumption that underlying true
productivity is constant over time.10
Subjects had 55 seconds to work on each slider screen. Fixing an upper time limit ensures that
our measure of individual productivity, the number of correctly positioned sliders, is comparable
across subjects. Only after 55 seconds, subjects could proceed to the next screen that appeared
automatically. Our data suggest that 55 seconds were sufficient for subjects to work on all 11 sliders:
on average, subjects left only 5 out of 220 sliders untouched in stage 1. After 20 slider screens, the
experiment moved on to stage 2 automatically.
10
In a Tobit panel regression of the number of correctly positioned sliders per screen on a screen sequence number
and an additional dummy for the last screen, the coefficient of the screen sequence number is not significant (-0.006,
p = 0.13) and the dummy for the last screen is marginally significant only (-0.19, p = 0.07). The absence of a trend
for productivity implies Qee = 0 so that Part (ii) of Assumption 1 of our model is met.
13Figure 3: Ball Allocation Task
Stage 2: In Stage 2, we elicit each subject’s belief distribution on the overall number of correctly
set sliders in Stage 1 using a ball allocation task, adapted from Delavande and Rohwedder (2008)
(see Figure 3). In the ball allocation task, each subject had 100 balls. Each ball represents one
percentage point of probabilistic belief and had to be allocated to one of 11 bins representing the
intervals [0, 20], [21, 40],..., [201, 220]. The number of balls a subject allocated into each bin indicates
the probability, with which the subject believed that the actual number of correct sliders falls in the
bin’s interval. The allocation of balls therefore approximates a subject’s belief distribution. The ball
allocation task was incentivized using the randomized Quadratic Scoring Rule (rQSR) adapted from
Drerup, Enke, and Von Gaudecker (2017) and Schlag and van der Weele (2013). For each subject i,
we first computed a number Yi following the formula below:
11
(bji − 100 × 1j )2 ,
X
Yi =
j=1
where j ∈ 1, 2, 3, ..., 11 denotes the respective bins, bji denotes the number of balls subject i assigned
to bin j, indicator 1j equals 1 for the bin that contains the actual number of correctly positioned
sliders and 0 otherwise. Yi is increasing in the number of balls a subject allocated into the wrong
bins. Yi has a minimum of 0 and a maximum of 20,000. Subject i obtained 30 points if and only
if Yi < Xi , where Xi is a random number drawn from the uniform distribution U [0, 20000]. This
payment scheme ensures that the probability of winning the lottery increases in the number of balls
allocated to the correct bin, while the magnitude of reward remains fixed. As a consequence, this
procedure incentivizes subjects to reveal their beliefs truthfully regardless of their risk preference,
14since risk-averse, risk-neutral and risk-seeking subjects alike will strive to maximize the winning
probability of the lottery by allocating the balls in accordance with their true belief distribution.
Stage 3: Subjects were randomly assigned to one of two treatments (INFO or NOINFO), in
which subjects either received feedback on their own productivity or not. In the INFO treatment,
the computer screen of each subject displayed her own actual number of correctly set sliders on
each slider screen in stage 1 and their aggregate, along with the corresponding beliefs. Subjects
could read this private information for up to 2 minutes and could proceed to Stage 4 by clicking a
“continue” button. After 2 minutes, they would receive a reminder urging them to click “continue”.
In the NOINFO treatment, subjects did not receive any information. To keep the treatments similar,
they were given a break of up to 2 minutes, which was announced on the screen.
Stage 4: The set-up of Stage 4 was similar to the one in Stage 1: At most twenty slider and choice
list screens were shown alternately and subjects earned a piece rate of 1 point for each successfully
positioned slider. Piece rate payment ensures that effort and productivity are complementary in
Stage 4 and that measurement of overconfidence is consistent in Stage 1 and 4.
In contrast to Stage 1, after completing each screen in Stage 4 subjects could choose between
continuing to the next slider screen and terminating the slider task. Subjects knew beforehand
that they could work on up to 20 slider screens. Subjects could also omit the slider task in Stage 4
altogether and enter Stage 5 directly by clicking a “terminate” button on the instruction screen at
the beginning of the stage. The number of slider screens a subject worked on serves as the measure
of her effort level, with a minimum of 0 and a maximum of 20. Subjects could leave the laboratory
once they had individually gone through all stages of the experiment. Therefore, exerting less effort
made the experiment shorter. In order to avoid potential spillovers of one departure on the leave
or stay decision of the remaining subjects, we invited the subjects to come to the laboratory any
time within a 3-hour time range (either from 9 am to 12 am or from 2 pm to 5 pm). Observing a
departure of a fellow subject did not provide information on how long she had worked.
Stage 5: We used the same ball allocation task as in Stage 2 to elicit each subject’s belief
distribution on the total number of correctly positioned sliders in Stage 4. Again, each subject had
100 balls, symbolizing 100 percentage points. Unlike in Stage 2, the length of intervals represented by
each bin was determined by the number of screens a subject had worked on in Stage 4. For example,
after working on 4 screens, a subject saw bins representing the intervals [0, 4], [5, 8], ..., [41, 44]. The
individual-specific upper bound was the total number of sliders a subject had worked on. Subjects
were incentivized in the same way as in Stage 2 such that the allocation of balls approximated the
15belief distribution on the number of correctly positioned sliders in Stage 4. Subjects who had skipped
Stage 4 skipped also Stage 5.11
Final questionnaire: After Stage 5, subjects answered a questionnaire on, among other things,
socio-demographics, risk and ambiguity preferences, personality traits and survey measures of
absolute overconfidence, relative overconfidence, and over-precision.
Payments: Subject were informed about their level of earnings and paid in cash right after
they had finished the experiment. Total earnings were the sum of the following components: the
amount earned in the slider task and choice lists in Stages 1 and 4, and in the ball allocation task in
Stages 2 and 5; a random payoff of either 0, 1, or 2.5 Euro for revealing risk preferences in a Holt
and Laury table (Holt and Laury, 2002) and a random payoff of either 0 or 2 Euro for revealing
ambiguity aversion in the questionnaire; a 1 Euro reward for answering the questionnaire and a 2
Euro show-up fee. On average, subjects earned 11.6 Euro.
Instructions and control questions: Detailed paper instructions were handed out before
Stage 1 and Stage 2. Subjects kept and could refer to the instructions until the end of the experiment.
In addition, subjects answered two control questions designed to test and improve their understanding
of the corresponding tasks before each of Stage 1 and Stage 2. The correct answer to each control
question consisted of more than one element. Only when all correct elements were ticked, the
answered was considered correct. When a correct answer was submitted, the experiment proceeded.
If an answer was wrong on the first try, a subject learned that the answer was wrong and was
encouraged to try again. If subjects failed again on the second try, the correct answer was shown
along with an explanation. The recorded answers to the control questions show that the vast majority
subjects understood the tasks well before carrying them out.
Implementation: We run six sessions in the BonnEconLab in Bonn, Germany in October and
November 2016. 180 participants aged 17 to 61 took part in the experiment (average age of 23,
with 19 and 28 being the 10% and 90% quantiles, respectively). 73 of them were male and 107
were female. The subject pool consisted mainly of students from various majors in University of
Bonn (89%). 89 subjects were randomly assigned to the INFO treatment and 91 to the NOINFO
treatment. Treatments were randomized within sessions to balance the data with respect to time of
the day, weekday, and weather etc. The experiment lasted about one hour on average. We used
11
One subject anticipated that we would ask for beliefs in Stage 5 again, sat strategically idly in Stage 4 and
allocated all 100 balls to bin 1 in Stage 5 in order to earn the reward in Stage 5 with certainty. This subject earned
less (9.05 Euro) than the average payoff of 11.60 Euro.
16z-tree (Fischbacher, 2007) to implement the experiment and hroot (Bock, Baetge, and Nicklisch,
2014) for inviting subjects and recording their participation. Instructions and interfaces on the client
computers were written in German, as subjects were either German natives or German speaking.
Appendix A contains an English translation of the instructions.
5. Results
In this section, we first summarize key features of our data and identify overconfident subjects. We
then address Hypotheses 1 and 2, before we provide further results and robustness checks.
The analysis relies on observations from 176 subjects, 88 in the INFO and 88 in the NOINFO
treatment. We exclude one subject who stated in the final questionnaire that she exited stage 4
accidentally by pressing the wrong button and three subjects who gave wrong answers to all four
control questions. As a result of random assignment, observed productivity and median productivity
beliefs in Stage 1 do not differ significantly across treatments (Mann-Whitney-U test, p = 0.85 and
p = 0.48, respectively).12 Out of a total of 220 sliders, the mean number of correctly set sliders in
Stage 1 is 40 (std. dev. 17.38) in INFO and 38 (std. dev. 14.14) in NOINFO, while the average
median productivity belief is 108 (std. dev. 32.65) in INFO and 107 (std. dev. 33.71) in NOINFO.
5.1. Identification of Overconfident Subjects
We first compute each subject’s median belief on Stage 1 productivity using the corresponding
histogram of the probabilistic belief distribution from the allocation of balls in Stage 2. The bins of
the histograms are the same as the bins in the ball allocation task. We compute the median of this
belief distribution mi as Pki j
j=1 bi − 50
mi = βi − di × ,
bki i
where i indicates the subject, j denotes the serial number of the bins. bji is the number of balls
subject i allocates to bin j. di represents the length of the intervals. ki denotes the serial number of
P i −1 j P i j ki
the bin that contains the median and thus satisfies kj=1 bi < 50 ≤ kj=1 bi . bi is the number of
balls that subject i allocates to the bin that contains the median. βi is the upper bound of subject
i’s ki th interval.
12
Throughout the paper, we report p-values for two-sided tests. The next paragraph describes in detail how we
infer median productivity beliefs from the ball allocation task.
17Following the identification strategy outlined in Section 2, we classify 166 subjects as overconfident
(83 in INFO and 83 in NOINFO): the median of their belief distribution exceeds the upper limit of the
95% confidence interval around their observed productivity. 5 subjects are classified as underconfident
(3 in INFO and 2 in NOINFO) and 5 as well-calibrated (2 in INFO and 3 in NOINFO). The high
share of overconfident subjects is compatible with a large body of research, which documents that
overconfidence is a prevailing phenomenon, see e.g. the studies cited in Plous (1993) or Malmendier
and Tate (2005) for a more recent study on absolute overconfidence.13
5.2. Result 1: The Motivation Value of (Over)Confidence
We now turn to Hypothesis 1, which states that higher beliefs in one’s own productivity lead to
higher effort provision (motivation value of confidence). Figure 4 depicts individual effort choices
and productivity beliefs in treatment NOINFO. The vertical axis displays chosen effort in the slider
task in Stage 4, measured by the number of screens worked on. The horizontal axis represents
subjects’ median productivity belief on the share of correctly positioned sliders that is elicited by
the ball allocation task in Stage 5, i.e. mi /(number of screens worked on in stage 4 * 11 sliders).
As hypothesized, productivity beliefs and effort provision are significantly positively correlated
(NOINFO treatment, Pearson correlation, r = 0.25, p = 0.02). Considering overconfident subjects
only, the Pearson correlation between productivity beliefs and effort choices increases to r = 0.32,
p < 0.01 (NOINFO treatment).
Figure 4 reveals that a significant fraction of subjects exerted maximum effort by working on all
20 slider screens (59 subjects), while others stopped working earlier.14 It seems likely that many of
the maximum effort subjects would have worked on more than 20 screens if that option would have
been available. In line with that intuition and the motivation value of confidence, the maximum
effort subjects have higher productivity beliefs than the remaining subjects (median beliefs are 0.56
and 0.49, respectively, Mann-Whitney-U test, p = 0.06). To take censoring into account, we display
results of a Tobit regression of effort choice on productivity beliefs in Table 1. Results in Table 1
confirm that higher productivity beliefs predict higher effort provision. On average, subjects with a
10 percentage points higher productivity belief work on 2.6 additional screens, i.e. increase their
effort choice by 13 percentage points (2.6/20, i.e. the maximum number of screens).
13
Dated back to the 1770s, Adam Smith already pointed out that “every man” tends to be overconfident about his
chance of gain (Smith 1776).
14
Both kinds of behavior are compatible with Part (iii) of Assumption 1 of our model. In particular, exerting
18Figure 4: The relation between beliefs on productivity and effort provision
Notes: The variable productivity beliefs represents subjects’ median beliefs on their success rate in Stage 4,
inferred from the ball allocation task in Stage 5. The variable effort corresponds to the number of slider
screens worked on in Stage 4. Only observations from the NOINFO treatment are displayed.
To sum up, in line with the motivation value of confidence, we find that individuals with higher
productivity beliefs exert more effort.
5.3. Result 2: Information Reduces Overconfident Subjects’ Effort Provision
Hypothesis 2 postulates that overconfident subjects who are informed about their own actual
productivity will adjust their productivity beliefs downwards and lower their effort provision.
In line with Hypothesis 2, we find that information provision decreases overconfident subjects’
exaggerated productivity beliefs. In Stage 5, the productivity beliefs of overconfident subjects in
the INFO treatment are significantly lower than in treatment NOINFO (see column (4) of Table
2, Mann-Whitney-U test, p < 0.01). Also within the INFO treatment, overconfident subjects
significantly reduce their productivity beliefs after receiving information on their own productivity
positive, but less than maximum effort implies Lee > 0.
19Table 1: Tobit regression of effort choice in Stage 4 on productivity beliefs in Stage 5
Dependent variable: effort level in Stage 4
Productivity belief in Stage 5 26.64**
(12.91)
Sigma 15.71
(2.55)
Constant 13.80**
(6.25)
N 86
Pseudo R2 0.015
The variable effort level is measured by the number of screens worked on in Stage 4. The independent variable
productivity belief refers to the median belief in percentages (expressed between 0 and 1) elicited by the ball allocation
task in Stage 5. The productivity beliefs in Stage 4 are missing for 2 subjects who chose to skip Stage 4. N=59
observations are censored from above at 20.
(comparison of columns (2) and (4), last row of Table 2, Wilcoxon signed-ranks test, p < 0.01).
While the updating of beliefs is substantial, it is not perfect. In contrast, in the NOINFO treatment
overconfident subjects’ beliefs remain stable over time (comparison of columns (2) and (4), second
to last row of Table 2, Wilcoxon signed-ranks test, p = 0.95).
Moreover, informed overconfident subjects substantially reduce their effort provision. On average,
they work on 13 instead of 16 screens in Stage 4 (see Figure 5, Mann-Whitney-U test, p = 0.04).
Thus, overconfident subjects in treatment INFO exert about 19% lower effort than those in NOINFO
treatment. In line with Hypothesis 2, debiasing overconfident individuals’ beliefs on their own
productivity leads to lower effort provision. Due to the random assignment of subjects to the INFO
and NOINFO treatment, our data provide causal evidence that informing overconfident subjects
about their own productivity reduces their effort provision.
5.4. Information Reduces Overconfident Subjects’ Quality of Work
So far, we have focused on the effect of information on overconfident subjects’ effort provision at the
extensive margin, measured by the number of slider screens subjects work on. However, not only
does the amount of work the informed overconfident subjects do decline significantly, but also the
20Table 2: Productivity and beliefs on productivity of overconfident subjects in Stage 1 and Stage 4
(1) (2) (3) (4)
Treatment Productivity Belief on productivity Productivity Belief on productivity
in Stage 1 in Stage 2 in Stage 4 in Stage 5
NOINFO 18% 50% 16% 50%
INFO 18% 51% 15% 23%
Productivity refers to the average % of correctly positioned sliders and beliefs reflect the corresponding average belief
on productivity. Beliefs on productivity in Stage 1 and 4 are measured in Stages 2 and 5, respectively.
Figure 5: Effort provision in Stage 4
quality of their work (effort at the intensive margin). We measure quality by the number of correctly
positioned sliders per screen that subjects have worked on. In particular, for informed overconfident
subjects, the percentage of correctly positioned sliders per screen drops significantly from 18%
in Stage 1 to 15% in Stage 4 (Wilcoxon signed-ranks test, p < 0.01). In contrast, uninformed
overconfident subjects’ number of correctly positioned sliders per screen does not change significantly
21from Stage 1 to Stage 4 (18% in Stage 1 and 16% in Stage 4, Wilcoxon signed-ranks test, p = 0.20).
This finding and Hypothesis 2 share the same intuition that informing overconfident subjects about
their exaggerated beliefs on their own productivity hurts their performance.
5.5. Robustness Checks
Before discussing the implications of our findings, we exclude several alternative explanations of our
data.
A first concern might be that receiving information about own Stage 1 productivity enables
subjects to infer their payment from Stage 1, which, despite the small stakes, might raise the salience
of wealth effects. 83 out of 88 of subjects in treatment INFO receive information that induces a
downward adjustment of expected earnings. Thus, in the presence of wealth effects information
should induce higher levels of effort provision in Stage 4 if the marginal utility of money is decreasing.
Such an increased effort provision would counteract the hypothesized negative effect of information
on effort provision in Stage 4. However, we find a strongly negative effect of information on effort
provision. Moreover, the correlation between productivity in Stage 1 and effort provision in Stage 4
is low and not significant in treatment INFO (Pearson correlation, r = 0.03, p = 0.76). Consequently,
wealth effects cannot have a major impact on effort provision in Stage 4.
A second concern could be that information affects beliefs and, as a consequence, effort provision
not only through its content but also through further channels such as emotions like disappointment.
While we consider emotion effects a possible inherent and integral part of any information provision,
our paper focuses solely on the instrumental value of information content, since we aim at providing
empirical evidence on the motivation value of overconfidence as it is used in microeconomic modeling,
e.g. in Krähmer (2007) or Bénabou and Tirole (2002). Results in Table 3 suggest that information
provision influences effort exertion by affecting productivity beliefs, while emotions play at most a
subordinate role. Table 3 displays results of a Tobit regression of Stage 4 effort provision on the
corresponding productivity beliefs and a dummy variable information that takes the value 1 for
subjects in the INFO treatment and 0 otherwise. Productivity beliefs are a highly significant predictor
of effort provision, while the information dummy is not (column (1)). This result is qualitatively the
same when restricting the sample to overconfident subjects only, for whom information conveys bad
news (column (2)).
Finally, on top of beliefs on own productivity individual personality traits such as locus of control
and conscientiousness are considered to be predictors of individual effort provision and performance,
22Table 3: Tobit regression
Dependent variable: effort level in Stage 4
All OC only
Productivity belief in Stage 5 19.55** 22.89**
(9.01) (9.34)
Information -0.17 1.71
(3.54) (3.67)
Sigma 15.34 15.26
Constant 16.83*** 14.33***
(4.70) (4.90)
N 169 160
Pseudo R2 0.012 0.013
The variable effort level is measured by the number of screens worked on in Stage 4. The independent variable
information takes a value of 1 in the INFO treatment and 0 in the NOINFO treatment, productivity belief refers to
the median belief in percentages, elicited by the ball allocation task in Stage 5. The productivity beliefs in Stage 4 are
missing for 7 subjects who chose to skip Stage 4.
23see e.g. Almlund et al. (2011). If these traits are correlated with productivity beliefs, they could
possibly cause a spurious correlation between productivity beliefs and effort provision or bias our
estimates. Since we obtained independent measurements of locus of control and conscientiousness
in the final questionnaire of the experiment15 , we can rule that out: neither locus of control nor
conscientiousness are significantly correlated with a subject’s belief in own productivity (Spearman
correlations are 0.001 and 0.021, respectively, both p > 0.78).
6. Conclusion
Our results provide first empirical evidence on the existence of a motivation value of absolute
overconfidence that numerous microeconomic models incorporate as a basic ingredient of their
modeling approach (e.g. Bénabou and Tirole, 2002, Compte and Postlewaite, 2004, Gervais and
Goldstein, 2007, Ludwig, Wichardt, and Wickhorst, 2011) and contrast predictions based on satisficing
(Simon, 1955): Ceteris paribus, individuals with a higher belief on their own productivity exert
higher levels of effort and this relationship also holds for overconfident individuals.
Moreover, we show that de-biasing overconfident individuals by informing them about their true
productivity reduces their productivity beliefs and hurts their effort provision. According to our
basic model, the over-provision of effort by overconfident agents is to their detriment since marginal
costs of effort provision will exceed marginal benefits. In richer settings, however, overconfident
individuals (Bénabou and Tirole, 2002, Compte and Postlewaite, 2004) or other parties such as
their employers, team members or partners (Gervais and Goldstein, 2007, Ludwig, Wichardt, and
Wickhorst, 2011) may well benefit from their exaggerated effort provision. For example, employers
could restrain from providing accurate performance feedback to an overconfident employee in order
to continue benefiting from her exaggerated effort provision in the future.16 Thus, in contrast to the
general notion that more accurate beliefs enhance decisions, our results imply that not providing
overconfident individuals with information on their own productivity can sometimes be beneficial.
More generally, our findings contribute to the empirical literature on the consequences of
overconfidence and add insights on factors that motivate effort, compare DellaVigna and Pope (2017).
15
Our measure of locus of control comprises 10 items adapted from Rotter (1966) that are used in the 2005 wave of
the German Socio-Economic Panel. To measure conscientiousness, we use the two items proposed by Rammstedt and
John (2007).
16
This implication is in line with plenty empirical evidence that subjective performance evaluations in firms often
tend to be too lenient (Prendergast, 1999).
24You can also read