Magnitude and Spread of Bed Bugs (Cimex lectularius) throughout Ohio (USA) Revealed by Surveys of Pest Management Industry - MDPI
←
→
Page content transcription
If your browser does not render page correctly, please read the page content below

insects
Article
Magnitude and Spread of Bed Bugs (Cimex lectularius)
throughout Ohio (USA) Revealed by Surveys of Pest
Management Industry
Susan C. Jones

                                          Department of Entomology, The Ohio State University, Columbus, OH 43210-1065, USA; jones.1800@osu.edu

                                          Simple Summary: Bed bugs are small blood-sucking insects that live indoors and feed on humans.
                                          They have become a problem in countries worldwide. In this study, the problem in Ohio (Midwest
                                          U.S.) was measured based on treatments by licensed pest control companies throughout the state.
                                          Results from 2005 showed that Ohio’s bed bug problem likely started in Hamilton County, which
                                          includes Cincinnati. Much larger numbers of bed bug treatments were performed in 2011 and again
                                          in 2016, especially in counties with large cities. Almost every Ohio county had numerous bed bug
                                          treatments in 2016. Most treatments were in apartments/condos and single-family homes. Residents
                                          misused many pesticides, especially over-the-counter “bug bombs” and household cleaners, trying to
                                          eliminate bed bugs. Many people also threw away unwrapped infested furniture, which may further
                                          spread these bugs. More public education is needed to stop such practices. This study shows that bed
                                          bug problems can grow and spread quickly. Federal, state, and local officials and the public should
                                          immediately deal with bed bugs rather than waiting until they become an even bigger problem.

                                   Abstract: Bed bugs have recently re-emerged as human pests worldwide. In this study, two sur-
Citation: Jones, S.C. Magnitude and       veys queried licensed pest management companies in Ohio (Midwest USA) about their experiences
Spread of Bed Bugs (Cimex lectularius)    managing bed bugs. A primary objective was to assess the magnitude and spread of bed bug in-
throughout Ohio (USA) Revealed by         festations statewide based on companies’ treatment records from 2005 and 2011 (first survey) and
Surveys of Pest Management                2016 (second survey). The survey response rates were 35.6% and 31.6%, respectively. Treatment
Industry. Insects 2021, 12, 133.          data from 2005 indicated that Ohio’s bed bug problem likely started in the SW corner of the state
https://doi.org/10.3390/
                                          in Hamilton County (includes city of Cincinnati), since it totaled five times more treatments (ap-
insects12020133
                                          proximately 4500) than second-ranking, centrally located Franklin County (Columbus). In the first
                                          half of 2011, more than 15,000 treatments were performed in these two counties. In 2016, treatments
Academic Editors: Alvaro Romero
                                          reached nearly 38,000 in Franklin County and in NE Ohio in the three combined counties that include
and Dong-Hwan Choe
Received: 31 December 2020
                                          Cleveland-Akron-Canton. Bed bug problems expanded statewide during an 11 y period, with an
Accepted: 2 February 2021                 estimated 100+ treatments in 7 counties in 2005, 45 counties in 2011, and nearly all 88 counties in
Published: 4 February 2021                2016. Apartments/condos and single-family residences comprised the largest share of bed bug work.
                                          Residents misused many pesticides and household cleaners trying to eliminate bed bugs. Many
Publisher’s Note: MDPI stays neutral      also discarded unwrapped infested furniture, which may further spread these bugs. More public
with regard to jurisdictional claims in   education is needed to stop such practices. This study shows that bed bug problems grow and spread
published maps and institutional affil-   quickly; federal, state, and local officials and the public should immediately deal with bed bugs.
iations.
                                          Keywords: Cimex lectularius; integrated pest management; pesticide misuse; pest survey; urban areas

Copyright: © 2021 by the author.
Licensee MDPI, Basel, Switzerland.        1. Introduction
This article is an open access article         In the last two decades, bed bugs have resurged in industrialized regions worldwide,
distributed under the terms and           particularly in North America [1–8], Europe [9,10], and Australia [11]. The United States
conditions of the Creative Commons
                                          is among the counties that have been severely impacted by bed bugs. The species found
Attribution (CC BY) license (https://
                                          throughout the U.S. is Cimex lectularius, which is known as the common bed bug or simply
creativecommons.org/licenses/by/
                                          the bed bug.
4.0/).

Insects 2021, 12, 133. https://doi.org/10.3390/insects12020133                                            https://www.mdpi.com/journal/insects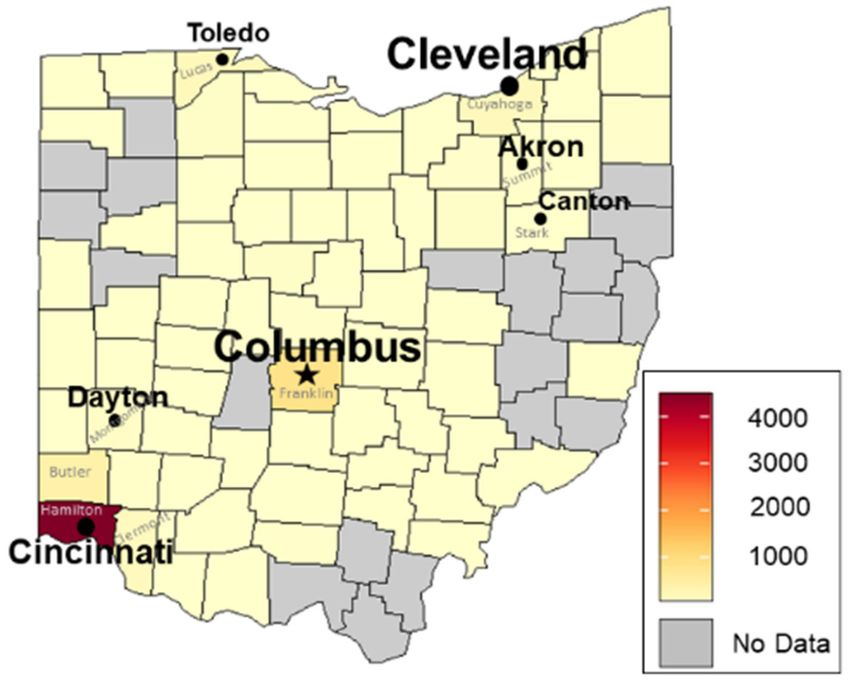
Insects 2021, 12, 133                                                                                            2 of 20

                              Insights into the biology and behavior of bed bugs [12–16] help shed light on how
                        these small, blood-sucking insects quickly become major problems in diverse settings
                        such as private residences, apartments, hotels, nursing homes, day care centers, hospitals,
                        and office buildings. Bed bugs live indoors and preferentially feed on humans. They are
                        nocturnal and therefore most active at night. Bed bugs often hide near human resting and
                        sleeping places, but their flat shape and climbing ability enable them to hide in narrow
                        cracks and crevices anywhere from floor to ceiling. Research has shown that approximately
                        80% of bed bugs remain hidden, with only hungry bugs venturing from their hiding
                        places [17]. Bed bugs have a fast life cycle, going from egg to reproductive adult within
                        several weeks or longer depending on temperature. As the number of bed bugs increases
                        in a home, the bugs tend to become more and more widely dispersed. These bugs can walk
                        long distances indoors, but they also hitchhike on items and are easily transported to new
                        locations [17–19].
                              Bed bugs are difficult and expensive to control, and they necessitate multiple inte-
                        grated pest management (IPM) strategies. If left untreated or improperly treated, bed bugs
                        rapidly increase in number. Bed bugs adversely affect public health and well-being of all
                        socioeconomic classes, but particularly those who cannot afford the cost, time, and effort
                        needed to control these pests [20,21]. There is a higher risk of bed bug infestations in
                        poorer neighborhoods, in areas where evictions were more prevalent, and in more crowded
                        neighborhoods [22].
                              Annual reports from two nationwide pest management companies, Orkin and Ter-
                        minix, since 2010–2011 have consistently listed one or more Ohio cities among the most
                        highly bed bug infested in the nation [23–27]. In 2010, Ohio was termed “the most bed bug-
                        infested state,” because it had the most highly ranked cities on Terminix’s list (Cincinnati #4,
                        Columbus #7, Dayton #8, Cleveland #14) [23]. Although the rankings by nationwide com-
                        panies are skewed by their predominance or lack thereof in particular geographic areas,
                        they indicate that bed bugs are a problem in Ohio.
                              Ohio is in the Midwest U.S. and is the 7th most populous and 10th most densely
                        populated of the 50 states [28]. Based on 2016 population estimates [28], the most populous
                        of Ohio’s 88 counties (Figure 1) are: (1) Franklin County [state capital of Columbus] with
                        1.27 million people; (2) Cuyahoga County [Cleveland] with 1.25 million; (3) Hamilton
                        County [Cincinnati] with 811,000; (4) Summit County [Akron] with 541,000; (5) Mont-
                        gomery County [Dayton] with 532,000; (6) Lucas County [Toledo] with 433,000. These
                        major cities are widely distributed throughout the state and are connected by a well-
                        developed intrastate and interstate highway system, which also provides access to five
                        bordering states and beyond. Eleven of Ohio’s metropolitan areas are within a day’s drive
                        of approximately 50% of the U.S. population [29].
                              Despite the bed bug resurgence in the U.S., few long-term data have been compiled
                        to trace the timeline and scope of bed bug infestations on a statewide basis. A primary
                        objective of the current study was to assess the magnitude and spread of bed bug infesta-
                        tions throughout Ohio based on licensed companies’ treatment records spanning an 11 y
                        period (2005 through 2016). A secondary objective was to obtain information on residents’
                        responses to bed bugs, including misidentification, do-it-yourself (DIY) pest control, and
                        furniture disposal.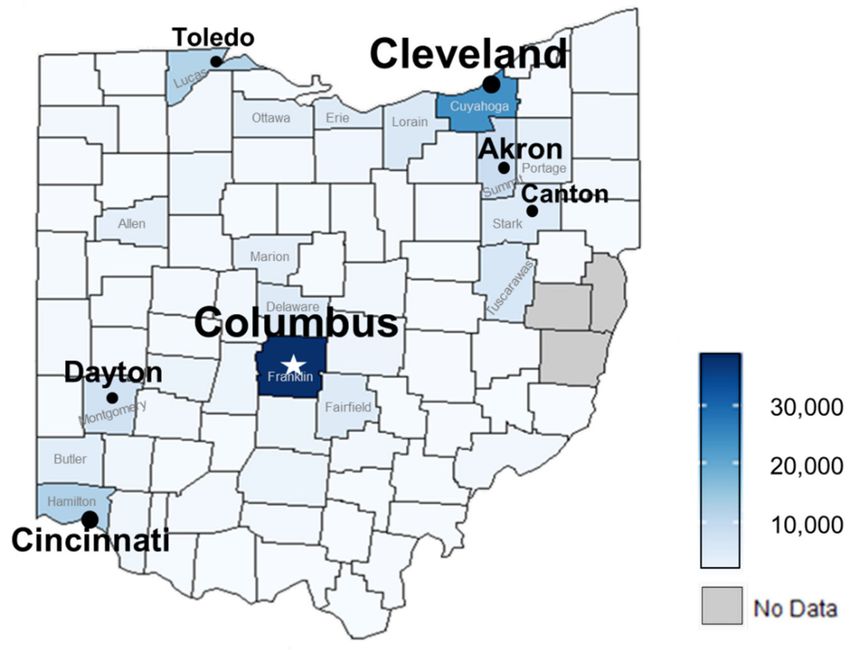
Insects 2021, 12, 133                                                                                                       3 of 20

      Figure 1. Map of Ohio depicting its 88 counties, major cities, and some towns (star indicates state capital, Columbus).
      Map modified from http://mapsof.net/ohio/ohio-cities-and-towns (accessed on 3 February 2021).

                                 2. Materials and Methods
                                      Two statewide surveys of Ohio’s licensed pest management professionals (PMPs)
                                 were conducted asking about their experiences with bed bugs. Both questionnaires cov-
                                 ered topics such as bed bug infestation frequency, detection and treatment practices, and
                                 products used by PMPs and the public. The first survey requested data from the first half
                                 of 2011, but it also asked for treatment numbers from 2005 when available. The second
                                 survey requested data from 2016.
                                      Survey questions and the statistical plan were developed by the author in consultation
                                 with Ohio State University’s Statistical Consulting Service (SCS). Survey questions were
                                 reviewed by several members of the Ohio Pest Management Association (OPMA) prior
                                 to being finalized. The Ohio State University Institutional Review Board (IRB) reviewed
                                 and pre-approved both surveys for distribution—they were determined to be exempt from
                                 federal regulations governing the conduct of human subjects’ research.
                                      The distribution list for both surveys was obtained through the Ohio Department of
                                 Agriculture (ODA) Pesticide and Fertilizer Regulation Division. All licensed commercial
                                 applicators in Category 10a, ‘General Pest Control,’ in Ohio in 2011 and 2016, respectively,
                                 were listed along with company name, mailing address, and county; an email address occa-
                                 sionally was provided. The list of licensees was refined to avoid sending a duplicate survey
                                 to the same company or franchise branch office; surveys were sent to each company owner
                                 or manager, who was identified using Internet searches or phone calls when unknown.
                                 Email addresses were obtained similarly.
                                      SCS administered the surveys online or by U.S. mail. The first survey ran from
                                 19 August to 30 September 2011. The second survey ran from 22 February to 21 March
                                 2017. Both surveys consisted of 29 questions that were formatted as open-ended or fixed
                                 responses. Many questions were identical in both surveys. Exhibit S1: 2011 Ohio Bed
Insects 2021, 12, 133                                                                                         4 of 20

                        Bug Survey Questionnaire; and Exhibit S2: 2016 Ohio Bed Bug Survey Questionnaire are
                        provided in the Supplementary Materials.

                        2.1. Calculation of Total Number of Treatments Per County in 2005, 2011, and 2016
                             In both surveys, each company was asked to provide information on the total number
                        of bed bug treatments per year using predefined categories or intervals: 0, 1–10, 11–50,
                        51–100, 101–500, 501–1000, 1001–2000, 2001–3000, and >3000. (The intervals are inten-
                        tionally narrower for smaller treatment numbers since this allowed better assessment of
                        growth of the bed bug problem.) The median value of these intervals was used to convert
                        categorical variables into numerical variables. The number 3500 was used for >3000. ‘Did
                        not provide treatment’ was considered as 0, and ‘Don’t know’ was treated as missing
                        data. Further, each company was asked to provide information on the percentage of their
                        overall bed bug work in each Ohio county in 2011 (first survey) and 2016 (second survey).
                        Therefore, the number of bed bug treatments by each company in each county was calcu-
                        lated by multiplying the number of treatments (median) with the corresponding weight
                        in the county category. Then the number of bed bug treatments in a county was summed
                        for all companies working there based on survey data. For example, if 4 of 6 company
                        respondents that worked in county X reported annual treatment numbers of 5.5 (median
                        of 1–10), 30.5 (median of 11–50), 75.5 (median of 51–100), and 300.5 (median of 101–500),
                        and their percentage of work in county X was 90%, 60%, 10%, and 10%, respectively, then
                        the number of treatments in county X based on survey data was 61.3 [5.5(0.9) + 30.5(0.6) +
                        75.5(0.1) + 300.5(0.1)]. If all 4 companies worked exclusively in county X, the number of
                        treatments would be 412 (5.5 + 30.5 + 75.5 + 300.5).
                             Additionally, information on the total population of licensed companies in each Ohio
                        county was available in the ODA distribution lists from 2011 and 2016. Companies that
                        did not perform bed bug work were removed from each list based on (1) survey responses
                        and (2) a search of exclusionary key words, such as bird, lawn, landscape, tree, weed,
                        and wildlife, in their company name or email. There were an estimated 475 companies
                        in Ohio that provided bed bug treatments in 2011 (first survey) and 797 companies in
                        2016 (second survey). The number of bed bug treatments in a county (survey data) was
                        adjusted by the response rate in that county (total number of companies in a county/the
                        number of companies in county that responded to the survey). Continuing with the above
                        example for county X, if 12 licensed companies were listed in that county during 2011,
                        and a sum of 61 treatments was provided by 4 of 6 survey respondents working in that
                        county, then 61(12/6) = 122.6 total treatments. In this way, the estimated total number of
                        bed bug treatments in each county was determined for 2005, 2011, and 2016, and these
                        numerical values were used to plot heat maps [30].
                             Note that 2005 estimates have the most uncertainty since adequate information was
                        unavailable that year regarding the total population of companies per county and the
                        percentage of work performed by each company in each county. Estimates of total treat-
                        ments in 2005 are based on the total population of companies per county in 2011 and the
                        percentage of work performed by each company in each county in 2011.

                        2.2. Treatment Sites and Treatment Types
                             Each company was asked to indicate sites (i.e., hotels, office buildings, hospitals,
                        schools, vehicles, etc.) where they provided bed bug treatments and the percentage of their
                        overall bed bug work at each site in 2011 and 2016. The number of treatments per site was
                        calculated by multiplying the number of treatments per company with the corresponding
                        weight in the site category, and then summing for all companies. Companies also were
                        asked to provide information on the types of treatments that they used such as insecticides,
                        structural fumigation, heat and cold treatment, and laundering.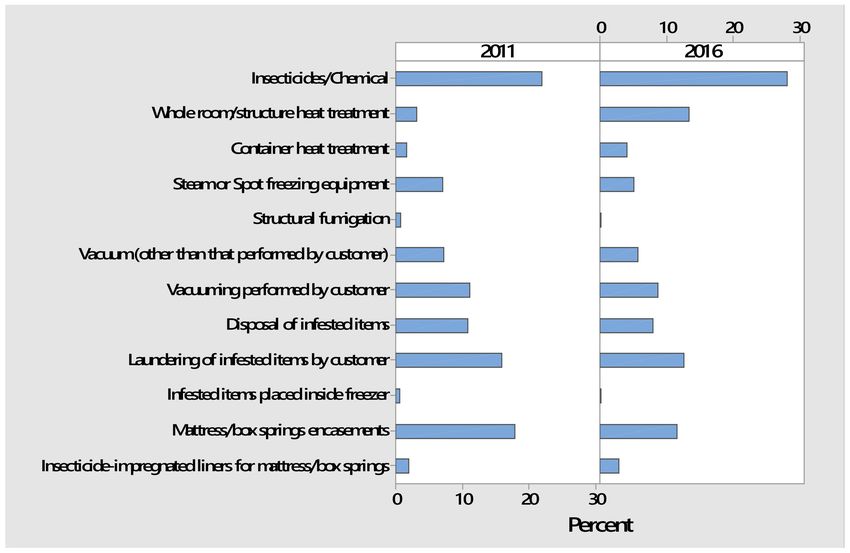
Insects 2021, 12, 133                                                                                         5 of 20

                        2.3. Statistical Analyses
                             Basic summary statistics were calculated for survey responses. These statistics in-
                        cluded the number of respondents to each question, the frequency of responses to questions
                        where the respondent was given several choices, and the mean and standard deviation
                        for questions where the required response was a number. The Chi-Square Test of Inde-
                        pendence (alpha = 0.05) was used to determine whether categorical responses in 2011 and
                        2016 were independent or related. SPSS software (Statistical Product and Service Solutions;
                        IBM Corp., Armonk, NY, USA) was used for data analyses.

                        3. Results and Discussion
                        3.1. Number of Survey Respondents and Company Characteristics
                             The response rate for the first survey, in 2011, was 35.6% (225/632). The mode of
                        response was almost evenly split between mail (n = 123, 54.7%) and online (n = 102, 45.3%).
                        Of the 202 respondents providing information on their business location, 91.6% were in
                        Ohio (59 of 88 counties) and 8.4% were situated out of state but doing pest control in Ohio.
                        The oldest companies were established in the early 1900s (n = 2). The largest numbers
                        of companies were established in 2010 and 2011. The midpoint was 1994, with 50% of
                        respondents established before and after that time. A total of 205 companies provided
                        information on the number of employees during 2011—a few companies consisted of only
                        the owner (n = 6, 2.9%); most companies had ≤5 employees (n = 145, 70.7%); and the
                        largest company had 80 employees.
                             The response rate for the second survey, which requested data for 2016, was 31.6%
                        (329/1041). In contrast to the first survey, the mode of response was primarily online
                        (90.9%). Business location was provided by 309 respondents. Companies were widely
                        distributed throughout the state, occurring in 65 of 88 counties. The oldest companies
                        were established in the early 1900s (n = 3). There was a large spike in the number of
                        companies in 2012 and 2013. The midpoint was in year 2000. A total of 256 companies
                        provided information on their employee numbers during 2016—as in the first survey, a few
                        companies consisted of only the owner (n = 6, 2.3%) and the majority of companies had
                        ≤5 employees (n = 177, 69.1%). However, there were more larger companies in 2016 than
                        in 2011, with 3.1% of respondents having 100 to 450 employees and one company having
                        2000 employees.

                        3.2. Bed Bug Treatments by Licensed PMPs
                             In the first survey, 208 companies answered the question “Do you provide treatment
                        services for bed bugs?” with 140 (67.3%) answering “Yes” and 68 (32.7%) answering “No”
                        for 2011. In the second survey, 309 companies answered this same question, with 204
                        (66.0%) answering affirmatively for 2016. This percentage is comparable to the first survey.
                        Ohio’s bed bug data are based on the 140 companies that provided bed bug treatment
                        services in 2011 and the 204 companies that did so in 2016.
                             Some general trends were evident regarding company location and bed bug treatments.
                        Companies located in counties with large metropolitan areas tended to be more numerous
                        and their bed bug work was concentrated in their home county. However, larger companies
                        were most likely to perform bed bug work in multiple counties. Companies located in
                        rural counties tended to be smaller and their bed bug work often was more dispersed,
                        encompassing their home county and one or more adjacent counties.

                        3.2.1. Estimated Total Numbers of Treatments and Geographic Distribution in Ohio
                             Treatment data strongly suggest that Ohio’s bed bug problem started in the extreme
                        SW corner of the state in Hamilton County. In 2005, Hamilton County had five times more
                        total treatments (approximately 4500) than the second-ranking county, centrally located
                        Franklin County, with approximately 850 treatments (Figure 2). This occurred despite
                        Franklin County being more populous. Additionally, there appeared to be spillover of the
                        bed bug problem from Hamilton County into nearby counties (Figure 2): Butler County had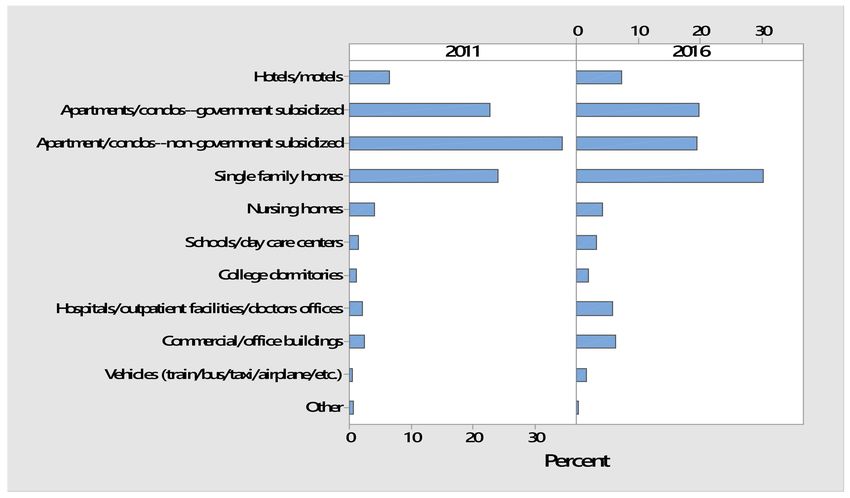
Insects 2021, 12, 133                                                                                                6 of 20

                        approximately 450 treatments and Clermont County had approximately 200 treatments;
                        Montgomery County had almost 100 treatments. In my capacity as Ohio State University’s
                        State Extension Specialist on Household Pests, I received my first call about bed bugs
                        in 2004 from Cincinnati—the caller, a senior citizen, described living in a government-
                        subsidized high-rise building that was over-run with bed bugs. Additional evidence of the
                        bed bug problem in Hamilton County in the early to mid-2000s is provided by Hamilton
                        County Public Health, which recorded its initial bed bug complaints in 2003 and 2004
                        (2 complaints each year) followed by 37 complaints in 2005 [21]. In contrast, Columbus
                        Code Enforcement received its first bed bug complaints (4) in 2005 (S. Carpenter, personal
                        communication) [31].

                        Figure 2. Heat map of estimated total number of bed bug treatments performed by licensed compa-
                        nies in each Ohio county during 2005. As shown in the key, the darkest shade of orange red indicates
                        a maximum threshold of approximately 4500 treatments.

                             Elsewhere in Ohio during 2005, more bed bug treatments were performed in counties
                        with large cities (Figure 2): Lucas County (Toledo) and Cuyahoga County (Cleveland) had
                        approximately 200 treatments each. Otherwise, most counties in Ohio (52) had approxi-
                        mately 15 or fewer total treatments, with 36 of these counties having 2 or fewer treatments.
                        Note, however, that these lower numbers may not be very reliable since having too few
                        points upon which to base the surface typically leads to larger errors in heat maps [30].
                        No data were provided for 20 counties. This is consistent with the relatively small number
                        of companies (n = 62, 44.5% of respondents) that did bed bug work in 2005.
                             The approach for estimating total treatments in 2005 can lead to errors due to reliance
                        on 2011 data regarding the total population of licensed companies and the percentage of
                        each company’s work per county (see Materials and Methods). Reliance on these 2011
                        data likely led to underestimates of total treatments per county in 2005, since the total
                        population of licensed companies should have been smaller in 2005 and bed bug jobs
                        also should have been more concentrated in the relatively few counties with bed bugs
                        (Figure 2).
                             Nonetheless, the raw data lend support for the abovementioned treatment estimates,
                        with companies located in 19 counties reporting that they treated for bed bugs during 2005.
                        Six of 14 company respondents in Hamilton County plus 3 of 4 out-of-state companies that
                        did most work there reported median treatment numbers of 5.5, 750.5, 30.5, 5.5, 5.5, 750.5,
                        5.5(0.7), 3500(0.9), and 75.5(0.75), respectively. These data include the largest number of
                        treatments during 2005, which was reported by a relatively large, well-established company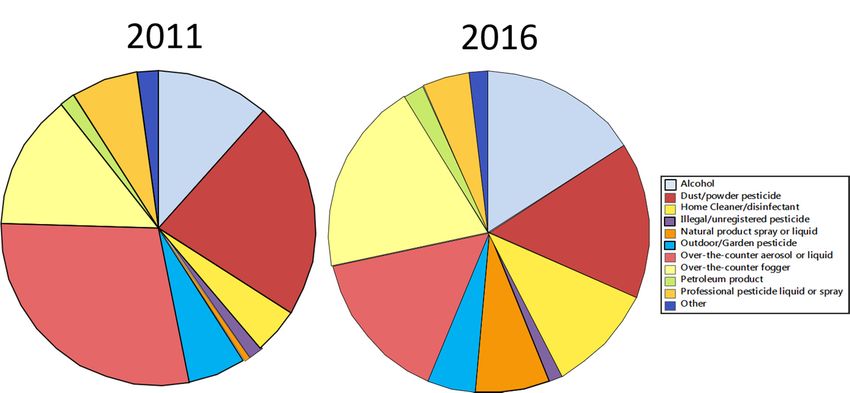
Insects 2021, 12, 133                                                                                              7 of 20

                        (upper 15% of company sizes in Ohio and >30 years old in 2005). In nearby Montgomery
                        County, 2 of 6 companies both reported 5.5 treatments during 2005. Low numbers of
                        treatments also were reported in 7 additional counties in SW Ohio, with 5.5 treatments
                        each in Brown, Greene, Highland, Preble, and Warren counties and 30.5 treatments each
                        in Butler and Clermont counties. Hence the raw data from 2005 lend strong support for
                        the hypothesis that Ohio’s bed bug problem originated in Hamilton County. Furthermore,
                        compared to the 2005 heat map (Figure 2), these raw data more clearly demonstrate that
                        the bed bug problem was becoming widespread in SW Ohio in 2005.
                             In central Ohio, raw data indicated that 10 of 20 company respondents in Franklin
                        County, the most populous county in the state, reported bed bug treatments ranging
                        from 5.5 to 300.5 during 2005. In the adjacent counties of Delaware and Licking, a single
                        company from each county reported 5.5 bed bug treatments. In NW Ohio, 3 of 5 companies
                        located in Lucas County reported from 5.5 to 75.5 treatments. In NE Ohio, Cuyahoga and
                        Summit counties also had companies reporting low numbers of treatments (5.5 to 30.5).
                        Similarly low treatment numbers were reported by companies located in the remaining 4
                        of 19 counties (Belmont, Hocking, Pike, Portage). Hence, the raw data and the 2005 heat
                        map (Figure 2) both showed that bed bug treatments generally were more numerous in
                        Ohio counties with large cities. Overall, the raw data support the conclusions drawn from
                        the 2005 heat map.
                             The maximum number of treatments in Ohio counties greatly increased from 2005
                        (Figure 2) to mid-2011 (Figure 3). Since only 6 months of treatment data were obtained for
                        2011, it is likely that the following treatment numbers throughout the state would have
                        increased, perhaps doubled, by the end of the year.

                        Figure 3. Heat map of estimated total number of bed bug treatments performed by licensed compa-
                        nies in each Ohio county during first half of 2011. The darkest shade of green indicates a maximum
                        threshold of approximately 17,000 treatments.

                             In mid-2011, Franklin and Hamilton counties still had the most bed bug treatments
                        (Figure 3), with approximately 17,000 and 16,000, respectively. The growing bed bug
                        problem in both counties is consistent with increasing complaints to city and county
                        health departments. For example, the Cincinnati Health Department registered more
                        than 700 complaints in 2007 (the first year that it compiled these data) and just over
                        1100 complaints in 2008 [21]. Columbus Code Enforcement recorded 33 complaints in
                        2007, with that number increasing to 178 the next year [31]. Furthermore, in 2008, growing
                        concerns about bed bugs led to the formation of local bed bug task forces: The Joint Bed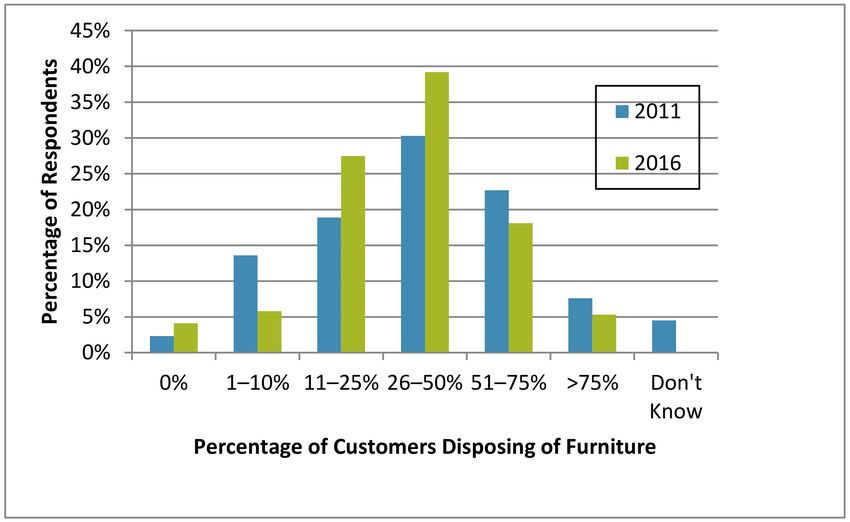
Insects 2021, 12, 133                                                                                             8 of 20

                        Bug Task Force in Cincinnati/Hamilton County and the Central Ohio Bed Bug Task Force
                        in Columbus/Franklin County; I was a member from their inception onward. In early
                        2009, an informal survey of selected pest control companies revealed that numerous
                        companies in Cincinnati received hundreds of bed bug calls weekly (M. Beal, personal
                        communication) [32]. Cincinnati ranked #1 in the nation in both 2010 and 2011 based on
                        the number of annual bed bug treatments performed by Orkin; Columbus ranked close
                        behind at #3 in 2010 and #6 in 2011 [24].
                             In addition to Hamilton County, large numbers of treatments predominated in counties
                        in the SW corner of the state (Figure 3), with Montgomery, Butler, and Warren counties
                        estimated at 11,000; 5500; and 3000 total treatments, respectively. In 2009, the “Bed Bug War”
                        in downtown Dayton was featured in The Dayton Daily News when a high-rise apartment
                        building required fumigation because it was so heavily infested with bed bugs [33].
                             In NE Ohio during 2011, Cuyahoga County had approximately 5000 total treatments,
                        with approximately 500 treatments in both Summit and Stark counties. In NW Ohio, Lucas
                        County had approximately 1200 treatments.
                             Bed bug problems also appeared to have spread to many other counties by mid-2011,
                        with an estimated 100 treatments or more in 45 of Ohio’s 88 counties. Approximately 15
                        or fewer treatments were performed in 20 counties, including just 1 treatment in Carroll
                        County. As previously noted, few data points lead to larger errors in heat maps [30].
                        No data were available for 6 counties (Figure 3), including 3 (Harrison, Noble, and Monroe)
                        that ranked among the 5 least populous counties in Ohio in 2011 [28].
                             In 2016, the maximum number of treatments in one county increased to over 38,000
                        (Figure 4); this occurred in heavily populated Franklin County in central Ohio. Two adjacent
                        counties, Delaware and Fairfield, both had approximately 5000 treatments. In NE Ohio,
                        the second most populous county, Cuyahoga, had almost 24,000 treatments. The bed
                        bug problem increased in other nearby heavily populated counties, with Summit County
                        having almost 9000 treatments and Stark County having approximately 5000 treatments.
                        Just to the south of Stark County, Tuscarawas County had more than 6000 treatments.
                        In NW Ohio along Lake Erie, Lucas County had almost 12,000 treatments, which was a
                        huge increase from 2011. Also bordering Lake Erie, Sandusky, Erie, and Lorain counties
                        ranged from approximately 4000 to 6000 treatments. In SW Ohio, Hamilton County had
                        more than 12,000 treatments in 2016, which represents an apparent decline compared to
                        2011. Montgomery County had more than 7000 treatments.

                        Figure 4. Heat map of estimated total number of bed bug treatments performed by licensed compa-
                        nies in each Ohio county during 2016. The darkest shade of blue indicates a maximum threshold of
                        approximately 38,000 treatments.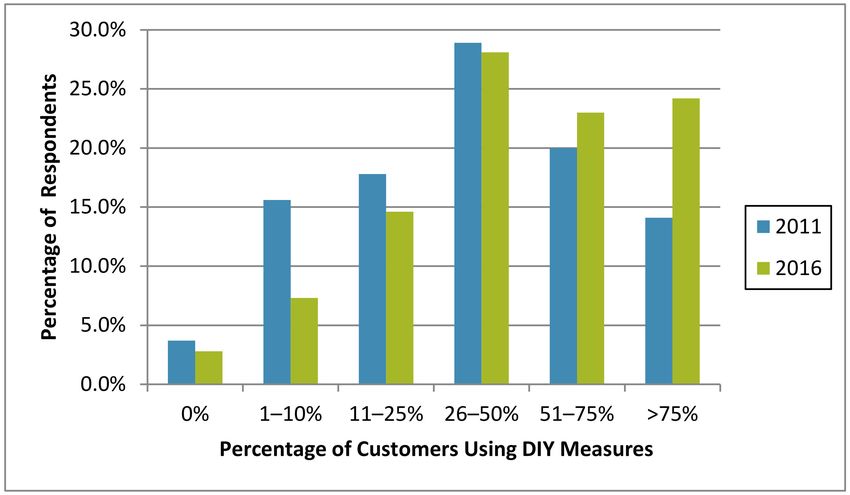
Insects 2021, 12, 133                                                                                                         9 of 20

                                        Notably, in 2016, bed bug treatments occurred in 85 of Ohio’s 88 counties, with no data
                                  available for the remaining 3 counties (Figure 4). The fewest treatments, approximately 40,
                                  were in both Monroe and Williams counties, which rank 66th and 87th in population size,
                                  respectively [28]. Otherwise, in counties not previously mentioned, treatments typically
                                  ranged from approximately 100 to 3500. Note that Jefferson and Harrison counties (near
                                  the border with the northern panhandle of West Virginia) lacked data for the entire survey
                                  period (2005 to 2016).
                                        In 2016, Ohio survey data revealed that the top 5 counties [major city] for bed bugs
                                  were: (#1) Franklin [Columbus], (#2) Cuyahoga [Cleveland], (#3) Lucas [Toledo], (#4) Hamil-
                                  ton [Cincinnati], and (#5) Summit [Akron]. In comparison, two nationwide companies
                                  provided 2016 bed bug data based on treatments performed by their branch offices in
                                  municipal areas. Five of Ohio’s major cities were in Terminix’s 2016 list of the top 15 most
                                  bed bug-infested cities in the US, with Cleveland-Akron ranking #3, Dayton #5, Columbus
                                  #7, Cincinnati #8, and Toledo #12 [25]. Orkin’s 2016 list of the most bed bug-infested
                                  cities nationwide ranked Columbus as #5, Cincinnati #8, and Cleveland-Akron-Canton as
                                  #13 [26]. In contrast, the 2016 survey of Ohio PMPs indicated that the number of treatments
                                  (approximately 38,000) were comparable for Franklin County (Columbus) and the three
                                  combined counties that include Cleveland-Akron-Canton. The current study is expected to
                                  be more realistic since treatment data are not company specific.
                                        Treatment data from this study show that bed bug problems can grow and spread
                                  quickly. Furthermore, urban areas are particularly impacted by bed bug infestations. This
                                  study should alert the public as well as federal, state, and local officials that bed bugs need
                                  to be dealt with quickly rather than waiting until they become an even bigger problem.

                                  3.2.2. Treatment Sites
                                       The most bed bug treatments were in apartments/condos and single-family homes in
                                  both 2011 and 2016 (Table 1). However, PMPs performed bed bug treatments in a wide
                                  variety of additional indoor settings such as hotels/motels, nursing homes, schools/day
                                  care centers, medical facilities, office buildings, and vehicles. The “other” category had a
                                  wide variety of sites such as camp cabins, churches, libraries, storage units, and warehouses.

                                         Table 1. Sites treated by licensed PMPs in 2011 and 2016.

                                                                                          Frequency of Responses 1
                        Treatment Site
                                                                                  2011                               2016
                      Hotels/motels                                               2117                                4743
      Apartments/condos—government subsidized                                     7457                               12,748
     Apartment/condos—non-government subsidized                                  11,290                              12,500
                   Single-family homes                                            7852                               19,411
                      Nursing homes                                               1319                                2689
                Schools/day care centers                                           498                                2061
                   College dormitories                                             355                                1289
      Hospitals/outpatient facilities/doctors’ offices                             691                                3794
              Commercial/office buildings                                          802                                4084
         Vehicles (train/bus/taxi/airplane/etc.)                                   160                                1061
                           Other                                                  195                                  178
                                   1   Respondents had the option of selecting one or more treatment sites.

                                      The percentage of treatment sites significantly differed (p < 5.2 × 10⁻¹³ ) between 2011
                                  and 2016 (Chi-Square Test of Independence). The bar charts in Figure 5 show that the most
                                  evident change from 2011 to 2016 was a large increase in the percentage of single-family
                                  homes and a decrease in non-government subsidized apartment/condos.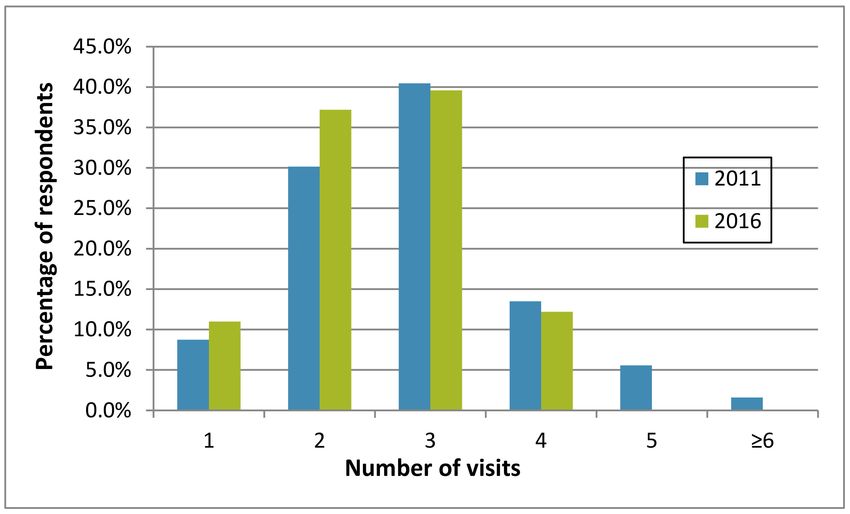
Insects 2021, 12, 133                                                                                                                          10 of 20

                                      Figure 5. Percentages of bed bug treatment sites in 2011 and 2016.

                                      3.2.3. Types of Treatments Used by PMPs
                                            The diverse types of treatments that PMPs typically used to control bed bugs are
                                      listed in Table 2. Insecticides/chemicals were most frequently used by PMPs in both 2011
                                      and 2016. Nonetheless, all respondents said that they used a combination of the listed
                                      treatments, which represents an IPM approach for bed bugs. Hence, the current study
                                      further documents PMPs adoption of IPM for urban pests, which was found to be a general
                                      trend within the US pest management industry in the late 1990s [34]. Insecticides have
                                      long been a mainstay for treating bed bugs [5,14–16,35,36], although these insects quickly
                                      develop resistance to insecticides [13–16,37]. Bed bug populations in the US have shown
                                      resistance or reduced susceptibility to pyrethroids [37–41] and newer insecticide classes
                                      such as neonicotinoids and pyrroles [42].

                  Table 2. Types of treatments used by Ohio’s licensed PMPs for bed bug management in 2011 and 2016.

                                                                                              Frequency of Responses
                        Type of Treatment 1,2
                                                                                     2011                                      2016
                  Insecticides/Chemical 3                                             125                                       297
           Whole room/structure heat treatment                                         18                                       142
                 Container heat treatment                                               9                                        43
             Steam or spot freezing equipment                                          40                                        54
                   Structural fumigation                                                4                                         2
    Vacuum (other than that performed by customer)                                     41                                        60
           Vacuuming performed by customer                                             63                                        92
                 Disposal of infested items                                            62                                        85
        Laundering of infested items by customer                                       91                                       134
            Infested items placed inside freezer                                        3                                         1
            Mattress/box springs encasements                                          102                                       122
 Insecticide-impregnated liners for mattress/box springs                               11                                        31
      1 Respondents had the option of selecting one or more treatment types. 2 In order to keep the same number of categories, the ‘Other’ option
      in the 2016 survey (selected by 1.0% of respondents) is not listed. Physical removal using traps was most frequently mentioned. 3 In order
      to make the two years comparable, two categories, ‘Insecticide/Chemical sprays’ and ‘Insecticide/Chemical dusts,’ in the 2016 survey were
      combined into one category, ’Insecticide/Chemical.’.

                                           The least used treatment approaches were placing items into freezers and structural
                                      fumigation (Table 2). Heat kills bed bugs much quicker and tends to be more reliable
                                      than the fluctuating cold temperatures of household freezers [43]. Structural fumigation is
                                      the most expensive treatment type; it is imperative to have trained personnel and special
Insects 2021, 12, 133 11 of 20
equipment due in part to the extreme inhalation hazard posed by fumigants. Sulfuryl
fluoride, a restricted-use pesticide, is currently used for structural fumigations in the
US [44]. Fumigation requires a distinct license in Ohio (Category 10c) and other states.
The proportion of treatment types significantly differed between 2011 and 2016
(p < 2.2 × 10⁻¹⁶ , Chi-Square Test of Independence). The most evident change was that
whole room/structure heat treatment greatly increased and mattress/box springs encase-
ments apparently decreased (Figure 6). In 2011, commercial equipment for heat treatments
was still relatively new to the marketplace [14,45]. However, heat treatments subsequently
became a more widely used practice by PMPs, with numerous companies specializing in
this approach. Structural heat treatments require special equipment and trained personnel
to ensure that lethal temperatures are achieved throughout a structure while being safely
applied [46]. Heat treatment offers advantages such as reduced use of insecticide indoors,
faster efficacy, ability to treat diverse articles, and reduced effort processing electronics
and infested laundry [47]. This may help explain the decrease in laundering performed
by customers in the 2016 survey. Since heat provides no residual effects, it often is supple-
mented with targeted insecticide/chemical treatment, which was the most frequently used
treatment type in both surveys. There is no clear reason for the decrease in mattress/box
springs encasements in 2016.
Figure 6. Percentages of treatment types used by PMP respondents in 2011 and 2016.
3.2.4. Number of PMP Visits Per Infestation
In both surveys, the question was posed: “On average, how many total visits per
infestation are needed to achieve bed bug control?” Most licensed companies reported that
two to three visits were needed to eliminate an infestation in both 2011 and 2016 (Figure 7).
However, the range decreased over time, with no respondents in 2016 saying that five or
more visits were needed to achieve bed bug control. Presumably, this resulted from a larger
number of companies having more experience treating for bed bugs and their use of more
effective products. Few companies reported that only a single visit was needed for bed bug
control (8.7% in 2011 and 11.0% in 2016; Figure 7). In a 2005 survey of PMPs nationwide,
only 6.1% claimed successful bed bug control after a single treatment [3].Insects 2021, 12, 133 12 of 20
Figure 7. Number of treatment visits (1–≥6) to eliminate a bed bug infestation according to survey
respondents in 2011 and 2016.
3.2.5. Detection Methods Used by PMPs
Confirmation of bed bugs is a critical step in deciding whether to initiate treatment.
Respondents provided information on their use of common bed bug detection methods
(visual inspection, passive monitors, active monitors, and canines [2016 survey only]).
Bed bug detection using each of these methods is addressed in the USA’s National Pest
Management Association (NPMA) Best Management Practices for Bed Bugs (BMPs) [48].
These guidelines were developed by industry professionals, regulators, academics, and
entomologists.
The vast majority of Ohio PMPs indicated that they always or often used visual
inspection to help diagnose bed bugs (98.5% in 2011 and 96.5% in 2016). Other surveys
have reported similar findings [5–8,10]. Visual inspection depends on finding bed bugs
of any stage (egg, nymph, adult) and/or bed bug signs such as fecal deposits and shed
skins [20,48,49].
Visual detection based solely on bed bug bites is unreliable. Some people have no skin
reactions, particularly those who are older (>65 y) [49]. This finding is further supported by
interviews of elderly residents living in infested apartments [19,50]. Some others experience
red welts or redness/skin discoloration, with or without itchiness [20,49,51,52]. Bed bug
bites sometimes appear to have a linear or grouped pattern, with divergent opinions on
whether the bite pattern is diagnostic [53] or unreliable [52]. The NPMA BMPs [48] offer
the following guidance:
“9.7. The presence of skin reactions or assurances by residents that bed bugs are present
should be considered carefully.
9.7.1. It is not possible to tell from an apparent bite if it was caused by a bed bug because
skin reactions vary, and skin reactions from other insects may have similar appearance to
those of bed bugs.
9.7.2. Skin infections and conditions can also look like insect bites.”
Passive monitoring devices tend to be inexpensive options for bed bug detection,
but their efficacy can vary widely. Glue boards and sticky traps decreased as always- or
often-used-devices by Ohio PMPs from 38.5% in 2011 to 18.9% in 2016. In 2005, 67.9% of
PMPs nationwide reported using sticky traps [3]. Research has shown that sticky traps are
ineffective in capturing bed bugs [54].
Pitfall traps also are passive monitors, and they typically rely on their smooth inner
surface to prevent the escape of trapped bugs. Pitfall traps were not widely used by Ohio
PMPs. Respondents indicated that they never or rarely used them (65.1% in 2011 andInsects 2021, 12, 133 13 of 20
63.5% in 2016). A minority of respondents always or often used pitfall traps, with some
increase from 2011 (12.7%) to 2016 (19.5%). An optimal position for pitfall traps is under
furniture legs [55]. Several types of pitfall traps were found to be effective in detecting
and monitoring C. lectularius [55–57]. In a recent study, two commercially available pitfall
traps (ClimbUp Insect Interceptors and BlackOut BedBug Detectors) demonstrated high
detection rates with 1, 2, or 4 traps per apartment; however, it was important to situate one
trap near the bed when placing only a few monitors [54].
Active monitoring devices (traps using heat and/or chemical attractants such as
carbon dioxide or pheromones) were relatively new to the marketplace in 2011, and at that
time, few respondents indicated that they always or often used these devices (9.7%). Their
use more than doubled by 2016, with 24.4% of respondents always or often using active
monitoring devices. Research in occupied high-rise apartments showed that prototype
Verifi Bed Bug Detectors (3 per room) provided high bed bug detection rates when situated
near frequently used furniture [58]. In contrast, Verifi Bed Bug Detectors were found to be
ineffective in determining the bed bug burden in a Cleveland, Ohio emergency room [59].
However, their study design appears flawed because too few traps (6 total) were deployed
in an apparently large area with more than 30 rooms (no dimensions reported), the traps
were situated outside of patient rooms when bed bugs preferentially occupy sites near
human hosts, and lures were replaced at 4 months rather than the specified ≤ 90 d interval.
(Verifi Bed Bug Detectors and components are no longer commercially available due to the
company’s marketing decision.)
The 2016 survey respondents indicated that canine detection was not widely used
in Ohio. Only 10.1% of respondents always or often used canines; 71.1% said that they
never used them. In 2010, 15% of companies surveyed nationwide used trained dogs for
detecting bed bugs [5]. Although canines have a particularly good detection record in
controlled setting [49,60], their record in real-world settings is quite variable [14,61,62].
3.3. Residents’ Responses to Bed Bugs
Ohio PMPs provided information on their customers’ misidentification of bed bugs,
use of DIY pest control products, and furniture disposal. The surveys sought PMPs’ recall
of their customers’ actions in the recent past (2011 and 2016), not their general impressions
of the public.
3.3.1. Bed Bug Misidentification by Residents
In both surveys, PMPs provided information on the most common insects/things
that their customers misdiagnosed as bed bugs. Open-ended responses in the 2011 survey
provided for a huge variety of things such as bat bugs, carpet beetles, ticks, biting insects,
flea bites, feeling of being bit, dirt specks, debris, and lint (140 respondents). Responses
ranged from very general to extremely specific (e.g., beetles versus drug store beetles;
roaches versus German cockroach nymphs; mites versus chiggers).
Fixed responses in the 2016 survey are detailed in Table 3 for respondents who selected
one or more items from seven choices. Most respondents selected carpet beetles (adults,
larvae, or shed skins) and non-insects (skin scrapings, lint, debris, etc.). Carpet beetles
were ranked as the #1 most misdiagnosed. Cockroaches and bat bugs were next most
frequently misdiagnosed as bed bugs. Less commonly misdiagnosed were stored product
beetles, stink bugs, and “other.” The latter category was selected by 28 respondents who
listed a total of 18 different things. Fleas were listed by the most respondents (n = 10).
This was followed by ticks (n = 3), multicolored Asian lady beetles (n = 2), scabies (n = 2),
and delusory parasitosis/phobia (n = 2). Singular responses included such things as ants,
aphids, crab lice, millipedes, moths, and no-see-ums.Insects 2021, 12, 133 14 of 20
Table 3. Insects or things that customers misdiagnosed as bed bugs according to 2016 survey respondents.
Insects/Things Misdiagnosed as Bed Bugs Frequency of Responses 1,2 Frequency of Rank #1 3
Carpet beetles (adults, larvae, or shed skins) 79 37
Cockroaches 47 10
Stink bugs 26 2
Stored product beetles 33 0
Bat bugs 41 8
Non-insects (skin scrapings, lint, debris, etc.) 80 29
Other 28 14
1 Respondents had the option of selecting one or more misdiagnosed things from list of 7 choices. 2 Total of 128 respondents. 3 Total of
102 respondents provided ranking.
PMP respondents estimated that approximately 15% of customers asked for bed bug
treatment when told that they had a different pest. Irrational fear of bed bugs often plays a
role in such requests. People also may incorrectly attribute an undiagnosed skin reaction
to bed bugs. Furthermore, the public does not necessarily understand that insects have
diverse behaviors and habitats, and treatment needs to be tailored to each pest. More
public education is needed to address such issues.
3.3.2. Do-It-Yourself (DIY) Bed Bug Control by Residents
Many companies estimated that more than half of their customers initially used DIY
measures against bed bugs before calling for professional services, with this perception
increasing from 2011 to 2016 (34.1% and 47.2% of respondents, respectively; Figure 8).
This is similar to the perspective of PMPs nationwide—in 2010, 51% of U.S. PMPs esti-
mated that 50% or more of their customers attempted DIY bed bug control before calling
a professional [5]. A 2013 survey in Philadelphia, Pennsylvania, USA, noted that 69.2%
of households self-reported attempting to eliminate bed bugs without professional assis-
tance [63]. A myriad of factors may be related to residents’ reliance on DIY measures. Some
do not report a bed bug problem because of embarrassment, fear of eviction, the expense
of paying for treatment, or failure to recognize the pest [51].
Figure 8. Estimated percentage of customers using DIY measures before calling for a licensed
professional in 2011 and 2016.
In the 2016 survey, when asked about customer success using DIY measures, the ma-
jority of Ohio PMPs thought that none of their customers were able to solve their bed bug
infestation (62.1%). Some PMPs thought that approximately 1 to 10% of their customers
were successful (28.0%), particularly when they were dealing with only a few bed bugs,
but success was never achieved in a heavily infested residence. A few respondents estimatedInsects 2021, 12, 133 15 of 20
high success (70 to 90%) but typically specified that it was critical for customers to obtain
effective products (not over-the-counter [OTC] products) as well as professional advice on
how and where to apply products; early detection and minimal clutter also were essential.
PMPs perceptions of treatment success sharply contrast with some peoples’ percep-
tions. For example, in a Philadelphia survey, 44.4% of households perceived that they
eliminated bed bugs after solely using self-treatment measures [63]. Even with professional
treatment, 76% of residents thought that their apartment was no longer infested even
though bed bugs continued to be detected [50].
In the Ohio surveys, approximately half of respondents felt that customers stopped
DIY measures once professional services began, but the other half felt that some customers
continued with DIY contrary to PMP instructions. Continued DIY efforts can counteract
the non-chemical and chemical treatment measures implemented by professionals and
lengthen the time for bed bug elimination.
In both surveys, Ohio companies were asked to estimate their customers’ spending on
DIY bed bug products/treatments. In 2011, customers were estimated to spend approxi-
mately $171 ± $158 (mean, SD; US dollars), with a mode of $100 and a maximum of $1200.
In 2016, estimated DIY cost for customers was approximately $230 ± $430 (mean, SD) with
a mode of $100 and a maximum of $5000. These estimates are comparable to findings from
the 2013 Philadelphia survey—households that solely self-treated for bed bugs reported
spending from $10 to $800 (mean $229.10) [63].
3.3.3. Product Misuse by Residents
Ohio residents misused many products in their attempts to combat bed bugs. Misused
products included a wide variety of pesticides as well as chemicals commonly found in
and around the home or yard (Table 4). Likewise, PMPs nationwide reported seeing many
of these same ineffective and potentially dangerous measures [5]. In that 2010 survey,
U.S. PMPs felt that their customers with bed bugs were “not very” (31%) or “not at all”
(62%) concerned about applying insecticides. The U.S. Centers for Disease Control and
Prevention (CDC) documented 111 cases of poisoning associated with pesticide misuse by
individuals treating for bed bugs in 7 states during the period 2003 to 2010 [64].
Table 4. Products misused by residents in 2011 and 2016 according to Ohio PMPs.
Frequency of Responses 1
Products Misused by Residents
2011 2016
Alcohol (isopropyl, rubbing, etc.) 22 113
Dust/powder pesticide 42 112
Home cleaner/disinfectant 9 78
Illegal/unregistered pesticide 3 10
Natural product spray or liquid 1 53
Outdoor/garden pesticide 11 34
Over-the-counter aerosol or liquid 54 111
Over-the-counter fogger (bug bombs) 26 139
Petroleum product 3 15
Professional pesticide liquid or spray 13 34
Other 4 14
Total 188 713
1 Respondents had the option of selecting one or more misused products.
The proportion of products misused by residents significantly differed between 2011
and 2016 (p < 8.2 × 10⁻⁶ ). Pie charts for both years show that the most evident change
from 2011 to 2016 was increased misuse of bug bombs and alcohol, with decreased misuse
of OTC aerosol or liquid pesticides and dust/powder pesticides (Figure 9). Not only are
OTC foggers ineffective against bed bugs [65], but their chemical residues are deposited on
surfaces that humans frequently contact [66]. Another huge downside is that bug bombsInsects 2021, 12, 133 16 of 20
cause bed bugs to spread, even to adjacent apartments. Alcohol is ineffective against
bed bugs unless they drown in the liquid. Spraying alcohol on one’s shoes, luggage,
etc., is ineffective because alcohol quickly evaporates and does not kill the bugs on con-
tact. Furthermore, alcohol is highly flammable and can be dangerous if applied in large
quantities or aerosolized.
Figure 9. Proportion of products misused by residents in 2011 and 2016.
PMPs are in a unique position to know about product use and misuse by residents.
For example, when formulating their work plan, PMPs typically query residents as to
prior pesticide use. For their own protection, PMPs also need to ascertain what products
previously have been used, particularly when dusts, powders, or residues are visible on
indoor surfaces. Furthermore, as PMPs go about treating for bed bugs, they see product
containers in living areas, cabinets, trash cans, etc.
3.3.4. Furniture Disposal by Residents
Most survey respondents in 2011 and 2016 thought that their customers discarded
infested furniture to some extent (Figure 10). This perception slightly increased from 2011
to 2016 (93.1% and 95.9% of respondents, respectively). In a high-rise apartment building in
Indianapolis, Indiana, USA, 35% of surveyed residents in 2010 reported that they discarded
furniture [19].
Figure 10. Estimated percentage of customers discarding infested furniture in in 2011 and 2016.Insects 2021, 12, 133 17 of 20
Not only is furniture expensive, but replacement furniture can be quickly infested
by other bed bugs remaining in a residence. More importantly, throwing away infested
furniture increases the risk of spreading bed bugs on site and to others. If infested furniture
is unwanted, unsalvageable, or otherwise requires disposal, it first should be treated to kill
as many bed bugs as possible, then it should be damaged or defaced to make it unusable
so that others are not tempted to bring it into their residences. It is a good idea to clearly
label the item as having bed bugs. To prevent any remaining bed bugs from falling off
while the furniture is moved outdoors, it needs to be securely wrapped in plastic sheeting
(large items) or securely enclosed in a bag (small items). Infested furniture should be kept
wrapped while awaiting pickup and disposal. Ideally, it should be taken to the dump by
the customer. In both surveys, PMPs thought that most customers never or rarely followed
any of these steps for proper furniture disposal.
4. Conclusions
The magnitude and spread of bed bug infestations in Ohio were demonstrated by
treatment records of licensed PMPs. Data from 2005 indicated that Ohio’s bed bug problem
likely started in the SW corner of the state in Hamilton County (includes city of Cincinnati),
which incurred an estimated total of 4500 bed bug treatments. Numerous other less popu-
lous counties in SW Ohio also experienced bed bug treatments during 2005. The magnitude
of the bed bug problem in Ohio greatly increased in subsequent years, with a maximum
of approximately 17,000 total treatments during the first half of 2011 and approximately
38,000 total treatments during 2016. Bed bug problems expanded statewide from 7 counties,
with 100+ total treatments in 2005, to 45 counties in 2011, to nearly all 88 counties in 2016.
Ohio counties with large metropolitan areas were the most heavily infested with bed bugs.
The bed bug problem was exacerbated by residents’ behaviors that included misidentifying
bed bugs, attempting DIY pest control, misusing OTC products, and discarding infested
furniture. More public education is needed to stop such practices. This study shows that
bed bug problems grow and spread quickly; federal, state, and local officials and the public
should immediately deal with bed bugs.
Supplementary Materials: The following are available online at https://www.mdpi.com/2075-445
0/12/2/133/s1, Exhibit S1: 2011 Ohio Bed Bug Survey Questionnaire; Exhibit S2: 2016 Ohio Bed Bug
Survey Questionnaire; and Exhibit S3: List of Participating Companies.
Funding: This research was funded by the USDA National Institute of Food and Agriculture (NIFA),
grant numbers 2010-41534-21554 and 2014-70006-22507, distributed through the Ohio Extension
Implementation Program. This research also was supported in part by state and federal funds
appropriated to the Ohio Agricultural Research and Development Center, The Ohio State University,
and by USDA NIFA Hatch Project OHO01170.
Institutional Review Board Statement: Ethical review and approval were waived for this study
by The Ohio State University, Office of Responsible Research Practices. This research falls under
IRB exemption category #2 as it involved survey procedures send to adult licensees; the obtained
information was recorded in such a manner that the human subjects cannot be identified either
directly or through identifiers linked to the subjects; and any disclosure of the human subjects’
responses outside the research could not reasonably place the subjects at risk of criminal or civil
liability or be damaging to the subjects’ financial standing, employability, or reputation.
Informed Consent Statement: A consent cover page accompanied the survey questions, and these
were provided to participants by email or the US Postal Service for the 2011 and 2016 surveys. Thus,
participants’ consent was obtained by their voluntary answers to the survey questions either on-line
or by return postage.
Data Availability Statement: The data presented in this study are available on request from the
corresponding author. The data are not publicly available due to anticipated publication of one or
two related articles in technical magazines for the pest management industry, and these data are part
of a much larger dataset not yet published in its entirety.Insects 2021, 12, 133 18 of 20
Acknowledgments: Treatments reported herein are representative of thousands upon thousands of
Ohio residents whose lives were impacted by bed bugs, and I acknowledge and extend my sympathy
to affected individuals. I greatly appreciate the time and effort expended by the hundreds of licensed
companies that participated in one or both surveys. I thank the Ohio Extension Implementation
Program Coordinator, Joe Kovach in 2011 and James Jasinski in 2016, for including the bed bug
surveys in proposals for federal funding as the research would not have been possible without
financial support. I appreciate the cooperation of the Ohio Department of Agriculture, Pesticide
Regulation section. I thank the Ohio Pest Management Association (OPMA) for continuous support
of my research and extension activities; I appreciate survey assistance provided by OPMA mem-
bers, including Lonnie Alonso, Ron Belknap, Jason Carpenter, Mark Goodman, Jay Moran, Scott
Steckel, Gerry Wegner, and Melinda Howells. I thank Steven Naber, Jeni Squiric, Michael Matthews,
and Chenggong Han for statistical consulting services. I further thank Han for conducting heat map
analyses. I thank members of my lab including Josh Bryant, Kara Baker, Nina Bogart, and Sarah
Casey for providing technical support.
Conflicts of Interest: The author declares no conflict of interest. The funders had no role in the design
of the study; in the collection, analyses, or interpretation of data; in the writing of the manuscript,
or in the decision to publish the results.
References
1. Hwang, S.W.; Svoboda, T.J.; De Jong, I.J.; Kabasele, K.J.; Gogosis, E. Bed bug infestations in an urban environment. Emerg. Infect.
Dis. 2005, 11, 533–538. [CrossRef]
2. Krueger, L. Don’t get bitten by the resurgence of bed bugs. Pest Control 2000, 68, 58–64.
3. Gangloff-Kaufmann, J.; Hollingsworth, C.; Hahn, J.; Kard, B.; Waldvogel, M. Bed bugs in America: A pest management industry
survey. Am. Entomol. 2006, 52, 105–106. [CrossRef]
4. Anderson, A.L.; Leffler, K. Bedbug infestations in the news: A picture of an emerging public health problem in the United States.
J. Environ. Health 2008, 70, 24–27.
5. Potter, M.; Rosenberg, B.; Henriksen, M. Bugs without borders: Defining the global bed bug resurgence. Pest World 2010, Sept./Oct.,
8–20.
6. Potter, M.; Haynes, K.; Rosenberg, B.; Henriksen, M. Bugs without borders survey. Pest World 2011, Dec., 1–12.
7. Potter, M.F.; Haynes, K.F.; Fredericks, J.; Henriksen, M. Bed bug nation: Are we making any progress? Pest World 2013, 5, 4–11.
8. Sutherland, A.; Choe, D.-H.; Lewis, V.; Young, D.; Romero, A.; Spafford, H.; Gouge, D. Survey sheds light on bed bugs in
multi-unit housing. Pest Control Technol. 2015, 43, 26–36.
9. Kilpinen, O.; Jensen, K.-M.V.; Kristensen, M. Bed bug problems in Denmark, with a European perspective. In Proceedings of the
Sixth International Conference on Urban Pests, Budapest, Hungary, 13–16 July 2008; Robinson, W.H., Bajomi, D., Eds.; OOK Press:
Veszprém, Hungary, 2008.
10. Jourdain, F.; Delaunay, P.; Bérenger, J.-M.; Perrin, Y.; Robert, V. The common bed bug (Cimex lectularius) in metropolitan France.
Survey on the attitudes and practices of private- and public-sector professionals. Parasite 2016, 23, 38. [CrossRef] [PubMed]
11. Doggett, S.; Geary, M.J.; Russell, R.C. The resurgence of bed bugs in Australia: With notes on their ecology and control. Environ.
Health 2004, 4, 30–38.
12. Johnson, C.G. The ecology of the bed-bug, Cimex lectularius L., in Britain. J. Hyg. 1941, 41, 345–361. [CrossRef]
13. Usinger, R.L. Monograph of Cimicidae (Hemiptera-Heteroptera), the Thomas Say Foundation; Entomological Society of America:
Baltimore, MD, USA, 1966.
14. Pinto, L.J.; Cooper, R.; Kraft, S.K. Bed Bug Handbook: The Complete Guide to Bed Bugs and Their Control; Pinto & Associates, Inc.:
Mechanicsville, MD, USA, 2007.
15. Reinhardt, K.; Siva-Jothy, M.T. Biology of the bed bugs (Cimicidae). Annu. Rev. Entomol. 2007, 52, 351–374. [CrossRef]
16. Harlan, H.J.; Faulde, M.K.; Baumann, G.J. Bedbugs. In Public Health Significance of Urban Pests; Bonnefoy, X., Kampen, H.,
Sweeney, K., Eds.; World Health Organization: Copenhagen, Denmark, 2008; pp. 131–153.
17. Reis, M.D.; Miller, D.M. Host searching and aggregation activity of recently fed and unfed bed bugs (Cimex lectularius L.). Insects
2011, 2, 186–194. [CrossRef]
18. Romero, A.; Potter, M.F.; Haynes, K.F. Circadian rhythm of spontaneous locomotor activity in the bed bug, Cimex lectularius L.
J. Insect. Physiol. 2010, 56, 1516–1522. [CrossRef] [PubMed]
19. Wang, C.; Saltzmann, K.; Chin, E.; Bennett, G.W.; Gibb, T. Characteristics of Cimex lectularius (Hemiptera: Cimicidae) infestation
and dispersal in a high-rise apartment building. J. Econ. Entomol. 2010, 103, 172–177. [CrossRef] [PubMed]
20. Goddard, J.; de Shazo, R. Bed bugs (Cimex lectularius) and clinical consequences of their bites. J. Am. Med. Assoc. 2009, 301,
1358–1366. [CrossRef] [PubMed]
21. Eddy, C.; Jones, S.C. Bed bugs, public health, and social justice: Part 1, a call to action. J. Environ. Health 2011, 73, 8–14. [PubMed]
22. Sutherland, C.; Greenlee, A.J.; Schneider, D. Socioeconomic drivers of urban pest prevalence. People Nat. 2020, 2, 776–783.
[CrossRef]You can also read