MCUXpresso IDE LinkServer Energy Measurement Guide - Rev. 11.4.1 - 15 September, 2021 User guide - NXP
←
→
Page content transcription
If your browser does not render page correctly, please read the page content below
MCUXpresso IDE LinkServer
Energy Measurement Guide
Rev. 11.4.1 — 15 September, 2021   User guide
NXP Semiconductors                                         MCUXpresso IDE LinkServer Energy Measurement Guide

                                                                  15 September, 2021

                                                       Copyright © 2021 NXP Semiconductors

                                                                            All rights reserved.

MCUXpresso IDE LinkServer Energy Measurement Guide -       All information provided in this document is subject to legal disclaimers   © 2021 NXP Semiconductors. All rights reserved.

User Guide                                                 Rev. 11.4.1 — 15 September, 2021                                                                                         ii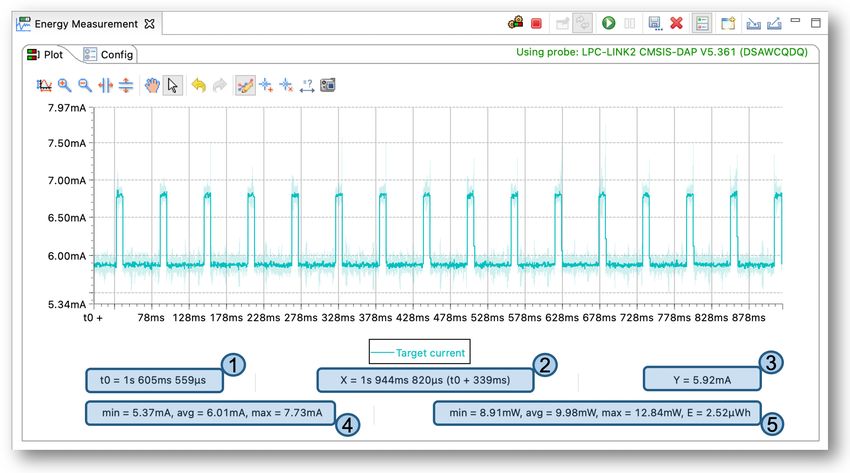
NXP Semiconductors                                        MCUXpresso IDE LinkServer Energy Measurement Guide

                             1. Energy Measurement overview ..................................................................................... 1
                             2. Quick start ................................................................................................................... 2
                             3. Energy Measurement firmware ...................................................................................... 3
                                  3.1. Overview ........................................................................................................... 3
                                  3.2. Which firmware should I use? ............................................................................ 3
                                  3.3. How to choose the firmware and download it ...................................................... 3
                                  3.4. Troubleshooting ................................................................................................. 6
                             4. Energy Measurement view ............................................................................................ 7
                                  4.1. Toolbar associated with the view ........................................................................ 8
                                  4.2. How to start an analysis session ........................................................................ 9
                                        4.2.1. Out of debug analysis session ................................................................. 9
                                        4.2.2. Debug context related analysis session .................................................... 9
                                  4.3. Status of the view ............................................................................................ 10
                                  4.4. Config tab ....................................................................................................... 10
                                        4.4.1. Sample duration .................................................................................... 10
                                        4.4.2. Analog configuration .............................................................................. 10
                                        4.4.3. Power and energy consumption configuration ......................................... 12
                                  4.5. Plot tab ........................................................................................................... 12
                                        4.5.1. Toolbar associated with the graph ......................................................... 12
                                        4.5.2. Graph ................................................................................................... 13
                                        4.5.3. Status line ............................................................................................ 15
                                  4.6. Export/Import data in raw format ...................................................................... 16
                             5. Precision and Accuracy .............................................................................................. 17
                             6. Appendix .................................................................................................................... 18
                                  6.1. Increasing Memory .......................................................................................... 18
                                        6.1.1. The INI File .......................................................................................... 18
                                        6.1.2. Not Enough Memory to Capture n Samples ............................................ 18
                                        6.1.3. Gaps in Trace ....................................................................................... 18
                                        6.1.4. Keeping Track of Memory Usage ........................................................... 18
                             7. Legal information ........................................................................................................ 19

MCUXpresso IDE LinkServer Energy Measurement Guide -      All information provided in this document is subject to legal disclaimers   © 2021 NXP Semiconductors. All rights reserved.

User Guide                                                Rev. 11.4.1 — 15 September, 2021                                                                                        iii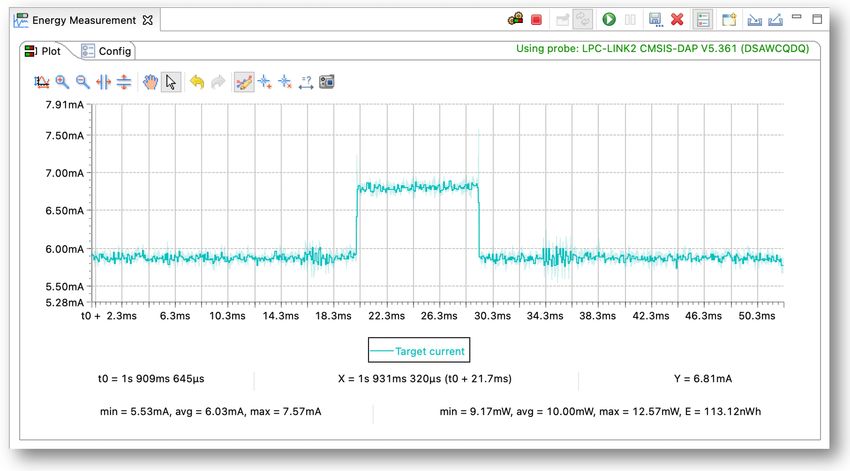
NXP Semiconductors                                         MCUXpresso IDE LinkServer Energy Measurement Guide

1. Energy Measurement overview
                             The Energy Measurement view enables the measurement of energy consumption on boards
                             that incorporate the power measurement circuit – for example the LPCXpresso 54102 or 5460x
                             boards. The Energy Measurement environment is composed of three parts:

                             1. A board featuring the power measurement circuit
                             2. The power measurement functionality built into the MCUXpresso IDE LPC-Link2/MCU-Link
                                CMSIS-DAP probe firmware
                             3. The MCUXpresso IDE Energy Measurement plug-in

                             The utility can capture a burst of detailed high-resolution power/energy usage data. It can capture
                             a burst of samples at up to 100ksps of either the target current usage, the target supply voltage,
                             the shield current, the analog input, the debug interface voltage reference or the target power
                             consumption. This information is displayed in a graph and can be exported for further analysis.
                             The average values of the collected data can also be displayed. Based on the type of data
                             collected, energy consumption details will be also computed and displayed.

                                                  Compatibility
                                                  MCUXpresso IDE’s Energy Measurement functionality can be used with the LPC-
                                                  Link2 hardware built into certain LPCXpresso boards that also have the required
                                                  power measurement circuitry. Please check the specification for your board at http://
                                                  www.nxp.com/lpcxpresso-boards to confirm that it is compatible. Moreover, Energy
                                                  Measurement functionality can be used with the MCU-Link probe which provides
                                                  power measurement capabilities. The Energy Measurement functionality cannot be
                                                  used with standalone LPC-Link2 debug probes, other CMSIS-DAP probes or third
                                                  party probes. Also it is not currently compatible with any Kinetis MCUs.

                             Note: The Energy Measurement functionality does not require an active debug session to capture
                             data, but can it be linked to one if such a session exists.

MCUXpresso IDE LinkServer Energy Measurement Guide -       All information provided in this document is subject to legal disclaimers   © 2021 NXP Semiconductors. All rights reserved.

User Guide                                                 Rev. 11.4.1 — 15 September, 2021                                                                                        1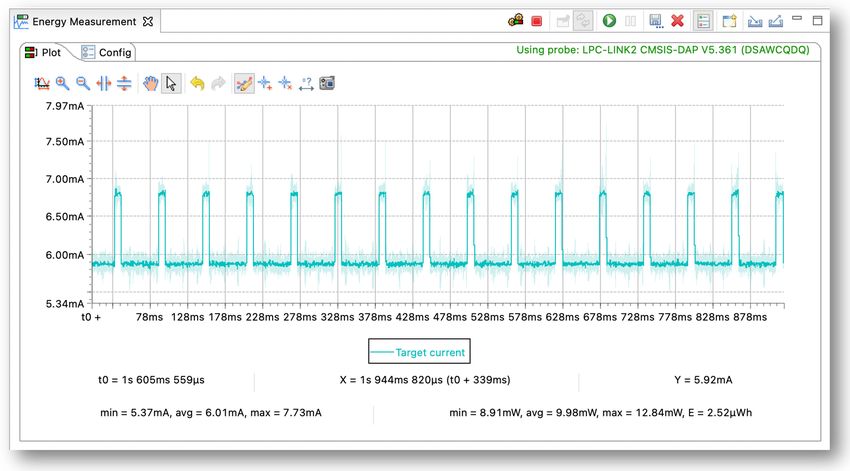
NXP Semiconductors                                     MCUXpresso IDE LinkServer Energy Measurement Guide

2. Quick start
                             In this quick start guide you’ll learn how to collect current measurements from the LPC54102
                             using the bridged version of the LinkServer CMSIS-DAP probe firmware.
                             1. Ensure that your development board is connected.
                             2. Ensure that the LPCXpresso CMSIS-DAP probe version 5.147 or later is booted. See Probe
                                Firmware [3] for detailed instructions.
                             3. Once the firmware is downloaded you can optionally download (and debug) your code to the
                                target if it is not already running in flash.
                             4. In MCUXpresso IDE, switch to the Energy Measurement View by:
                                • Typing “Energy” in the Quick Access search box and selecting Energy Measurement
                                • Using the Analysis menu: Analysis -> Energy Measurement
                                • Using the menus: Window -> Show view -> Other -> MCUXpresso IDE Trace and Energy
                                   Measurement -> Energy Measurement View
                             5. Start an analysis session by:
                                • Using the Identify probe for out-of-debug analysis button   if no debug session is active.
                                • Using the Link view with the currently selected debug context button           to associate
                                  the view with the selected debug session.
                             6. From Config Tab configure the data collection
                                • Depending on the use case, enable sampling for a specific time frame. If not enabled, data
                                  will be collected continuously but limited to a 300 seconds range.
                                • Select the data source from the Analog config section: the target’s VDD or current, or the
                                  shield’s current.
                                  • Note that only shields designed to work with the Energy Measurement will work (currently
                                    only NXP’s sensor shield Rev 3).
                                • Choose a sample rate between 50ksps and 100ksps.
                                • Configure hardware setup: power probe circuit, target resistor and shield resistor
                                • Provide the target voltage value. This parameter is used for power/energy calculation. If
                                  the target voltage value is not specified, nor read from target, energy consumption will not
                                  be displayed.
                             7. Press the Resume data display button .

                             The view will capture a burst of samples and display them in a chart (on Plot Tab).

                             Once all the data is collected you can explore the chart by clicking, dragging and zooming into
                             selected regions. For more information about using the graph see the Plot Tab [12] section.

                             The data associated with an analysis session can be exported as a zip file using the Export data
                             in raw format button            . Also, this zip file can be later imported in the same view or a new one
                             by using the Import data in raw format button                                       . For more details, see the Export/Import data
                             in raw format [16] section.

MCUXpresso IDE LinkServer Energy Measurement Guide -   All information provided in this document is subject to legal disclaimers     © 2021 NXP Semiconductors. All rights reserved.

User Guide                                             Rev. 11.4.1 — 15 September, 2021                                                                                          2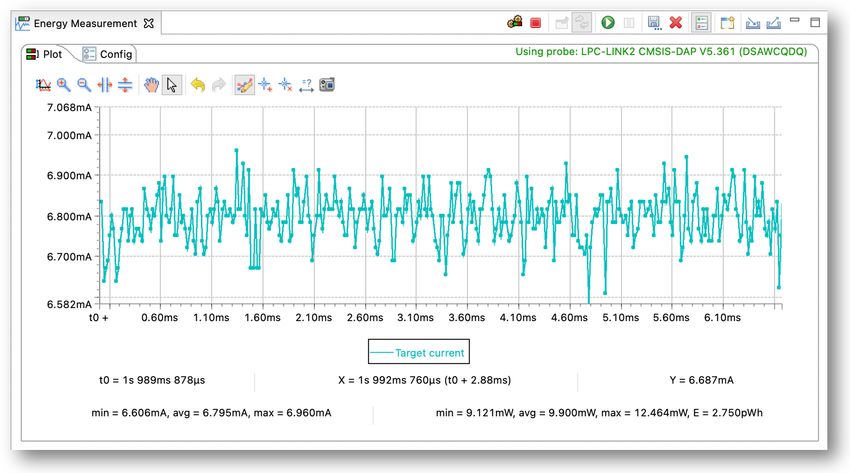
NXP Semiconductors                                         MCUXpresso IDE LinkServer Energy Measurement Guide

3. Energy Measurement firmware
                 3.1 Overview
                             The Energy Measurement utility requires version 5.147 or later of the LPC-Link2 CMSIS-DAP
                             firmware to be installed on the probe. This firmware provides a data channel through which the
                             analog collected information is sent to be displayed in MCUXpresso IDE.

                             The firmware is downloaded via the DFU mechanism. Since it resides in RAM you need to
                             re-download it every time the board is power cycled. MCUXpresso IDE will perform this step
                             automatically, but first you need to choose the version of the probe to use.

                             Note: You can optionally choose to program CMSIS-DAP firmware into your development board.
                             NXP provides a utility called LPCScrypt that can be used to perform this task.

                             The LPC-Link2 CMSIS-DAP firmware comes in two flavors: the “bridge probes”, which support
                             the analog and SWO data channels in addition to the trace channel, and the “non-bridged”,
                             which only provide the trace channel. The non-bridged versions are provided for customers who
                             experience USB bandwidth issues. If you are unable to debug your part with the bridged firmware
                             try switching to the non-bridged firmware – you will not be able to use the Energy Measurement
                             view, but should be able to do everything else.

                 3.2 Which firmware should I use?
                             There are a number of firmware choices:

                             1. CMSIS-DAP (Default)
                             2. CMSIS-DAP (Non-bridged – Debug only)

                             Choose the CMSIS-DAP (Default) option if you want to use the Energy Measurement or SWO
                             trace. If you debug in another tool chain, this option will allow MCUXpresso IDE to capture the
                             power data – even without an active debug connection. Note that MCUXpresso IDE does not
                             need to be debugging the target to be able to use the Energy Measurement view with this option.
                             For example, you could be tracking the energy usage in MCUXpresso IDE and debugging your
                             code in Keil uVision using this firmware. It also includes the SWO functionality and the serial I/
                             O bridge.

                             The CMSIS-DAP (Non-bridged – Debug only) option excludes the power tool, SWO trace and
                             Serial I/O bridge extensions. This version uses less USB bandwidth and should be used if you
                             experience USB issues. Energy Measurement and SWO trace will be unavailable.

                                                  Note
                                                  Version 5.147 or later of the NXP CMSIS-DAP firmware is required to use the Energy
                                                  Measurement functionality.

                 3.3 How to choose the firmware and download it
                             LPC-Link2

                             1. On the LPCXpresso board or LPC-Link2 make sure that the jumper beside the Link USB
                                socket is closed. This jumper puts the Link into DFU mode and allows new firmware to be
                                downloaded.
                             2. Connect the Link USB socket on the board to your computer.
                             3. Open the MCUXpresso IDE preferences page from the main menu bar
                                • Windows and Linux: Window -> Preferences
                                • Mac: MCUXpresso IDE -> Preferences

MCUXpresso IDE LinkServer Energy Measurement Guide -       All information provided in this document is subject to legal disclaimers   © 2021 NXP Semiconductors. All rights reserved.

User Guide                                                Rev. 11.4.1 — 15 September, 2021                                                                                         3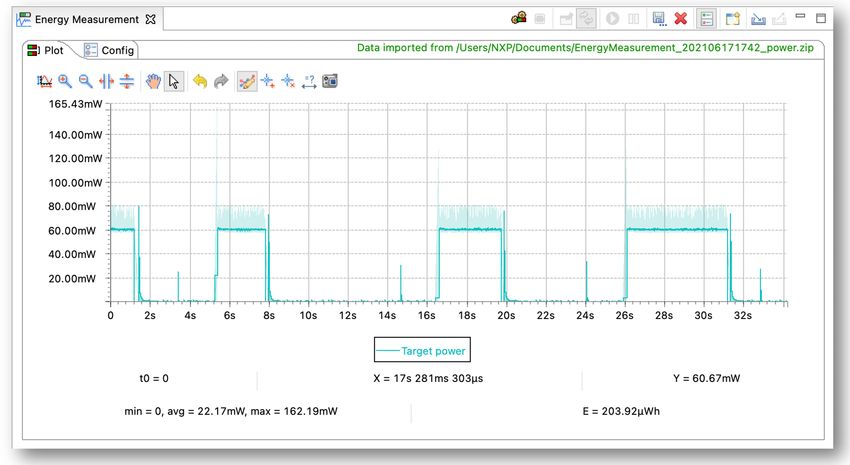
NXP Semiconductors                                     MCUXpresso IDE LinkServer Energy Measurement Guide

                             4. Locate the Redlink / LinkServer Options page by expanding the MCUXpresso IDE item.
                                  • Select “CMSIS-DAP (Default)” from the LPC-Link2 boot type options.
                                  •

                             5.
                                  Download the firmware to the probe by pressing the Boot Debug Probe button
                                  • If there is a probe in DFU mode the following dialog box will appear.
                                      •

                                      • Check the box next to LinkServer and press OK.
                                  • If the probe is not connected or the probe is not in DFU mode you will see this dialog after
                                    the previous step:
                                      •

MCUXpresso IDE LinkServer Energy Measurement Guide -   All information provided in this document is subject to legal disclaimers   © 2021 NXP Semiconductors. All rights reserved.

User Guide                                             Rev. 11.4.1 — 15 September, 2021                                                                                        4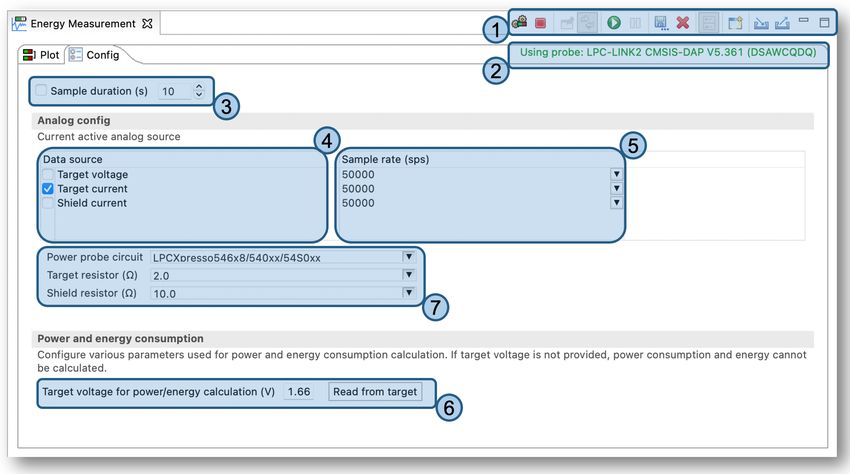
NXP Semiconductors                                        MCUXpresso IDE LinkServer Energy Measurement Guide

                                  • Double-check that the board is connected using the USB socket labeled Link (not Target)
                                    and that the jumper JP5 is closed; then power-cycle the board and retry.
                             6. The firmware will then be downloaded:
                                •

                                                  Note:
                                                  The firmware must be re-downloaded every time the probe is power-cycled. This
                                                  is done automatically if you are debugging with MUCXpresso IDE. Otherwise, you
                                                  need to use the Boot Debug Probe button                                             each time.

                             MCU-Link

                             For MCU-Link probes, the Probes Discovered will provide an indication if a newer firmware
                             version is available.

                             1. Once the Probes Discovered opens, a warning will indicate if there are debugger probes that
                                would require firmware update.
                             2. Each discovered probe will warn if a firmware update is available.
                             3. A tooltip (on each probe marked by a warning icon) will specify the firmware’s download
                                location and its version.

MCUXpresso IDE LinkServer Energy Measurement Guide -      All information provided in this document is subject to legal disclaimers                © 2021 NXP Semiconductors. All rights reserved.

User Guide                                                Rev. 11.4.1 — 15 September, 2021                                                                                                     5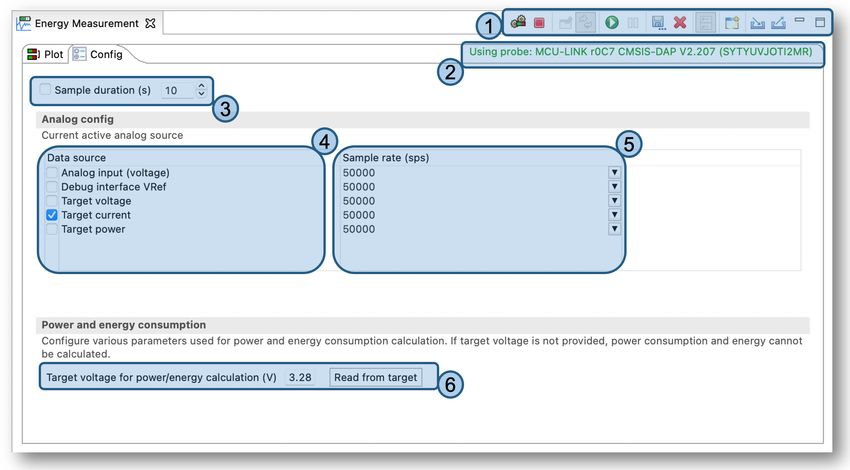
NXP Semiconductors                                     MCUXpresso IDE LinkServer Energy Measurement Guide

                             Note For details on how to update the MCU-Link firmware, follow the link from https://
                             www.nxp.com/document/guide/get-started-with-the-mcu-link:GS-MCU-LINK.

                 3.4 Troubleshooting
                             Time-out when downloading CMSIS-DAP probe on Windows - There is a conflict between
                             the latest CMSIS-DAP probe driver and an older driver. To resolve this, please see the FAQ
                             LPC-Link2 fails to enumerate with CMSIS-DAP firmware

MCUXpresso IDE LinkServer Energy Measurement Guide -   All information provided in this document is subject to legal disclaimers   © 2021 NXP Semiconductors. All rights reserved.

User Guide                                             Rev. 11.4.1 — 15 September, 2021                                                                                        6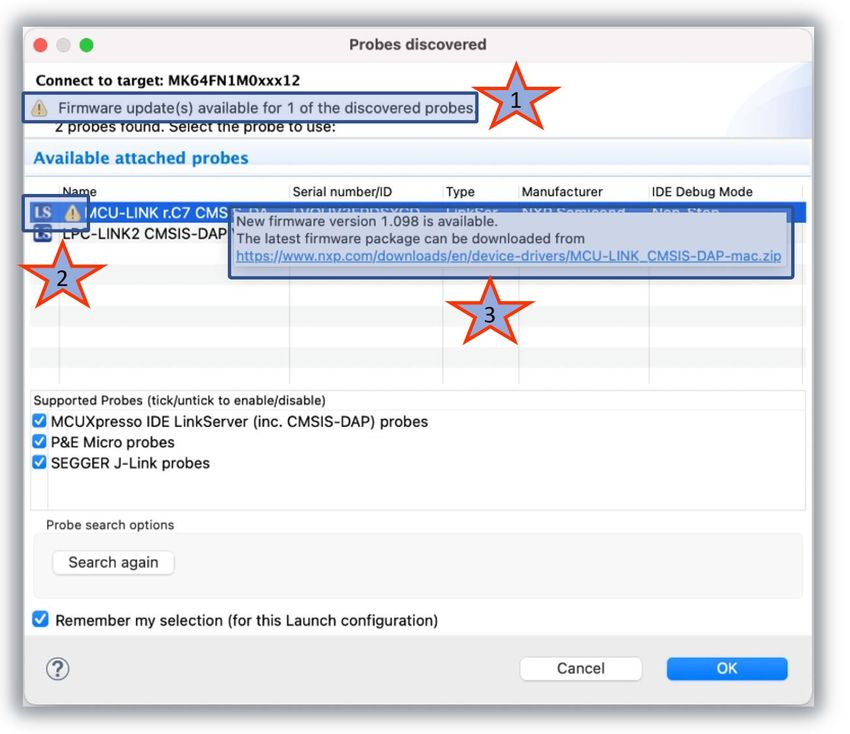
NXP Semiconductors                                     MCUXpresso IDE LinkServer Energy Measurement Guide

4. Energy Measurement view
                             Use the Energy Measurement view to collect and analyze bursts of high-frequency samples.
                             From this view you can choose and configure the measurement source, and then explore a graph
                             of the collected data. The Energy Measurement view contains two tabs: Plot tab and Config tab.

                             Plot tab:

                             Where:

                             1.   Toolbar associated with the view [8]
                             2.   Status of the view [10]
                             3.   Toolbar associated with the graph [12]
                             4.   Graph [13]
                             5.   Legend [13]
                             6.   Status line [15]

                             Config Tab:

                             The required configuration depends on the used probe.

                             LPC-Link2

MCUXpresso IDE LinkServer Energy Measurement Guide -   All information provided in this document is subject to legal disclaimers   © 2021 NXP Semiconductors. All rights reserved.

User Guide                                             Rev. 11.4.1 — 15 September, 2021                                                                                        7
NXP Semiconductors MCUXpresso IDE LinkServer Energy Measurement Guide
MCU-Link
Where:
1. Toolbar associated with the view [8]
2. Status of the view [10]
3. Sample duration [10]
4. Data sources [10]
5. Sample rate [11]
6. Power and energy consumption configuration [12]
7. Hardware configuration [11]
4.1 Toolbar associated with the view
This section contains a brief description of each button in the view’s toolbar.
• Identify probe for out-of-debug analysis button: discovers compatible probes and
prompts the user to select the probe to be used for analysis.
• Terminate button: terminates the current analysis session and disconnects from the probe.
• Link view to currently selected debug context button: links view with currently selected
debug session.
• Update plot even when target is suspended button: updates plot even when target is
suspended if the view is associated with a debug session.
• Resume button: starts or resumes data collection and updates plot.
• Pause button: suspends data collection.
• Save button: opens a save dialog to export an image of the plot as a png file.
• Clear button: clears the recorded data from the plot.
• Hide graph toolbar button: shows/hides the toolbar associated with the graph [12].
• Open new view button: opens a new Energy Measurement View.
• Import data in raw format button: imports an archive of previously saved data points, in
raw format.
• Export data in raw format button: exports an archive containing the collected data, in
raw format.
MCUXpresso IDE LinkServer Energy Measurement Guide - All information provided in this document is subject to legal disclaimers © 2021 NXP Semiconductors. All rights reserved.
User Guide Rev. 11.4.1 — 15 September, 2021 8NXP Semiconductors MCUXpresso IDE LinkServer Energy Measurement Guide
4.2 How to start an analysis session
The Energy Measurement view does not require an active debug session to capture data, but
can be linked to an active one if exists. Thus, there are two use cases: out of debug analysis
and debug context related analysis.
4.2.1 Out of debug analysis session
Use the Identify probe for out-of-debug analysis button to discover the compatible probes
that are connected. After that, the Probes discovered view will appear:
Select the probe you would like to use and press OK. Then, the Energy Measurement view will
be linked to the selected probe and the view’s status will update. For more details, see Status
of the view [10] section.
4.2.2 Debug context related analysis session
First of all, make sure there is an active debug session. The view can be associated with an
active debug session by:
• Using the Identify probe for out-of-debug analysis button
• Using the Link view to currently selected debug context button
Moreover, if the Energy Measurement view has already been associated with an out of debug
analysis session and then a debug session is started (using the same probe), the view will
automatically be linked to the newly started debug session.
The Energy Measurement view is able to collect and display data when target is running or when
target is suspended. By default, data is collected only while target is running. In order to collect
data even when target is suspended use Update plot even when target is suspended button
from the view’s toolbar.
Note:
The Energy Measurement View can use only one probe at a time. However, multiple
instances of the view can use different probes. If simultaneous data collection from
two probes is needed, it is possible to open a new view using the Open new view
MCUXpresso IDE LinkServer Energy Measurement Guide - All information provided in this document is subject to legal disclaimers © 2021 NXP Semiconductors. All rights reserved.
User Guide Rev. 11.4.1 — 15 September, 2021 9NXP Semiconductors MCUXpresso IDE LinkServer Energy Measurement Guide
button and associate each view with a different probe. The maximum number of
Energy Measurement views is two.
Note:
When using debug mode, some reduced power modes do not reach their normal
low-power state. Therefore power measurements might not be accurate in these
situations.
4.3 Status of the view
1. Used probe information
• No probe linked to the view message, in red. Appears when the user first opens a new
Energy Measurement view.
• Currently used probe message, in green. Appears after the user links a probe to the view by
either using an out-of-debug analysis session or by linking the view with a debug session.
• Previously used probe message, in gray. Appears after terminating the currently active
analysis session.
2. Import information
Displays which file is used for the data import, in green. Appears after importing an archive using
the Import data in raw format button .
4.4 Config tab
The configuration tab in the Energy Measurement view allows you to set the measurement
source, the sense resistors, the sample rate and the number of seconds to capture data for.
4.4.1 Sample duration
Sample duration specifies a fixed length of time to collect samples for, in seconds. When disabled,
data is collected until the Pause button is pressed. The maximum sampling duration is 300
seconds.
4.4.2 Analog configuration
Data source
The list of available sources depends on the used probe.
LPC-Link2
The data source can be one of:
• Target voltage
• Target current
• Shield current (requires the target shield to include current measurement hardware).
These sources measure target supply voltage, target or shield current, respectively.
MCU-Link
The data source can be one of:
• Analog input (voltage). A basic analog signal viewer – can be used to monitor an analog signal
connected to the external ANALOG_IN connector.
• Debug interface VRef. It measures the supply voltage at target SWD connector.
• Target voltage
• Target current
• Target power
MCUXpresso IDE LinkServer Energy Measurement Guide - All information provided in this document is subject to legal disclaimers © 2021 NXP Semiconductors. All rights reserved.
User Guide Rev. 11.4.1 — 15 September, 2021 10NXP Semiconductors MCUXpresso IDE LinkServer Energy Measurement Guide
The last sources measure target supply voltage, current or power, respectively.
There can be only one data source selected at a time. Selecting a new data source will
automatically remove the previous selection and clears the collected data so far. Data collection
must be suspended in order to switch sources.
Note that the list of available data sources is displayed only while the view is connected to a
probe.
Sample rate
LPC-Link2
The ADC reading the current can sample at rates of between 50 and 100 thousand samples per
second (50ksps – 100ksps). The following sample rates can be selected (these are chosen to
provide a whole number of microseconds between readings):
• 50ksps (20us period)
• 62.5ksps (16us period)
• 100ksps (10us period)
MCU-Link
When MCU-Link is used, the user can configure a sample rate lower than the sample rates used
for LPC-Link2. The ADC reading the current can sample at rates of between 10 and 100 thousand
samples per second (10ksps – 100ksps). The following sample rates can be selected:
• 10kps (100us period)
• 25kps (40us period)
• 50ksps (20us period)
• 62.5ksps (16us period)
• 100ksps (10us period)
The sample rate can only be chosen from the existing dropdown list of values. It is recommended
to use lower sample rates to capture longer time periods.
Hardware configuration
Hardware configuration is required only when a LPC-Link2 probe is used. If the view is associated
with a MCU-Link probe this configuration section is not displayed.
Power probe circuit
The power measurement probe hardware comes in different configurations and can be
reconfigured by end users. The Energy Measurement View needs to be set up to match the
board that you are using.
There are various boards supporting measurement circuit:
• LPCXpresso546x8/540xx/54S0xx
• LPCXpresso54102
• LPCXpresso51U68/54114
• QN9090-DK006/JN5189-DK006/IOTZTB-DK006
• QN9080-DK
Choose your board from the available list. If you have a board that is not listed or does not match
the predefined resistor values, select one of the existing boards and select (edit) the correct
resistor values accordingly.
The hardware configuration is loaded from a xml file located in: ide/binaries/power/
measurementCircuits.xml. The user can save their own custom hardware configuration for later use
MCUXpresso IDE LinkServer Energy Measurement Guide - All information provided in this document is subject to legal disclaimers © 2021 NXP Semiconductors. All rights reserved.
User Guide Rev. 11.4.1 — 15 September, 2021 11NXP Semiconductors MCUXpresso IDE LinkServer Energy Measurement Guide
by modifying the xml file. After modifying the xml file, the Energy Measurement view must be
reopened in order to apply the changes.
Resistors
The values of the sense resistors across which the target and shield currents are measured can
be adjusted here. This setting allows the tool to be calibrated to adjust for the tolerance in those
resistor values.
• Target Resistor
Choose the resistance that matches the sense resistor on the LPCXpresso board that has the
target MCU on it. The standard options are provided in the dropdown list. If you have replaced
the sense resistor with a different one you can directly type it into the box.
• Shield Resistor
Choose the resistance that matches the sense resistor on the LPCXpresso shield board. The
standard options are provided in the dropdown list. If you have replaced the sense resistor with
a different one, you can directly type it into the box.
Note that all resistances must be entered in Ohms, in decimal format.
The Resume Data Display button will apply the configuration and capture a burst of samples.
Memory usage
A 60s capture at 100ksps collects 6 million samples. The longer the sample period,
the more memory is required. The amount of memory allocated to a Java application
is set when it starts. When you start a capture the view tries to preallocate the
required amount of memory. You can increase/decrease the amount of memory
allocated, using the guide in the Appendix [18] .
4.4.3 Power and energy consumption configuration
This section configures the target voltage used to calculate power and energy when measuring
a current data source. The value can be manually specified in Volts. For convenience, the target
voltage value can be precisely measured using the Read from target button. In this case the
tool measures the Target voltage source for 500ms and automatically fills in the average value.
If no value for target voltage is provided, power consumption and energy cannot be calculated.
Besides this parameter, the selected source must be a current source type (Target current or
Shield current).
The values for power and energy consumption are displayed in the Status line (see Status
line [15] section for more details).
Note: MCU-Link provides double channel measurement capability, so the power consumption
is calculated by measuring the target current and target voltage simultaneously. Therefore, the
power and energy consumption can be displayed by selecting a current source and the value for
target voltage in this configuration section or by using the power source directly.
4.5 Plot tab
The plot tab in the Energy Measurement view allows the user to visualize and analyze the
collected data samples. The user can interact with the graph using various functionalities
described in the next sections.
4.5.1 Toolbar associated with the graph
• Perform Auto scale button. Automatically scales the graph base on plotted values.
MCUXpresso IDE LinkServer Energy Measurement Guide - All information provided in this document is subject to legal disclaimers © 2021 NXP Semiconductors. All rights reserved.
User Guide Rev. 11.4.1 — 15 September, 2021 12NXP Semiconductors MCUXpresso IDE LinkServer Energy Measurement Guide
• Zoom in button. Zoom in on the time axis (horizontal zoom-in) by clicking into the area of
the graph where zoom is required. You can also use mouse wheel-up shortcut. To perform
vertical zoom use Alt + mouse wheel-up shortcut (Windows & Linux) or Option + mouse wheel-
up shortcut (Mac).
• Zoom out button. Zoom out on the time axis (horizontal zoom out) by clicking into the
area of the graph where zoom is required. You can also use mouse wheel-down shortcut. To
perform vertical zoom use Alt + mouse wheel-down shortcut (Windows & Linux) or Option +
mouse wheel-down shortcut (Mac).
• Horizontal zoom button. Performs horizontal zoom into a selected area. To use it, select
and drag within the graph.
• Vertical zoom button. Performs vertical zoom into a selected area. To use it, select and
drag within the graph.
• Panning button. Moves the graph across the x-axis and y-axis. To use it, click and
drag within the graph. You can also use Ctrl + mouse wheel-up/down (Windows & Linux) or
Command + mouse wheel-up/down (Mac) to pan the graph left or right.
• Cursor button. Disables any other toolbar item. Select it to prevent mouse actions
interacting with the display.
• Undo button. Moves one step back.
• Redo button. Moves one step forward.
• Show legend button. Displays the graph’s legend. For more details, see Legend [13]
section.
• Add annotation button. Adds an annotation to the graph. Annotations can be named and
will snap to a plotted point and display its value.
• Remove annotation button. Deletes the selected annotation from the plotted area.
• Horizontal Measurement button. Performs horizontal measurement for a selected area.
To use it, select and drag within the graph. Returns delta time, the values for power/energy
consumption and minimum, maximum, averages for the selected area. For more details, see
Status line [15] section.
• Save snapshot button. Saves the graph as a png file.
4.5.2 Graph
Axis format
The x-axis represents the time axis. Time is represented using a dynamic scale based on the
interval that needs to be displayed. The labels on the x-axis are relative to graph’s origin (t0).
T0 is visible on the status line.
The y-axis displays all the measured values. The measurement unit is based on the selected
source (i.e mA, V) and is displayed on the y-axis.
Legend
Shows the name of selected source. It is located under the graph and it has the same color as
the trace line.
Zooming
Data representation on the graph changes dynamically based on the current zoom level. At
the maximum zoom level individual samples are precisely represented as points on a line plot.
Zooming out, as more and more data points need to be represented, which would otherwise be
too close together to be distinguished, a set of samples are represented as an average value (in
dark color) along with min/max variation as error bars (in light color).
MCUXpresso IDE LinkServer Energy Measurement Guide - All information provided in this document is subject to legal disclaimers © 2021 NXP Semiconductors. All rights reserved.
User Guide Rev. 11.4.1 — 15 September, 2021 13NXP Semiconductors MCUXpresso IDE LinkServer Energy Measurement Guide
This enables both overviewing measured data in an efficient and intuitive representation based
on averages, and drilling down to a particular interval to reveal individual samples.
Zooming in example:
MCUXpresso IDE LinkServer Energy Measurement Guide - All information provided in this document is subject to legal disclaimers © 2021 NXP Semiconductors. All rights reserved.
User Guide Rev. 11.4.1 — 15 September, 2021 14NXP Semiconductors MCUXpresso IDE LinkServer Energy Measurement Guide
You can interact with the graph using the mouse by clicking and dragging on the graph, using
the mouse wheel or the zoom buttons (see Toolbar related to the graph [12] section).
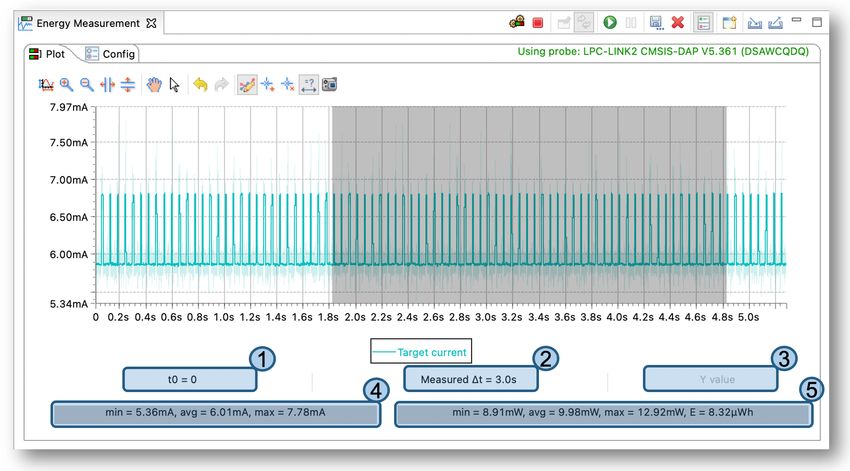
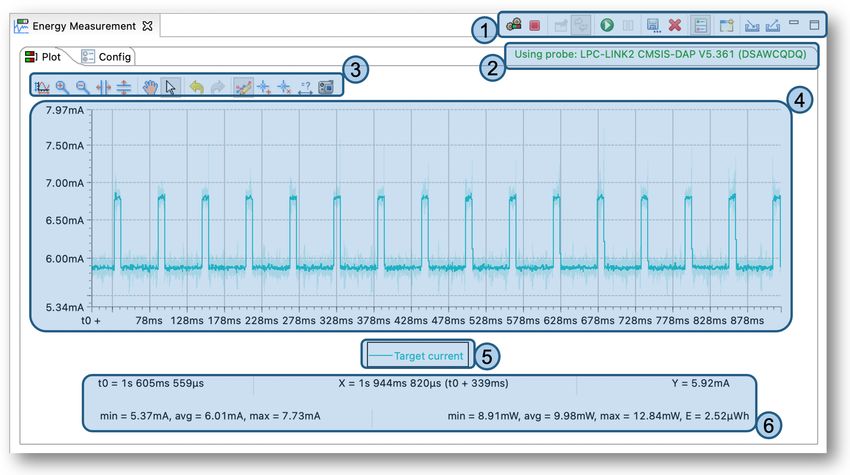
4.5.3 Status line
1. t0 label
Displays the time origin of the graph. Zooming and panning modifies the origin of the graph so
this value will be updated accordingly. Time axis values are relative to origin value.
2. Measured dt or X value label
By default, this label does not show any value. Placing the mouse cursor on the plotted area will
display the recorded time value closest to the mouse location. Using the horizontal measurement
tool to select a time interval on the graph will display the time delta.
3. Y value label
By default, this label does not show any value. Placing the mouse cursor on the plotted area will
display the measured value closest to the mouse location.
4. Summary values for plotted data label
This label displays the minimum, maximum and average values of the visible plotted area. Using
the horizontal measurement tool or zooming on the graph area will update the label with the new
values. Moreover, if new values are plotted, the label will update accordingly.
5. Summary values for power and energy label
This label shows values for the entire displayed graph or over the horizontal selected area when
the power and energy consumption data are available. If new values are plotted, the label will
update accordingly.
In case the power and energy setting is configured the label displays the minimum, maximum
and average values for power consumption and the energy consumption. This label shows only
the energy consumption in case the target power source is used to collect data.
Status line using mouse cursor:
Status line using horizontal measurement tool:
MCUXpresso IDE LinkServer Energy Measurement Guide - All information provided in this document is subject to legal disclaimers © 2021 NXP Semiconductors. All rights reserved.
User Guide Rev. 11.4.1 — 15 September, 2021 15NXP Semiconductors MCUXpresso IDE LinkServer Energy Measurement Guide
4.6 Export/Import data in raw format
The user is able to save the data collected within a view as a zip file using the Export data in
raw format button . The archive contains a binary file with all the recorded data and a csv
file with the configuration settings.
Energy Measurement view gives the possibility to load the saved data later, in the same view or
another one, by using the Import data in raw format button . Loading saved data in the view
is not requiring physical connection to the target.
MCUXpresso IDE LinkServer Energy Measurement Guide - All information provided in this document is subject to legal disclaimers © 2021 NXP Semiconductors. All rights reserved.
User Guide Rev. 11.4.1 — 15 September, 2021 16NXP Semiconductors MCUXpresso IDE LinkServer Energy Measurement Guide
5. Precision and Accuracy
LPC-Link2
The power measurement hardware uses an ADC with 12-bit precision. For the target’s current
this provides step sizes of 3.9uA, up to a maximum of 16mA. The sensor shield board has a
step size of 3.2uA and a maximum current of 13.2mV. The target’s Vdd has a step size of 806uV
and a maximum of 3.3V.
The maximum measurable current depends on the sense resistor Rs (Ohms) and the target’s
voltage VDD (V). It can be calculated as: I = (VDD - 0.1V) / (25 * Rs)
Higher currents cannot be measured and will be recorded as the maximum, resulting in
underestimation of the current usage. Change the sense resistor to a smaller resistance to
increase the maximum measurable current.
Table 5.1. Maximum measurable currents
Sense Resistor (Ohms) Vdd = 1.8V Vdd = 3.3V
4.12 16.5mA 30.1mA
8.2 8.29mA 15.6mA
10 6.8mA 12.8mA
The power numbers can be expected to be accurate to within 2%. The major sources of error are
the gain amplifier (MAX9634TEUK+T) used by the Target current and the Shield current, and
the tolerance of the sense resistors.
MCU-Link
The design that incorporates the current measurement circuit uses the LPC55S69 16-bit
ADC, with power data sampled at up to 100kS/s. MCU-Link has two maximum current range
measurement configurations, with the lower range providing better resolution at very low currents.
Within each configuration there are two, automatically controlled ranges in order to provide
and even further higher accuracy to be achieved. The automatic switching from low current
measurement to high current measurement is controlled solely by hardware in order to avoid
excessive voltage drop across the sense resistor. When switching from high current to low current
measurement the MCU-Link firmware controls the switch back to low current measurements
triggered by an interrupt from a monitoring circuit. The measurement circuit self-calibrates each
time the MCU-Link is powered on. No user intervention is required to setup the calibration or
adjust the measurement ranges. Transistors are used to isolate the sensing circuitry from the
target supply to avoid contention and ensure a known voltage is applied to the system during
calibration, so it is not necessary to disconnect and reconnect the probe.
Range configuration with corresponding accuracy and resolution are shown below. Accuracy
may vary with temperature and is provided for reference purposes only.
Table 5.2. Energy measurement range configuration (as at firmware revision 2.243)
Maximum measureable Measurement ranges Resolution Accuracy (Typical)
current
50mA 200nA to 400uA 200nA 1%
50mA >400uA to 50mA 5uA 1%
350mA 10uA to 1.5mA 1uA 1%
350mA >1.5mA to 350mA 20uA 5%
MCUXpresso IDE LinkServer Energy Measurement Guide - All information provided in this document is subject to legal disclaimers © 2021 NXP Semiconductors. All rights reserved.
User Guide Rev. 11.4.1 — 15 September, 2021 17NXP Semiconductors MCUXpresso IDE LinkServer Energy Measurement Guide
6. Appendix
6.1 Increasing Memory
The MCUXpresso IDE is a Java application. Low memory can result in gaps in your trace or
prevent you from being able to capture as much data as you need to.
This appendix shows how to increase the amount of Java memory available for each error type.
6.1.1 The INI File
When the IDE starts, it loads Java configuration information from the ini file: /ide/
mcuxpressoide.ini (on Mac, /ide/MCUXpressoIDE.app/Contents/MacOS/mcuxpressoide.ini)
This file contains the parameters that control how the application uses memory.
-vmargs
-Xms256m
-Xmx3072m
Description of the arguments:
• This defines the initial amount of heap space available to the Java runtime. This is
-Xms256m
dynamically allocated space and you should increase it if you have a large number of files or
projects in your workspace. The default is normally 256m; 256m would make it 256Mb.
• -Xmx3072m This defines the maximum amount of heap space available to Java. This value must
be greater than or equal to the value used in -Xms .
6.1.2 Not Enough Memory to Capture n Samples
If you see an out of memory error when attempting to start a data capture, try increasing the
maximum heap size in the ini file. For example, changing -Xmx3072m to -Xmx3328m would increase
the maximum heap size from 3072Mb to 3328Mb.
Restart the IDE for the changes to take effect.
6.1.3 Gaps in Trace
Increasing the initial heap space can help to reduce the number of gaps in the trace. Try setting
the -Xms parameter to be equal to the -Xmx value. The value for -Xmx must always be greater than
or equal to the value for -Xms.
Restart the IDE for the changes to take effect.
6.1.4 Keeping Track of Memory Usage
You may also wish to enable the workspace preference such that the Java heap status is
displayed in the IDE status bar (bottom right of window). To do this, select:
Window -> Preferences -> General -> Show heap status
A full discussion on the options available in the file can be found at http://wiki.eclipse.org/
Eclipse.ini
MCUXpresso IDE LinkServer Energy Measurement Guide - All information provided in this document is subject to legal disclaimers © 2021 NXP Semiconductors. All rights reserved.
User Guide Rev. 11.4.1 — 15 September, 2021 18NXP Semiconductors MCUXpresso IDE LinkServer Energy Measurement Guide
7. Legal information
Information in this document is provided solely to enable system and software implementers to
use NXP products. There are no express or implied copyright licenses granted hereunder to
design or fabricate any integrated circuits or integrated circuits based on the information in this
document.
NXP makes no warranty, representation, or guarantee regarding the suitability of its products
for any particular purpose, nor does NXP assume any liability arising out of the application or
use of any product or circuit, and specifically disclaims any and all liability, including without
limitation consequential or incidental damages. “Typical” parameters that may be provided in
NXP data sheets and/or specifications can and do vary in different applications, and actual
performance may vary over time. All operating parameters, including “Typicals”, must be
validated for each customer application by customer’s technical experts. NXP does not convey
any license under its patent rights nor the rights of others. NXP sells products pursuant to
standard terms and conditions of sale, which can be found at the following address: http://
www.nxp.com/SalesTermsandCondition.
While NXP has implemented advanced security features, all products may be subject to
unidentified vulnerabilities. Customers are responsible for the design and operation of their
applications and products to reduce the effect of these vulnerabilities on customer’s applications
and products, and NXP accepts no liability for any vulnerability that is discovered. Customers
should implement appropriate design and operating safeguards to minimize the risks associated
with their applications and products.
NXP, the NXP logo, Freescale, the Freescale logo, Kinetis and Tower are trademarks of NXP
B.V.
Arm, Cortex, Thumb, TrustZone, Mbed, Keil, Coresight are registered trademarks of Arm Limited
(or its subsidiaries) in the US and/or elsewhere. Microsoft, Azure ThreadX are trademarks of the
Microsoft group of companies. FreeRTOSTM and FreeRTOS.orgTM are trade marks of Amazon
Web Services, Inc. SEGGER Embedded Studio is a trademark of SEGGER Microcontroller
GmbH. J-Link is a trademark of SEGGER MICROCONTROLLER GMBH & CO. KG IAR
trademark is owned by IAR Systems AB. Java and all Java-based trademarks are trademarks
of Oracle Corporation in the United States, other countries, or both. Linux is the registered
trademark of Linus Torvalds in the U.S. and other countries. UNIX is a registered trademark
of The Open Group in the United States and other countries. Eclipse, CDT are trademarks of
Eclipse Foundation, Inc.
© NXP B.V. 2016-2021. All rights reserved.
How To Reach Us:
Home Page: http://www.nxp.com
Web Support: http://www.nxp.com/support
MCUXpresso IDE LinkServer Energy Measurement Guide - All information provided in this document is subject to legal disclaimers © 2021 NXP Semiconductors. All rights reserved.
User Guide Rev. 11.4.1 — 15 September, 2021 19You can also read