Miniature, minimally invasive, tunable endoscope for investigation of the middle ear
←
→
Page content transcription
If your browser does not render page correctly, please read the page content below
Miniature, minimally invasive, tunable
         endoscope for investigation of the middle ear
     Michal E. Pawlowski,1 Sebina Shrestha,2 Jesung Park,2 Brian E. Applegate,2 John S.
                            Oghalai,3 and Tomasz S. Tkaczyk1*
       1
         William Marsh Rice University, Department of Bioengineering, 6100 Main St, Houston, TX 77030, USA
     2
     Texas A&M University, Department of Biomedical Engineering, 5045 Emerging Technology Building, College
                                              Station, TX 77843, USA
3
  Stanford University, Department of Otolaryngology-Head and Neck Surgery, 801 Welch Road, Stanford, CA 94305,
                                                        USA
                                                 *
                                                  ttkaczyk@rice.edu

               Abstract: We demonstrate a miniature, tunable, minimally invasive
               endoscope for diagnosis of the auditory system. The probe is designed to
               sharply image anatomical details of the middle ear without the need for
               physically adjusting the position of the distal end of the endoscope. This is
               achieved through the addition of an electrowetted, tunable, electronically-
               controlled lens to the optical train. Morphological imaging is enabled by
               scanning light emanating from an optical coherence tomography system.
               System performance was demonstrated by imaging part of the ossicular
               chain and wall of the middle ear cavity of a normal mouse. During the
               experiment, we electronically moved the plane of best focus from the
               incudo-stapedial joint to the stapedial artery. Repositioning the object plane
               allowed us to image anatomical details of the middle ear beyond the depth
               of field of a static optical system. We also demonstrated for the first time to
               our best knowledge, that an optical system with an electrowetted, tunable
               lens may be successfully employed to measure sound-induced vibrations
               within the auditory system by measuring the vibratory amplitude of the
               tympanic membrane in a normal mouse in response to pure tone stimuli.
               ©2015 Optical Society of America
               OCIS codes: (110.4500) Optical coherence tomography; (170.0170) Medical optics and
               biotechnology; (220.0220) Optical design and fabrication; (120.7280) Vibration analysis;
               (170.4580) Optical diagnostics for medicine; (170.4940) Otolaryngology; (170.2150)
               Endoscopic imaging.

References and links
1.       R. J. Reoser, M. Valente, and H. Dosford-Dunn, Audiology Diagnosis (Thieme, 2000).
2.       S. A. Gelfand, Essentials of Audiology (Thieme Medical Publishers, Inc., 2009),.
3.       C. Pitris, K. T. Saunders, J. G. Fujimoto, and M. E. Brezinski, “High-resolution imaging of the middle ear with
         optical coherence tomography: a feasibility study,” Arch. Otolaryngol. Head Neck Surg. 127(6), 637–642
         (2001).
4.       Z. Hubler, N. D. Shemonski, R. L. Shelton, G. L. Monroy, R. M. Nolan, and S. A. Boppart, “Real-time
         automated thickness measurement of the in vivo human tympanic membrane using optical coherence
         tomography,” Quant. Imaging Med. Surg. 5(1), 69–77 (2015).
5.       C. T. Nguyen, W. Jung, J. Kim, E. J. Chaney, M. Novak, C. N. Stewart, and S. A. Boppart, “Noninvasive in vivo
         optical detection of biofilm in the human middle ear,” Proc. Natl. Acad. Sci. U.S.A. 109(24), 9529–9534 (2012).
6.       C. T. Nguyen, H. Tu, E. J. Chaney, C. N. Stewart, and S. A. Boppart, “Non-invasive optical interferometry for
         the assessment of biofilm growth in the middle ear,” Biomed. Opt. Express 1(4), 1104–1116 (2010).
7.       C. T. Nguyen, S. R. Robinson, W. Jung, M. A. Novak, S. A. Boppart, and J. B. Allen, “Investigation of bacterial
         biofilm in the human middle ear using optical coherence tomography and acoustic measurements,” Hear. Res.
         301, 193–200 (2013).
8.       B. J. Wong, J. F. de Boer, B. H. Park, Z. Chen, and J. S. Nelson, “Optical coherence tomography of the rat
         cochlea,” J. Biomed. Opt. 5(4), 367–370 (2000).
9.       J. Lin, H. Staecker, and M. S. Jafri, “Optical coherence tomography imaging of the inner ear: a feasibility study
         with implications for cochlear implantation,” Ann. Otol. Rhinol. Laryngol. 117(5), 341–346 (2008).

#234273 - $15.00 USD Received 9 Feb 2015; revised 21 May 2015; accepted 22 May 2015; published 27 May 2015
(C) 2015 OSA 1 Jun 2015 | Vol. 6, No. 6 | DOI:10.1364/BOE.6.002246 | BIOMEDICAL OPTICS EXPRESS 2246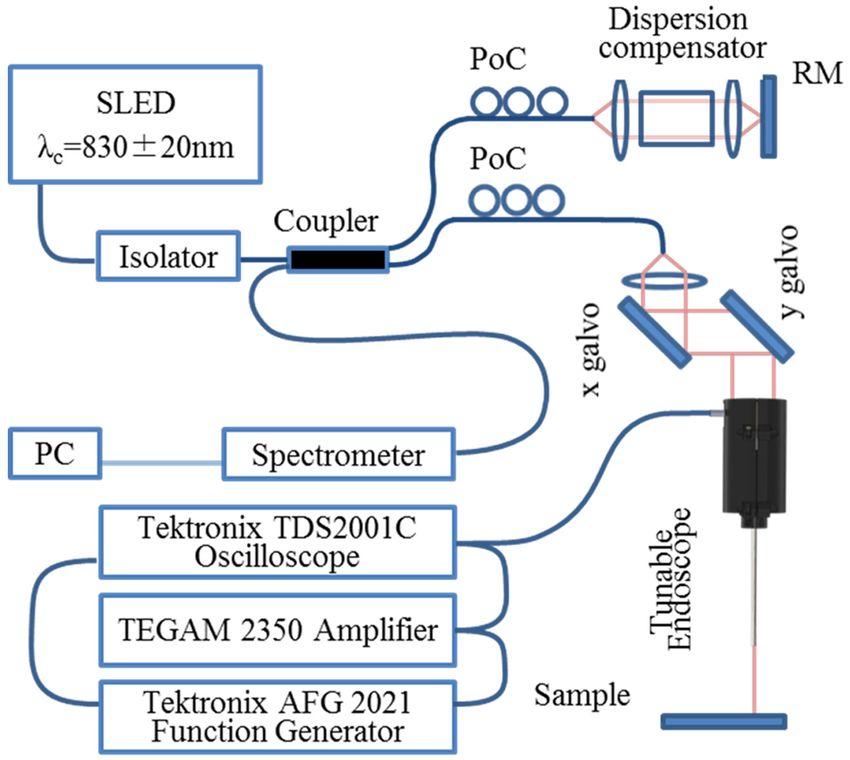
10. S. S. Gao, P. D. Raphael, R. Wang, J. Park, A. Xia, B. E. Applegate, and J. S. Oghalai, “In vivo vibrometry
    inside the apex of the mouse cochlea using spectral domain optical coherence tomography,” Biomed. Opt.
    Express 4(2), 230–240 (2013).
11. S. S. Gao, P. Raphael, A. Xia, J. Park, E. Carajal, B. E. Applegate, and J. S. Oghalai, “Methodology for
    assessment of structural vibrations by spectral domain optical coherence tomography,” Proc. SPIE 8207, 82072B
    (2012).
12. H. M. Subhash, A. Nguyen-Huynh, R. K. Wang, S. L. Jacques, N. Choudhury, and A. L. Nuttall, “Feasibility of
    spectral-domain phase-sensitive optical coherence tomography for middle ear vibrometry,” J. Biomed. Opt.
    17(6), 060505 (2012).
13. B. E. Applegate, R. L. Shelton, S. S. Gao, and J. S. Oghalai, “Imaging high-frequency periodic motion in the
    mouse ear with coherently interleaved optical coherence tomography,” Opt. Lett. 36(23), 4716–4718 (2011).
14. S. S. Gao, R. Wang, P. D. Raphael, Y. Moayedi, A. K. Groves, J. Zuo, B. E. Applegate, and J. S. Oghalai,
    “Vibration of the organ of Corti within the cochlear apex in mice,” J. Neurophysiol. 112(5), 1192–1204 (2014).
15. J. Park, E. F. Carbajal, X. Chen, J. S. Oghalai, and B. E. Applegate, “Phase-sensitive optical coherence
    tomography using an Vernier-tuned distributed Bragg reflector swept laser in the mouse middle ear,” Opt. Lett.
    39(21), 6233–6236 (2014).
16. S. S. Gao, A. Xia, T. Yuan, P. D. Raphael, R. L. Shelton, B. E. Applegate, and J. S. Oghalai, “Quantitative
    imaging of cochlear soft tissues in wild-type and hearing-impaired transgenic mice by spectral domain optical
    coherence tomography,” Opt. Express 19(16), 15415–15428 (2011).
17. L. Wu and H. Xie, “A millimeter-tunable-range microlens for endoscopic biomedical imaging applications,”
    IEEE JQ Elect. 46(9), 1237–1244 (2010).
18. K. Aljasem, A. Werber, A. Seifert, and H. Zappe, “Fiber optic tunable probe for endoscopic optical coherence
    tomography,” J. Opt. A, Pure Appl. Opt. 10(4), 044012 (2008).
19. N. Weber, H. Zappe, and A. Seifert, “Optical micro-system with highly flexible tunability for endoscopic micro-
    probes,” IEEE Proc. of International Conference on Optical MEMS and Nanophotonics, 51–52 (2011).
20. K. Aljasem, L. Froehly, A. Seifert, and H. Zappe, “Scanning and tunable micro-optics for endoscopic optical
    coherence tomography,” IEEE J.Micromechanical Systems 20(6), 1462–1472 (2011).
21. S. Murali, K. S. Lee, and J. P. Rolland, “Invariant resolution dynamic focus OCM based on liquid crystal lens,”
    Opt. Express 15(24), 15854–15862 (2007).
22. T. Xie, S. Guo, Z. Chen, D. Mukai, and M. Brenner, “GRIN lens rod based probe for endoscopic spectral domain
    optical coherence tomography with fast dynamic focus tracking,” Opt. Express 14(8), 3238–3246 (2006).
23. B. H. Hendriks, S. Kuiper, M. A. J. van As, C. A. Renders, and T. W. Tukker, “Electrowetting-based variable-
    focus lens for miniature systems,” Opt. Rev. 12(3), 255–259 (2005).
24. B. Berge and J. Peseux, “Variable focal lens controlled by an external voltage: An application of electrowetting,”
    Eur. Phys. J. E 3(2), 159–163 (2000).
25. J. Park, J. A. Jo, S. Shrestha, P. Pande, Q. Wan, and B. E. Applegate, “A dual-modality optical coherence
    tomography and fluorescence lifetime imaging microscopy system for simultaneous morphological and
    biochemical tissue characterization,” Biomed. Opt. Express 1(1), 186–200 (2010).
26. J. A. Jo, B. E. Applegate, J. Park, S. Shrestha, P. Pande, I. B. Gimenez-Conti, and J. L. Brandon, “In vivo
    simultaneous morphological and biochemical optical imaging of oral epithelial cancer,” IEEE Trans. Biomed.
    Eng. 57(10), 2596–2599 (2010).
27. H. Heffner and B. Masterton, “Hearing in glires: domestic rabbit, cotton rat, feral house mouse, and kangaroo
    rat,” J. Acoust. Soc. Am. 68(6), 1584 (1980).
28. H. E. Heffner and R. S. Heffner, “Hearing ranges of laboratory animals,” J. Am. Assoc. Lab. Anim. Sci. 46(1),
    20–22 (2007).
29. G. Ehret, “Development of absolute auditory thresholds in the house mouse (Mus musculus),” J. Am. Audiol.
    Soc. 1(5), 179–184 (1976).
30. Q. Y. Zheng, K. R. Johnson, and L. C. Erway, “Assessment of hearing in 80 inbred strains of mice by ABR
    threshold analyses,” Hear. Res. 130(1-2), 94–107 (1999).

1. Introduction
Diagnostic examination of the ear in patients complaining of hearing loss requires
morphological and functional examination of the auditory system. Non-contact, non-invasive
techniques are preferred for examination of the auditory system, as the structures that
compose it are small and fragile. Impairment of the auditory system may be sensorineural
(pathology within the inner ear or auditory nerve), conductive (pathology within the tympanic
membrane or middle ear), or mixed. Routine hearing tests provide information regarding the
type of the pathology but more specific information is often needed for clinical treatment
planning. A rudimentary assessment of the condition of the auditory system may be
performed using an otoscope. The normal eardrum is thin and transparent enough to allow a
straightforward optical examination of the tympanic membrane, middle ear space, and visible
parts of the ossicular chain. The immittance of the ear can be measured with tympanometry,
which tests for fluid or negative pressure within the middle ear cavity. The cochlea and
auditory nerve can be evaluated using electric potentials derived from the cochlea [1,2] with

#234273 - $15.00 USD Received 9 Feb 2015; revised 21 May 2015; accepted 22 May 2015; published 27 May 2015
(C) 2015 OSA 1 Jun 2015 | Vol. 6, No. 6 | DOI:10.1364/BOE.6.002246 | BIOMEDICAL OPTICS EXPRESS 2247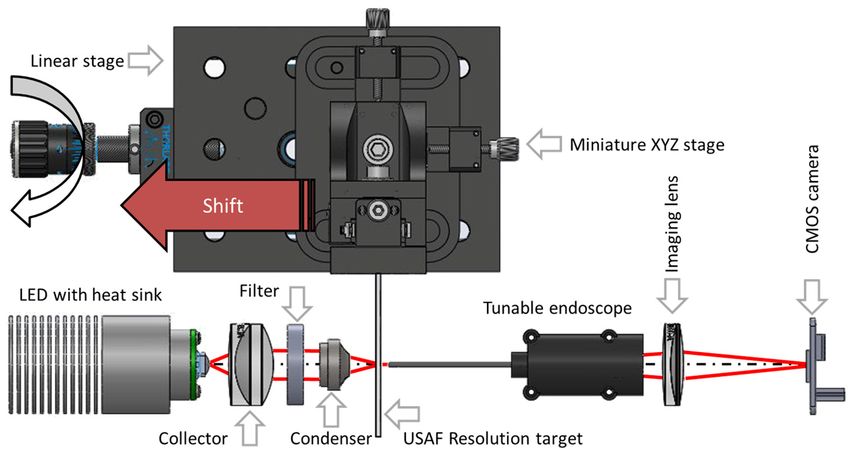
electrocochleography or auditory brainstem response. Cochlear function can be assessed with
otoacoustic emission measurements. Imaging studies, such as computed tomography and
magnetic resonance imaging can image the middle ear, ossicular chain, cochlea, and auditory
nerve non-invasively [1], but the resolution is often less than what is needed for clinical
diagnostic purposes. None of the techniques currently available for assessing the auditory
system permit the measurement of sound induced vibrations of the hearing apparatus. This
assessment would be helpful clinically, because in theory, one could follow the propagation
of sound through the auditory system until the point where sound no longer transmits
normally is identified. Thus, the site of the pathology could be accurately localized, and then
treated. Optical coherence tomography(OCT), a non-invasive, contactless optical
measurement technique, has been used for measurement and visualization of anatomical
structures of the middle ear [3]. Thickness of the human tympanic membrane was measured
in vivo in humans by Boppart et al. [4]. The same group applied OCT to detect thin layers of
biofilm in the human middle ear in order to diagnose early stages of middle-ear infections [5–
7]. The auditory system of the inner ear was imaged ex-vivo to show potential application in
diagnosis of inner ear pathology [8]. Internal structures of the inner ear were imaged using a
miniature catheter based OCT system to aid in otologic procedures [9].Optical coherence
tomography has been proposed recently to measure vibrational characteristics of the auditory
system [10–15]. OCT provides adequate spatial, temporal and axial resolution to measure
sub-nanometer displacements of middle and inner ear structures.
    The minimum optical resolution required for imaging the ossicles and cochlea is on the
order of single micrometers. This requirement, in conjunction with the illumination
wavelength, defines the minimal numerical aperture (NA) of the optical system and resultant
depth of field. Since the depth of field is inversely proportional to the square of the numerical
aperture, increasing the NA to improve resolution has the adverse effect of reducing the depth
of field. Thus, in order to resolve morphological details of the three-dimensional structure of
the auditory system, one has to develop a probe capable of safe navigation within the
confined space of the inner ear and capable of adjusting the position of the object plane in
order to sharply image fine details of the hearing apparatus. Optical coherence tomography, a
non-contact and non-invasive imaging modality, is well suited to this application. OCT has a
long history of implementation in morphological [3,16] and functional imaging [11–13] of the
middle and inner ear. While the majority of optical systems described in the OCT literature
make use of static optical components, recent advances in manufacturing have opened up new
possibilities in optical system design. Electrothermally actuated bimorphic lenses have been
implemented in an OCT system [17]. Hydraulically actuated micro-lenses were employed in
an OCT system by Seifert, primarily to improve depth resolution [18–20]. A liquid-crystal
tunable lens was used by Rolland [21] to design a resolution-invariant tunable optical system.
Incorporation of a miniature linear motor allowed Chen [22] to build a needle-like GRIN
endoscope capable of mechanical adjustment of the position of the object plane over a range
of 7.5 mm.
    In order to facilitate examination of the auditory system, we developed a miniature,
tunable endoscopic probe. We designed the distal end of the rigid endoscope to allow for safe
insertion into the tympanic chamber through a small incision in the tympanic membrane
(myringotomy). Small openings in the tympanic membrane heal spontaneously within a few
weeks, without adversely affecting the subject’s hearing. To achieve this goal we
encapsulated the distal end of the rigid endoscope into a hypodermic tube with an outer
diameter of 1.4 mm. Tunability, provided by incorporation of the electrowetted lens, allows
the operator to electronically move the object plane along the optical axis, providing imaging
capability beyond the depth of field of a static optical system. Since movement of the plane of
the best focus is facilitated by an electronically controlled change of curvature at the interface
between two immiscible liquids within the tunable lens [23,24], the distal end of optical
system can be held stationary at a safe distance away from the auditory apparatus. We
demonstrate that the miniature tunable endoscope is capable of sharp imaging of anatomical
features of parts of the ossicular chain, providing objective and quantitative morphological

#234273 - $15.00 USD Received 9 Feb 2015; revised 21 May 2015; accepted 22 May 2015; published 27 May 2015
(C) 2015 OSA 1 Jun 2015 | Vol. 6, No. 6 | DOI:10.1364/BOE.6.002246 | BIOMEDICAL OPTICS EXPRESS 2248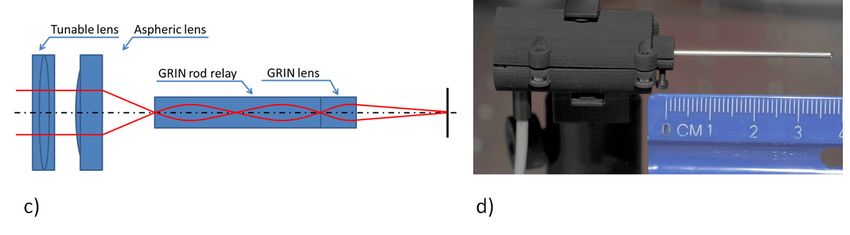
data. Additionally, we demonstrate using pure tone audiometry, for the first time to our best
knowledge, that an endoscope with a tunable, electrowetted optical component can be
successfully employed to measure the vibratory response of the middle ear transformer.
    Design of the miniature tunable endoscope together with details of its assembly procedure
is described in section 2. Imaging performance of the prototype of the endoscope is evaluated
in section 3. The optical coherence system employed in experiments is described in section 4.
Performance of the prototype of tunable endoscope in OCT system is evaluated in section 5.
Experimental results are presented in section 6. Conclusions and future direction of research
are given is section 7.
2. Miniature tunable endoscope
An isometric pseudo-3D schematic of the tunable endoscope is presented in Fig. 1(a). The
distal end of the endoscope consists of a GRIN lens (024-2270, OptoSigma,Santa Ana, CA)
glued to a GRIN rod relay lens (024-3490, OptoSigma, Santa Ana, CA) using UV curable
epoxy (NOA 61, Norland Products Inc., Cranbury, NJ). The GRIN optics are glued in place
inside a hypodermic tube (O.D. 1.4m, I.D. 1 mm, Amazon Supply, Seattle, WA) using NOA
61 adhesive. The distal portion of the optical system is mounted in a custom designed 3D
printed enclosure using an Allen set screw. The system chassis is manufactured on a ProJet
3000 3D printer (3D Systems Inc., Rock Hill, SC) using acrylic resin (VisiJet EX200, 3D
Systems Inc., Rock Hill, SC). All plastic components of endoscope are painted black with
matte enamel (Humbrol #33, Hornby, UK) to reduce stray reflections. The plastic 3D printed
enclosure has internal recesses (visible in Fig. 2(a) and 2(b)) designed to accommodate an
aspheric objective lens (5726-H-C, Newport, Irvine, CA) together with the tunable
electrowetted lens (Arctic 416, Varioptic, France). Components of the tunable endoscope
before assembly are depicted in Fig. 1(b). An optical schematic of the tunable endoscope is
presented in Fig. 1(c). Figure 1(d) shows the assembled prototype of the tunable endoscope
with a linear gauge for scaling purposes.
    In the presented system the aspheric microscope objective replacement is focused on the
proximal end of the endoscope and together with the preceding (from operator perspective)
tunable objective make up the front end of the tunable endoscope. In order to reduce system
length and minimize depth dependent change of magnification, the tunable lens is located
near the aperture stop of the aspheric lens. The original Varioptic lens casing is used to
deliver an AC square wave driving signal (1 kHz, variable amplitude) to the electrowetted
tunable lens.

          Fig. 1. Tunable miniature endoscope: isometric projection of a three-dimensional CAD model
          (a), components of the endoscope photographed before assembly (b), optical schematic of the
          tunable endoscope (c), photograph of the prototype with ruler in the foreground for scaling
          purposes (c).

#234273 - $15.00 USD Received 9 Feb 2015; revised 21 May 2015; accepted 22 May 2015; published 27 May 2015
(C) 2015 OSA 1 Jun 2015 | Vol. 6, No. 6 | DOI:10.1364/BOE.6.002246 | BIOMEDICAL OPTICS EXPRESS 2249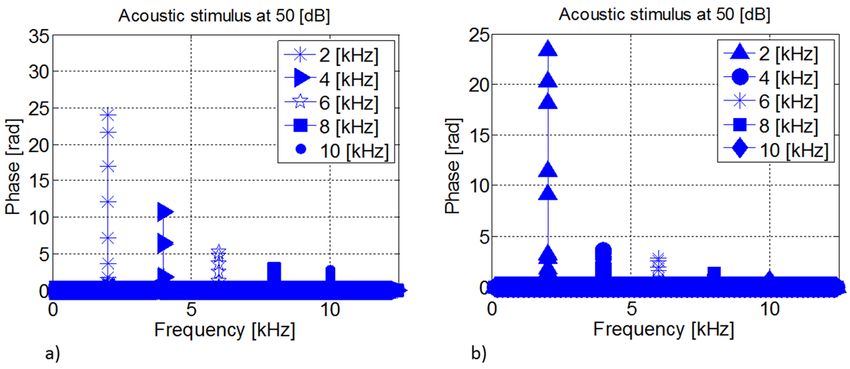
The tunable optical system is controlled by low voltage (0-5V amplitude), variable duty
cycle signal generated by a digital function generator (AFG 2021, Tektronix, Beaverton,
Oregon). The electrowetted lens has linear optical power vs driving voltage characteristic for
steering signal in range of ~32-46VRMS. We condition low-voltage signal from the function
generator using a 50x high voltage precision amplifier (2350, Tegram, Cleveland, Ohio)
before feeding it to the electrowetted lens. A digital oscilloscope (AFG 2012, Tektronix,
Beaverton, Oregon) is used to monitor base signal from function generator together with
amplified lens driving voltage.
    The focal length of the Arctic 416 liquid lens is adjustable over the range fmin = −97 mm
to fmax = 33 mm and is electronically controlled by the amplitude and the duty cycle of the
square wave driving signal. The distal hypodermic assembly is positioned in such a way that
the optical system comprised of the electrowetted and aspheric lenses is focused on the
proximal end of the GRIN rod relay when the liquid lens forms a plane parallel plate (zero
optical power). In this configuration, the endoscopic system creates a real image at positive
powers of the tunable lens and the position of the object plane can be moved from contact
with the distal end of GRIN lens to a location approximately 8 mm away from it.
3. Miniature tunable endoscope – performance evaluation
We tested performance of the assembled prototype of the miniature tunable endoscope in the
set-up depicted in Fig. 2. In our tests we targeted lateral resolution of the endoscope as a
function of working distance/lens driving voltage. While the working condition for our
objective in the OCT system would be different (e.g.: impinging beam diameter, double
instead of single pass of light through the objective) we wanted to test the prototype of the
miniature endoscope assembly before integration with the optical coherence tomography
system. GRIN components that constitute distal optics integrated within hypodermic tube (see
Fig. 1(a)), by design, need to be mounted axially with their adjacent surfaces in optical
contact. Unwanted small off-axis misalignment between those components will have
detrimental effect on the quality of the propagating wavefront. Our rigid GRIN system has
two nominal intermediate image planes: one located between GRIN elements and the second
located at the proximal end of the rod relay. Unwanted dust particles present on any of the
intermediate image planes together with uneven distribution of mounting media between
GRIN pair will affect image clarity, because all imperfections and inclusions will be sharply
imaged together with the object.

          Fig. 2. Pseudo 3D opto-mechanical schematic of a system used to test optical performance of
          the miniature tunable endoscope.

#234273 - $15.00 USD Received 9 Feb 2015; revised 21 May 2015; accepted 22 May 2015; published 27 May 2015
(C) 2015 OSA 1 Jun 2015 | Vol. 6, No. 6 | DOI:10.1364/BOE.6.002246 | BIOMEDICAL OPTICS EXPRESS 2250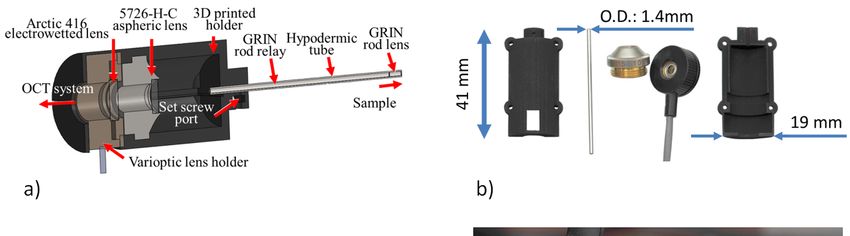
We used a positive 2”x2” 1951 USAF Resolution Target (58-198, Edmund Optics, NJ) to
assess image quality of the prototype of the miniature tunable lens. A white light emitting
diode (MCWHL2, Thorlabs, NJ) served as light source.

          Fig. 3. Images of 1951 USAF resolution target acquired using experimental system
          schematically depicted in Fig. 2. From the top left, images are recoded at: 0 mm (a), 0.3 mm b)
          0.8 mm (c) and 2.3 mm (d) endoscope working distance, measured between distal end of the
          GRIN lens and front, chromium coated, surface of the 1951 USAF resolution target. During
          experiment images were recorded at arbitrary selected resolution of 1944x2592 (height to
          width ratio of 0.76) and their brightness was adjusted for visualization purposes.

    Achromatic condenser (AC254-035-A, Thorlabs, NJ) together with miniature aspheric
objective lens replacement (5726-A, Newport, Irvine, CA) and red bandpass filter (FB-650-
10, Thorlabs, NJ) comprised the optical train of the illumination system. A miniature XYZ
stage (MS3, Thorlabs, NJ) allowed us to fine adjust the lateral position of the 1951 USAF
resolution target and a single axis translation stage (PT1, Thorlabs, NJ) allowed us to change
its axial position within ~25 mm travel range. Axial movement of the 1951 USAF target was
monitored by a two channel electronic gauge (ND 720, Heidenhain, Germany) with a single
sensor measuring position of the PT1 single axis translation stage. The observation system
was built around a CMOS camera (DMM-72BUC02-ML, The Imaging Source, Germany)
connected to the computer using USB 2.0 interface. An achromatic doublet (AC254-100-A,
Thorlabs, NJ) was placed behind the tunable endoscope and formed an image of the object on
the camera sensor. During the test, the USAF resolution target was placed at increasing
distances from the distal end of the tunable endoscope. At each position of the target, the
liquid lens driving voltage was adjusted to maximize image contrast. During experiments the
distance between the camera and the proximal end of the prototype of the miniature
endoscope was fixed. Four images of the USAF resolution target recorded at working
distances of: 0 mm, 0.3 mm, 0.8 mm and 2.3 mm are presented in Fig. 3. Resolution of the
system in contact with USAF resolution target was 645 lp/mm. We clearly resolved resolution
bars of Group 9 element 3, see Fig. 3(a). The lateral resolution of our system dropped with
increase of working distance (W.D.), and we measured it to be 333 lp/mm for W.D. of 0.3
mm (Fig. 3(b)), 166 lp/mm for 0.8 mm W.D. (Fig. 3(c)) and 83 lp/mm for W.D. of 2.3 mm
(Fig. 3(d)). Field of view of the system increased with working distance and we measured it
to be 180 µm, 403 µm, 716 µm and 2355 µm for working distance of 0 mm, 0.3 mm, 0.8 mm
and 2.3 mm respectively. Images of the USAF target at all working distances suffered from
vignetting.

#234273 - $15.00 USD Received 9 Feb 2015; revised 21 May 2015; accepted 22 May 2015; published 27 May 2015
(C) 2015 OSA 1 Jun 2015 | Vol. 6, No. 6 | DOI:10.1364/BOE.6.002246 | BIOMEDICAL OPTICS EXPRESS 2251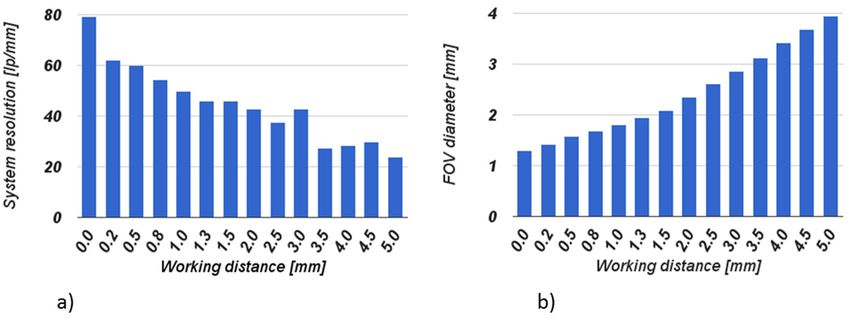
Fig. 4. Schematic diagram of the experimental setup. SLED – super luminescent diode, PoC –
          polarization controller, PC – laptop PC, RM – reference mirror.

    Distortion was clearly visible at the edges of the field of view for working distances
exceeding 0.3 mm. We attribute vignetting and distortion to intrinsic characteristic of the
GRIN optics used to assemble the tunable endoscope. Variation of FOV as a function of
working distance is attributed to opto-mechanical limitations of the assembly. In order to
balance system complexity we placed the liquid lens not exactly at the system’s aperture stop.
In order to minimize system diameter we decided to design our system to be non-telecentric
in the object space and thus the field of view depended on working distance. Additionally, the
design space available to us at the initial stage of the project was limited to basic optical
properties of the GRIN components, as distributors of both components do not provide optical
models for these. Qualitatively, images of the USAF target were free of quality degrading
artifacts like images of dust particles, digs and scratches. We checked for presence of these
pollutants as they degrade image quality. Our probe is especially susceptible to off-axis
alignment precision and surface irregularities, because of three intermediate image surfaces
that are collocated with front/back surfaces of optical components. We plan to use the
miniature endoscope to observe structures located in middle ear cavity, with FOV limited to
hundreds of micrometers and millimeter-like electronic focusing range. For those conditions
the performance of our objective in terms of resolution is on the level of single micrometers,
confirming satisfactory quality of the assembly and proper selection of optical components
and satisfactory mechanical dimensional stability of the 3D printed enclosure.
4. Experimental system
A schematic of the experimental system is shown in Fig. 4. In order to test the prototype of
the tunable endoscope we modified the OCT system described in our previous publications
[25,26]. The tunable needle like endoscope was mounted directly beneath a galvanometer
scanner of a fiber-based Fourier domain OCT system, built around a superluminescent LED
(Exalos, EXS8410-2413), operating at central wavelength of 830 nm with 40 nm bandwidth.

#234273 - $15.00 USD Received 9 Feb 2015; revised 21 May 2015; accepted 22 May 2015; published 27 May 2015
(C) 2015 OSA 1 Jun 2015 | Vol. 6, No. 6 | DOI:10.1364/BOE.6.002246 | BIOMEDICAL OPTICS EXPRESS 2252
A custom built spectrometer that comprised of a transmissive grating (1200 L/mm, Wasatch
Photonics) and line-scan camera (Aviiva, SM2CL1014, EV2 Technologies, Essex, England),
with line rate of 59 kHz was used for signal detection. A custom diamond turned poly(methyl
methacrylate) (PMMA) rod (47 mm long, 9 mm in diameter) was placed in reference arm of
the interferometer together with a pair of prisms (43-648, Edmund Optics, NJ) to compensate
dispersion introduced by the optical components of the tunable endoscope. Lateral scanning
was provided by a one of two sets of galvanometer mirrors: 6220H (8 mm aperture,
Cambridge Technology, Bedford, MA) and QS-7(7 mm aperture, Nutfield Technology,
Hudson, NH). Scanning mirrors amplifiers were driven by digital I/O card controlled by
custom LabView program (National Instruments, Austin, TX). Software level
synchronization of spectrometer with galvo-scanner allowed coordinated acquisition of
spectral interferograms.
5. Performance characterization of the miniature tunable endoscope in OCT system
Performance of the miniature tunable endoscope, like any other optical system, depends on
working conditions. The main factors influencing optical performance are: wavelength,
working distance, and the shape of the wavefront impinging optical system. In order to
characterize the basic optical parameters of the miniature tunable endoscope in OCT settings,
we experimentally measured resolution at the optical axis together with the field of view of
the tunable system as a function of working distance.
A CMOS board level camera (UI-1490LE-C-HQ, Imaging Development System,
Obersulm, Germany) was mounted on single axis translation stage (PT1, Thorlabs, NJ),
perpendicular to the optical axis of the endoscope. We positioned camera and translation
stage in a way that allowed us to control the endoscope working distance. Position of the
translation stage was monitored by digital gauge (ND 720, Heidenhain, Germany) and video
signal from image detector was recorded by PC class computer through USB interface.
During the experiment we moved image detector in parallel to the mechanical axis of the
endoscope. A series of images at arbitrarily selected working distances were recorded,
spanning range from 0 mm to location where distal tip of the GRIN lens was 5 mm away
from CMOS sensor. Focus of the prototype of the tunable miniature needle like endoscope
was manually adjusted, using signal generator controls, before resolution and the diameter of
the field of view were measured. Resolution of the system was measured in location that
coincided with mechanical axis of the system and the field of view was measured with one
galvo-scanner turned on and driven by time varying signal similar to signal used during
experiments.
Fig. 5. Performance of the tunable needle like endoscope system in OCT set-up in function of
probe working distance: resolution in lp/mm (a) and diameter of the field of view in mm (b).
A plot of the system resolution as a function of working distance is presented in Fig. 5(a).
We measured the resolution of the system by monitoring the Full Width Half Maximum
(FWHM) of the beam focused on the UI-1490LE-C-HQ camera detector. This allowed us to
#234273 - $15.00 USD Received 9 Feb 2015; revised 21 May 2015; accepted 22 May 2015; published 27 May 2015
(C) 2015 OSA 1 Jun 2015 | Vol. 6, No. 6 | DOI:10.1364/BOE.6.002246 | BIOMEDICAL OPTICS EXPRESS 2253directly measure both resolution and the FOV in one experimental session. Resolution was measured on the mechanical axis of the endoscope with galvanometric mirrors turned off. We sequentially turned x and y mirrors on in order to measure horizontal and vertical extent of the field of view. Presented diameters of the field of view are converted to disk diameter average values of lateral extent of the field of view. In the presented experimental system maximum measureable spatial frequency was limited by camera pixel size (1.67 μm) to ~300 lp/mm, a value significantly better than the measured resolution of the tunable endoscope. Similarly lateral extent of the FOV was limited by detector pixel count to 6.4 mm in the horizontal and 4.6 mm in the vertical direction. The bar chart of the diameter of the field of view as a function of working distance is presented in Fig. 5(b). The lateral resolution of the tunable endoscope in the presented system is a function of the working distance, due to design tradeoffs between design simplicity, outer diameter of distal end of optical system and availability of optical documentation of GRIN components. System resolution in contact position with 1951 USAF Resolution Test Chart was measured to be 80 lp/mm and it slowly decreased to 22 lp/mm when the working distance was increased to 5 mm. An aberrant small increase of resolution observed around distance of 3 mm is most probably due to experimental error and not due to properties of the optical system. Measured field of view of our system increased with working distance due to the non-telecentric design of the optical system, and was 1.2 mm in diameter in contact with object and increased to nearly 4 mm in diameter for 5 mm working distance. We measured that the combined OCT imaging system had 10 μm axial resolution and 86.3 dB signal-to-noise ratio (SNR). We attribute the low SNR ratio to non-optimal coatings of optical components. Liquid lenses available from Varioptic are offered only with antireflective coatings optimized for 450-700 nm range (visible spectrum) and GRIN lenses from OptoSigma are not offered with any kind of band specific coatings. Attenuation of transmitted light by AR coating of the liquid lens and the Fresnel reflections on all four surfaces of rod lenses contribute to significant signal loss in the object arm of our interferometer. In order to confirm our supposition we measured the optical power of the object beam before and after the tunable endoscope using a PM100A(Thorlabs, NJ) universal power meter. We used Exalos SLED for these experiments. The optical power at the proximal end of the endoscope was measured to be 1.42 mW and the power at the distal end was measured to be 0.78 mW. The transmission ratio calculated based on the above experiment was 55%. Taking into account Fresnel equations and for simplicity assuming that all lenses are made of BK7, for an uncoated system we would expect transmission on the order of 75%. We believe the higher-than-expected attenuation was primarily due to non- optimal transmission of anti-reflective (AR) coatings of the tunable lens, which were designed to work in the visible part of the electromagnetic spectrum and are used in our experiment in the near infrared. 6. Experimental results Pure tone stimuli are typically used during audiological testing. A human with normal hearing can hear sounds within the frequency range of 20 Hz to 20 kHz, although hearing tests are typically only performed within the frequency range of 250-8000 Hz at sound pressure levels (SPL) typically between 6.5 dB SPL (normal hearing) and 97 dB SPL (profound hearing loss). The threshold sensitivity of normal human ear is a non-linear function of frequency that typically reaches its minima in frequency range between 500 Hz and 8 kHz, a bandwidth that covers most of the human speech power spectrum. The mouse ear is sensitive in frequency range of 2 kHz to 79 kHz [27–29] with hearing threshold [28,30] reaching minimum in the frequency range of 8 kHz-16 kHz. Because the human hearing spectrum overlaps the mouse hearing spectrum in frequency range of 2 kHz-16 kHz, we validated performance of our system on mouse tissue in frequency range of 2 kHz to 10 kHz. #234273 - $15.00 USD Received 9 Feb 2015; revised 21 May 2015; accepted 22 May 2015; published 27 May 2015 (C) 2015 OSA 1 Jun 2015 | Vol. 6, No. 6 | DOI:10.1364/BOE.6.002246 | BIOMEDICAL OPTICS EXPRESS 2254
Fig. 6. Phase of the OCT signal in function of frequency of the audio stimulus at 50 SPL, latex
          membrane (a) and ear drum of the normal mouse (b).

     For the purpose of vibrometric experiments, we modified the system presented in Fig. 4,
by adding a calibrated M31 microphone (LinearX Systems Inc., Battle Ground, WA) and
miniature headphone speaker (Auvio Pearl Buds, Ignition L.P., Dallas, TX). The microphone
and the speaker were placed ~20 mm above the sample and about 10-15 mm away from the
miniature endoscope with their long axis tilted at ~30 deg angle in reference to the
mechanical axis of the endoscope. Before experiments the scanning galvanometric mirrors of
the OCT set-up were stopped and a sample was positioned directly below the distal end of the
tunable endoscope. In order to avoid mechanical jitter due to scanning mirrors closed-loop
control mechanism, we powered the galvanometric mirrors off. During each vibrometric
measurement ten thousand M-scans were acquired. Amplitude of vibrations was computed
off-line in Matlab (The MathWorks Inc., MA) custom written software and was based on
Fourier domain analysis. We initially tested the performance of our experimental system on a
latex glove spanned over half of a Petri dish. We measured the vibrational response of the
latex membrane at five frequencies (2 kHz, 4 kHz, 6 kHz, 8 kHz and 10 kHz) at 50 SPL.
Amplitude of vibration of the latex membrane, filtered with narrow-band Gaussian filter with
47 Hz FWHM, as a function of frequency is presented in Fig. 6(a). The signal to noise ratio
for this experiment was 47 dB, 49 dB, 40 dB, 37 dB and 36 dB for 2 kHz, 4 kHz, 8 kHz and
10 kHz stimulus respectively. The successful measurement of vibrational response of a thin
membrane confirmed, that our system is capable of measurement of sound-induced
vibrations.
     In the next set of experiments, we measured sound-induced vibrations of the tympanic
membrane of a normal post-mortem mouse, using animal protocols approved by Rice
University and the Texas Heart Institute. The tympanic membrane of the normal mouse was
positioned about 2 mm from the distal end of the tunable endoscope. Response of the
tympanic membrane was measured in its center, where we expected largest amplitude of
sound induced vibration. Acoustic stimulus during experiment was kept on constant level of
50 SPL and we used five discrete frequencies of 2 kHz, 4 kHz, 6 kHz, 8 kHz and 10 kHz to
induce vibrations of the tympanic membrane. The plot of measured amplitude of vibrations of
the tympanic membrane as a function of induced acoustic oscillations is presented in Fig.
6(b). The signal to noise ratio of measured deflections of tympanic membrane was 31 dB, 22
dB, 23 dB, 20 dB and 12 dB for 3 kHz, 4 kHz, 6 kHz, 8 kHz and 10 kHz frequency of the
sonic stimulus respectively. For visualization purposes, the signal presented in Fig. 6(b), was
filtered with a Gaussian narrowband filter (47 Hz, FWHM). Observed amplitude of vibrations
of the tympanic membrane in our experiments decreased with increase of the frequency of the
acoustic stimulus. The largest amplitude of vibrations was observed, when pure tone signal at
2 kHz was applied to the speaker. The lowest amplitude of vibrations was observed for 10
kHz stimulus. While care was taken to perform measurements of the tympanic membrane as

#234273 - $15.00 USD Received 9 Feb 2015; revised 21 May 2015; accepted 22 May 2015; published 27 May 2015
(C) 2015 OSA 1 Jun 2015 | Vol. 6, No. 6 | DOI:10.1364/BOE.6.002246 | BIOMEDICAL OPTICS EXPRESS 2255
fast as possible, the experimental procedure lasted about 3 hours, including tissue harvesting.
The sharp decrease of the amplitude of vibration of the tympanic membrane as a function of
frequency may be attributed in part to dehydration of the tympanic membrane, unavoidable
post mortem for experiments performed in the air in laboratory with air-conditioned
atmosphere.
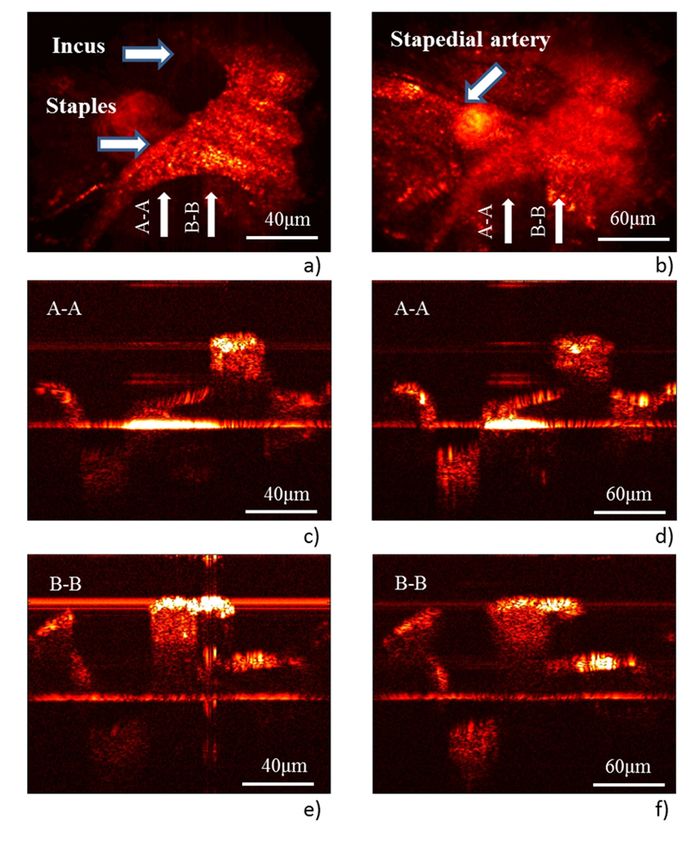
Fig. 7. 2D isometric projection of OCT volumetric data onto xy plane with plane of the best
focus at the incudo-stapedial joint (a) and at the stapedial artery (b). (c) and (d) B-scans
through direction A-A from subplots (a) and (b) respectively. (e) and (f) B-scans through
direction B-B from subplots (a) and (b) respectively. Please note that position of miniature
tunable endoscope was fixed during this experiment.
To demonstrate the ability of the tunable endoscope to image beyond the depth of field of
a static optical system, we also imaged the middle ear of a normal post-mortem mouse. In
order to access the middle ear ossicles, we removed the outer ear of a euthanized mouse
together with part of the lateral wall of the tympanic chamber and part of the tympanic
membrane. We positioned the mouse ear below the proximal end of the tunable endoscope,
and electronically focused the endoscopic system on the top of incudostapedial joint. Next,
we took series of six hundred B-scans (each B-scan consisted of six hundred A-scans) to
image morphological details of the incus and stapes. The resultant 2D isometric OCT volume
projection onto the xy plane is presented in Fig. 7(a) together with two arbitrary B-scans, Fig.
7(c) and 7(e). In the next step, we electronically moved the endoscope object plane towards
the medial wall of the tympanic chamber and repeated the volumetric scanning operation. The
#234273 - $15.00 USD Received 9 Feb 2015; revised 21 May 2015; accepted 22 May 2015; published 27 May 2015
(C) 2015 OSA 1 Jun 2015 | Vol. 6, No. 6 | DOI:10.1364/BOE.6.002246 | BIOMEDICAL OPTICS EXPRESS 2256resultant 2D isometric projection of the OCT volume onto the xy plane is presented in Fig. 7(b). Figure 7(d) and 7(f) depict B-scans taken at locations that match to B-Scans from Fig. 7(c) and 7(e). While the object plane was initially on the top of the long-crus joint, the morphological details of incus and stapes (anterior and posterior crus, neck and head) together with its surface texture are clearly resolvable on 2D isometric projection as well as on B- scans, Fig. 7(a), 7(c) and 7(d). The incudostapedial artery, located below the synovial joint, was not visible on those images. As the plane of the best focus was electronically moved toward the medial wall of the tympanic chamber, the stapedial artery became clearly visible on both volumetric and sectional views in Fig. 7(b), 7(d) and 7(f). At the same time the synovial joint was no longer in focus, with fine details of its texture no longer resolvable. The position of the plane of best focus in this experiment was controlled electronically. The miniature tunable endoscope was mounted in a holder attached to the optical table and its position was fixed during experiments described above. Please note that cross-section images presented in Fig. 7 were manually post-processed in order to remove fixed horizontal artifacts, originating from unwanted reflections between optical components of the optical system. All data presented in Fig. 7 were colored using a modified “hot” color map available in Matlab (The MathWorks Inc., MA) with all displayed values scaled logarithmically. The data clearly demonstrate the advantage of the tunable endoscope. The ability to electronically control the position of the object plane allows the operator to change focus between spatially separated features, without the need to alter the physical position of the optical system. This feature is of obvious interest for all who strive to image fragile tissues like the middle and inner ear. 7. Summary We have presented a minimally invasive, tunable endoscope designed to aid diagnosis of morphological and functional structures of the middle ear. The small diameter of the endoscope enables safe insertion into the outer ear and safe navigation inside the middle ear chamber. The ability to electronically adjust the position of the object plane allows for sharp visualization of anatomical features of interest beyond the depth of field of a static optical system, without the need to physically change the location of the probe. In the current embodiment of the system, location of image conjugates was controlled manually by the operator. We trusted the judgment of the experimenter to arbitrarily move the plane of best focus. Since the position of the plane of best focus is controlled electronically, we may in the future enhance system capabilities by adding software based auto-focus routines. The software based auto-focusing algorithm may automatically move image conjugates in order to acquire sharp images of all anatomical structures visible within the field of view. The selection of position of the plane of best focus may be based on a distance map obtained using the OCT system or may be based on local contrast of anatomical features of interest. We demonstrated that a miniature tunable endoscope with liquid electrowetted lens is capable of measurement of miniscule sound induced vibrations of the tympanic membrane. We presented experimental data from pure tone tests that show capabilities of our system to monitor mechanical properties of hearing apparatus that may be in the future used to diagnose in vivo clinical patients. In the future we are planning on continuing development of the tunable miniature endoscope with focus on improvement of SNR ratio of OCT signal. Acknowledgments The authors gratefully acknowledge Dr. Brian Walton from Texas Heart Institute for sharing mouse tissues. We would like to acknowledge Prof. Richards-Kortum and Jennifer Burnett from Rice University for sharing mouse tissue used in vibrometric experiments. This project was supported by the National Institutes of Health (NIH, R21 EB015022, R21 EB016832 and R01HL111361) and by a Department of Defense research grant (DoD, W81XWH-11-2- 0004). The authors are very thankful to Richard Schwarz from Rice University for valuable discussions and help in preparation of this manuscript. #234273 - $15.00 USD Received 9 Feb 2015; revised 21 May 2015; accepted 22 May 2015; published 27 May 2015 (C) 2015 OSA 1 Jun 2015 | Vol. 6, No. 6 | DOI:10.1364/BOE.6.002246 | BIOMEDICAL OPTICS EXPRESS 2257
You can also read