Multiple roles of bamboo as a regulator of cyanobacterial bloom in aquatic systems
←
→
Page content transcription
If your browser does not render page correctly, please read the page content below
www.nature.com/scientificreports
OPEN Multiple roles of bamboo
as a regulator of cyanobacterial
bloom in aquatic systems
Aimin Hao1,2, Mengyao Su1, Sohei Kobayashi1,2*, Min Zhao1,2 & Yasushi Iseri1,2*
To understand the potential roles of terrestrial bamboo on controlling cyanobacterial blooms in
aquatic systems, growth rates of the cyanobacterium Microcystis aeruginosa and its competitor algae
were examined under different concentrations of bamboo extract. In mono-species cultures with
unicellular algal strains, 5.0 g L−1 extract treatment suppressed M. aeruginosa growth, while it had
little effect on the growth of green alga Scenedesmus obliquus or promoted the growth of diatom
Nitzschia palea. In co-species cultures, the extract treatment increased the effect of S. obliquus and N.
palea on the growth of M. aeruginosa. Under the extract treatment with a field-collected M. aeruginosa
population, its cell density declined and its colony was etiolated and sank, while co-cultured N. palea
increased explosively by invading the colony. These results suggest that bamboo forest stands along
banks and artificially installed bamboo poles can affect the aquatic environment for phytoplankton
community. Enhancing the growth of competitors, especially diatoms that can invade cyanobacterial
colonies, by using extracts or by providing substrates for growth, was suggested to be the major way
of the bloom control by bamboo.
Cyanobacterial blooms in aquatic systems, as a consequence of eutrophication caused by human activities, are a
major environmental issue worldwide1–3. Cyanobacteria produce toxins that are hazardous to both ecosystems
and human s ociety4–6 and the bloom can eliminate key plants and aerobic animals in the ecosystems by cover-
ing the water surface and depletion of o xygen7–10. Efforts have been made to reduce nutrient loads from the
watershed, and various physical, chemical, and biological control countermeasures have been tested to mitigate
cyanobacterial blooms in aquatic s ystems3,11.
Terrestrial plants have roles of modulating the productivity and species composition of adjacent aquatic eco-
systems through multiple pathways. Bankside trees limit light availability and algal production while providing
leaves for allochthonous p roduction12–14, and submerged large woody materials often provide essential habitats
for various organisms in aquatic ecosystems15,16. Dissolved organic matter (DOM) from terrestrial plants (i.e.,
leachates and exudates from plant materials), is considered to act as either nutrients17,18 or inhibitors for algal
growth. Allelopathy of plants has attracted attention for controlling cyanobacterial blooms owing to their selec-
tive toxicity and natural d egradability19,20. Allelopathic effects on cyanobacteria species have been reported for
various terrestrial plants21,22 as well as aquatic plants23.
Bamboo (sub-family Bambusoideae in the family Poaceae) is a widespread and often major forest stand type,
especially in Asian countries24,25. Bamboo has been planted and utilized since ancient times, and is currently
used as food, medicine, and fuel, and as a strong and flexible material for construction and furniture. Bamboo
stands are favored for the prevention of soil erosion and for maintaining soil moisture because of its rhizome-
root system and the accumulation of litter on the soil s urface25,26. However, due to rapid growth and reproduc-
tion, abandoned bamboo stands have expanded and invaded adjacent forests in recent decades25,27,28, which has
become a global concern of ecosystem degradation as bamboo invasion can reduce local plant diversity and its
relevant ecosystem f unction29,30.
Bamboo can act as either inhibitor or stimulator of growth, depending on others. Bamboo releases alle-
lochemicals that inhibit the growth of other plants in p roximity31,32. In addition, the antimicrobial activity of
bamboo is well k nown33, and leaves and stems have traditionally been used to maintain the freshness of food and
water in Asian countries. On the other hand, the nutritional value of bamboo shoots is well k nown34. Bamboo
culms contain endophytic lactic acid bacteria and have been used as livestock f odder35, and moreover, bamboo
1
College of Life and Environmental Sciences, Wenzhou University, Chashan Academic Town, Ouhai,
Wenzhou 325035, Zhejiang, China. 2National and Local Joint Engineering Research Center of Ecological Treatment
Technology for Urban Water Pollution, Wenzhou University, Wenzhou 325035, China. *email: koba@wzu.edu.cn;
iseri@wzu.edu.cn
Scientific Reports | (2022) 12:1605 | https://doi.org/10.1038/s41598-022-05506-2 1
Vol.:(0123456789)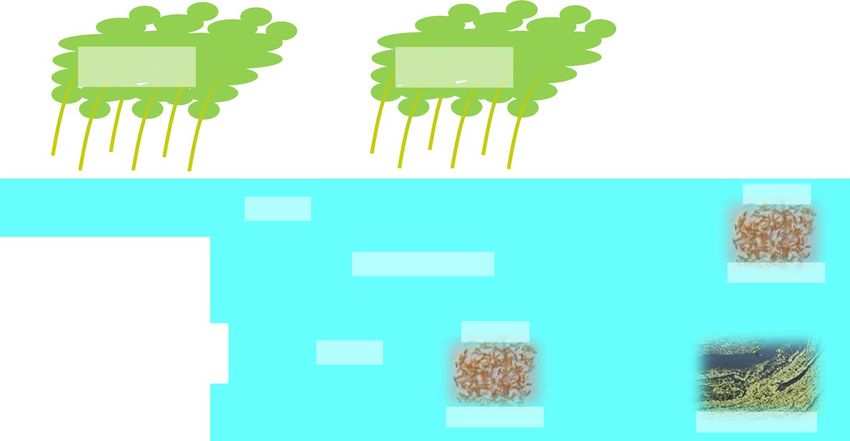
www.nature.com/scientificreports/
is the food of giant p anda36. A high litter yield in bamboo forests supports the soil microbial community, and
microbial diversity sometimes increases after bamboo invasion to other forest t ypes37–39. In contrast, the effects
of bamboo on biological communities in aquatic systems are not well understood. A few studies have examined
the microbial utilization of bamboo litter in s treams40,41. Despite the limited understanding, bamboo poles and
shrubs have traditionally been used for seaweed production and as artificial fish r eefs42, and they have recently
been shown to be suitable substrates in periphyton-based aquaculture systems, which enhance fish production
in ponds through periphyton and associated m icrofauna43–45. Notably, bamboo contains high concentrations of
silica46, which is an essential nutrient for algae, especially diatoms, and bamboo stands accumulate and export
downstream a high quantity of silica generated by rock weathering47,48.
Stimulating the growth of green algae and diatoms, which are the major competitors of cyanobacteria, may
be a key to control cyanobacterial blooms. Certain green algae species grow efficiently and can outcompete
cyanobacteria in the absence of elevated CO2, temperature, and herbicides49,50. Recently, diatom species have
been reported to invade and attack cyanobacterial c olonies51,52, which are a barrier system and vital for bloom
formation53,54. Recent studies have also investigated the allelopathic effects of periphyton (dominated by green
algae and diatoms) on the growth of cyanobacteria55,56. Despite such potential beneficial effects of green algae
and diatoms on cyanobacteria, few studies have focused on how to stimulate the growth of these competitors to
control cyanobacterial blooms.
To understand the potential ability of bamboo to control cyanobacterial blooms, this study examined the
effects of bamboo extract on the growth of the widespread cyanobacterium Microcystis aeruginosa and its major
competitors, green alga Scenedesmus obliquus, and diatom Nitzschia palea. The growth of the three algal spe-
cies was examined by using bamboo extracts of different concentrations in mono- and co-species cultures. We
hypothesized that the extract suppresses the growth of M. aeruginosa, while it promotes or has no effect on the
growth of S. obliquus and N. palea, and that the effect of the competitors on M. aeruginosa increased with the
extract. Although a standard strain of unicellular M. aeruginosa was used for the basic experiments, colony-
forming M. aeruginosa collected from a field lake was also used to understand how algal responses to the extract
vary with the barrier system of cyanobacteria.
Results
Algal growth in mono‑species culture. The three algal species were incubated in cultures with different
bamboo extract concentrations (bamboo: Semiarundinaria densiflora) under a constant temperature and light
cycle condition for 16 days, and the growth was monitored by counting algal cells every 2 days (Fig. 1a). For each
culture, the growth curve was fitted with a logistic function, and growth parameters (μ: specific growth rate, r:
intrinsic growth rate, and K: carrying capacity) were determined (Fig. 1b). In some cases, the logistic curve could
not accurately follow the actual growth, and K may be underestimated (e.g., M. aeruginosa in some treatments,
Fig. 1a).
The three algal species responded differently to the bamboo extract treatments. The growth of M. aeruginosa,
in terms of μ, r, and K, differed little between the control and extract treatments up to 1 g L −1, whereas it was
significantly lower in the 5 g L treatment than in the control (t = − 54.7, p < 0.001) (Fig. 1b). The cell density at
−1
the end of the experiment in the 5 g L−1 treatment was one-eighteenth of that in the control. The μ of S. obliquus
differed little between the control and each extract treatment, whereas r tended to increase (by 23.6% from the
control to 5 g L−1) and K tended to decrease (by 25.7% from the control to 5 g L−1) with extract concentration.
This reflects an increase in initial growth while a decrease in final cell density with extract concentration. In
contrast, μ and K of N. palea differed little between the control and extract treatments up to 1 g L −1 concentra-
tion, while they were significantly higher in the 5 g L treatment than in the control (t: 10.33 and 22.38, p < 0.001
−1
and < 0.001, respectively). The cell density in the 5 g L−1 treatment initially increased relatively slowly, but it was
almost double that of the control at the end (Fig. 1a).
The pH of culture, lipid peroxidation (malondialdehyde: MDA), and activities of enzymes (superoxide dis-
mutase: SOD, peroxidase: POD, catalase: CAT) were measured as physiological status of M. aeruginosa in the
control and three extract treatments (1.0, 2.5, 5.0 g L−1). The pH increased with time, and it was consistently
higher in the control than in the extract treatments and higher in the 1 g L−1 treatment than in the 2.5 and 5.0 g
L−1 treatments after day 4 (Fig. 2a). The MDA content and enzyme activities (SOD, POD, and CAT) decreased
from day 4 to 8 in the extract treatments (Fig. 2b–e). On each day, they were highest in the 2.5 g L−1, followed
by the 1.0 g L−1 and the control, and they were lowest in the 5.0 g L−1.
Algal growth in co‑species culture. M. aeruginosa and either S. obliquus or N. palea were co-cultured in
the control and extract treatments (1.0, 2.5, 5.0 g L−1) under the same condition with the mono-culture system,
and the growth was monitored for each species (Fig. 3a, b).
In the M. aeruginosa and S. obliquus co-culture system (Figs. 3a and 4a), μ of M. aeruginosa was significantly
lower in the 5 g L−1 treatment than in the control (t = − 22.75, p < 0.001). The values of r and K were not obtained
at 5 g L−1 due to a non-sigmoidal change in cell density. The μ and r in the 2.5 g L−1 treatment were also signifi-
cantly lower than those in the control (t: − 3.53 and − 4.91, p = 0.019, and 0.005, respectively). Growth was lower
in the co-culture system compared to the mono-culture system (Figs. 3a and 4a); the percentage decrease in μ
from mono- to co-culture was greater for the 5 g L−1 (− 37%) than for the control (− 20%).
In the same co-culture system, μ and K of S. obliquus were significantly greater in the 1.0 g L−1, (t: 4.31 and
3.30, p: 0.006 and 0.027, respectively) and 2.5 g L−1 (t: 5.40 and 4.16, p: 0.002 and 0.008) than in the control
(Fig. 4a). The values of μ and K decreased while r increased from the mono- to co-culture system. The percentage
decreases in μ and K from mono- to co-culture were small for the 5 g L −1 (− 17% and − 57%, respectively) than
the control (− 23% and − 69%).
Scientific Reports | (2022) 12:1605 | https://doi.org/10.1038/s41598-022-05506-2 2
Vol:.(1234567890)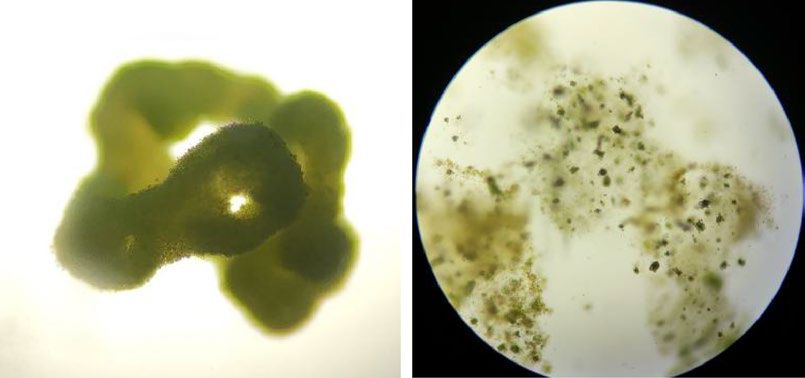
www.nature.com/scientificreports/
a Treatment Control b Microcystis aeruginosa
(extract concentration) 0.1 g L−1 Scenedesmus obliquus
1.0 g L−1
Nitzschia palea
5.0 g L−1
16 Microcystis aeruginosa Specific growth rate (µ)
14
0.3
12
10 ***
µ (d−1)
8 0.2
6 ***
4 0.1
2
0 0.0
0 2 4 6 8 10 12 14 16 0.001 0.01 0.1 0.5 1.0 5.0
14
Scenedesmus obliquus Intrinsic growth rate (r)
Cell density (106 cells mL−1)
12 0.8 ** **
*
10
0.6
8
r (d−1)
6 0.4
4 **
0.2
2
0 0.0
0 2 4 6 8 10 12 14 16 0.001 0.01 0.1 0.5 1.0 5.0
4
Nitzschia palea 16 Carrying capacity (K)
14
3
K (106 cells ml−1)
12
* **
10 ***
2 8
6
1 4 ***
2 ***
0 0
0 2 4 6 8 10 12 14 16 0.001 0.01 0.1 0.5 1.0 5.0
Time (day) Treatment (extract concentration: g L−1)
Figure 1. Growth pattern (a) and growth parameters (b) of each algal species in different treatments in the
mono-culture system (the control and selected three treatments are shown in a). Each growth curve was fitted
with a logistic model. Error bars are SD (n = 3). Asterisks denote a significant difference between the control and
extract treatments (Dunnett’s test, *: p < 0.05, **: p < 0.01, ***: p < 0.001).
In the M. aeruginosa and N. palea co-culture system (Figs. 3b and 4b), μ of M. aeruginosa was significantly and
substantially lower in the 5 g L−1 treatment than in the control (t = − 42.24, p < 0.001). The μ was also significantly
lower in the 2.5 g L−1 treatment than in the control (t = − 3.83, p = 0.012). Values of r and K were not obtained in
−1. Growth was lower in the co-culture system compared to the mono-culture system (Figs. 3b
the 2.5 and 5 g L
and 4b); the percentage decrease in μ from mono- to co-culture was greater in the 5 g L−1 treatment (− 61%)
than in the control (− 5%).
In the same co-culture system, μ and K of N. palea were significantly higher in the 2.5 g L −1 (t: 4.11 and 4.53, p:
0.008 and 0.005, respectively) and 5.0 g L −1 (t: 9.63 and 12.21, p: < 0.001 for both) treatments than in the control,
and r was significantly higher in the 1.0 g L
−1 (t = 3.37, p = 0.024) and 5.0 g L
−1 (t = 3.97, p = 0.010) treatments than
in the control (Fig. 4b). The percentage decrease in μ and r from mono- to co-culture was smaller in the 5 g L −1
(− 44% and − 9%, respectively) than in the control (− 51% and − 44%).
Growth in co‑species culture with colony‑forming M. aeruginosa. Field collected colony-forming
M. aeruginosa and N. palea were co-cultured in the control and 5 g L−1 extract treatment (Fig. 5a); differences in
growth between the control and treatment were more conspicuous as compared to the co-culture with singular
cells (Fig. 3b). In the control, M. aeruginosa increased more than threefold during the 7-day experiment (μ: 0.17
d−1), whereas N. palea decreased to less than one-fourth (Fig. 5a). In contrast, in the 5.0 g L −1 treatment, M.
aeruginosa decreased to less than one-seventh during the experiment, whereas N. palea increased to more than
Scientific Reports | (2022) 12:1605 | https://doi.org/10.1038/s41598-022-05506-2 3
Vol.:(0123456789)www.nature.com/scientificreports/
b c
MDA contents (nmol 104 cells−1)
SOD activity (U 104 cells−1)
3
0.2
Control
Treatment 1.0 g L-1 2
(extract concentration) 2.5 g L-1
5.0 g L-1 0.1
1
11
a 0
Day 4 Day 8
0
Day 4 Day 8
10
CAT activity (nmol min−1 104 cells−1)
5
d e
9
POD activity (U 104 cells−1)
1.2
pH
8 4
7 3 0.8
6 2
0 2 4 6 8 10 12 14 16
0.4
Time (day) 1
0 0
Day 4 Day 8 Day 4 Day 8
Time (day)
Figure 2. Changes in pH (a), malondialdehyde (MDA) content (b), superoxide dismutase (SOD) activity (c),
peroxidase (POD) activity (d), and catalase (CAT) activity (e) in Microcystis aeruginosa mono-species culture.
Error bars are SD (n = 3).
105-fold during the experiment (μ: 1.73 d
−1). Such an explosive increase was not observed in any species or treat-
ments in mono-culture nor in co-culture systems with single cells.
Differences between the control and treatment in the state of M. aeruginosa colonies were also evident
(Fig. 5b). Although the colony size increased in both the control and the 5 g L−1 treatments (Fig. 5c), most colo-
−1 treatment were degraded and fragmented at the end of the experiment. In addition, initially
nies in the 5 g L
intact and floating colonies all sank to the bottom with etiolation in the 5 g L−1 treatment by day 7 (Fig. 5d,
e). Colonies were at the bottom since day 4 in one of the 5 g L −1 triplicates (Fig. 5d), in which N. palea started
increasing from day 4 (a large variation among triplicates is shown in Fig. 5a).
Discussion
This study demonstrated the effects of bamboo extract on the growth of three algal species based on batch culture
experiments. Both mono- and co-culture experiments suggest that the extract can suppress the growth of the
cyanobacterium M. aeruginosa, while it can promote the growth of the competitive diatom N. palea. Multiple
pathways of the effect of bamboo on cyanobacteria are possible, including direct and indirect effects of the extract.
Few studies have shown such opposing effects of extracts between cyanobacteria and other algal species; thus,
these observations might be specific to bamboo and related plants. The remarkable effect of bamboo extract
on colony-forming cyanobacteria suggests that bamboo may perform advantageously in field ponds and lakes
where colony-forming cyanobacteria occur, as allelopathic effects of other plants are usually tested for singular
cells without protecting systems, which rarely occur in the stages of proliferation.
We revealed that the growth of M. aeruginosa can be largely inhibited by bamboo extract at a concentration
of 5 g L−1. Although the effect on growth was less clear in 1.0 and 2.5 g L−1 treatments, physiological changes
induced by these treatments were suggested by the culture pH and stress indicators. An increase in pH to > 10
in cultures is normal for M. aeruginosa, which is adapted to higher pH and the availability of C ater59.
O2 in w
Lower pH in the extract treatments than in the control suggests a decline in algal photosynthetic activity by the
extract. The stress indicators MDA content and activities of antioxidant enzymes (SOD, POD, and CAT) behaved
in a concentration-dependent manner, except for the 5.0 g L−1 treatment. The minimum levels of these indica-
−1 treatment could suggest a malfunction of cells rather than a reduced stress in the treatment.
tors in the 5.0 g L
−1 and lower concentrations had little or no effect on the growth of M. aeruginosa.
In this study, extracts of 1 g L
Although previous studies using other plants often showed effects of extracts with concentrations of 1–10 g L −1
or higher [e.g.,58,60], effects with much lower concentrations have also been reported (e.g., 0.2 g L−1 of leaves of
Eucalyptus trees61; 0.05 g L −1 of decomposed barley s traw62). Thus, the algistatic level of bamboo extract in this
study was not specifically high among reported effective plants.
No apparent decrease in the growth of S. obliquus and N. palea, even in the 5 g L −1 treatment, suggests that the
bamboo extract can selectively inhibit the growth of cyanobacteria. Selective inhibitory effects of plant extracts
on cyanobacteria have been demonstrated in other s tudies63,64, which could be attributed to the lack of a defense
system in cyanobacteria against allelochemicals such as those developed in green algae and diatoms. Our results
Scientific Reports | (2022) 12:1605 | https://doi.org/10.1038/s41598-022-05506-2 4
Vol:.(1234567890)www.nature.com/scientificreports/
Treatment
(extract concentration)
Control 1.0 g L−1 2.5 g L−1 5.0 g L−1
Co-culture
Mono-culture
a b
16 16
M. aeruginosa M. aeruginosa
14 14
12 12
10 10
8 8
6 6
Cell density (106 cells mL-1)
4 4
2 2
0 0
0 2 4 6 8 10 12 14 16 0 2 4 6 8 10 12 14 16
14 4
S. obliquus N. palea
12
10 3
8
2
6
4 1
2
0 0
0 2 4 6 8 10 12 14 16 0 2 4 6 8 10 12 14 16
Time (day)
Figure 3. Growth pattern of algal species in different treatments in co-culture systems (a: Microcystis
aeruginosa and Scenedesmus obliquus, b: M. aeruginosa and Nitzschia palea). Growth curves were fitted with
logistic models except for some cases of M. aeruginosa. Error bars are SD (n = 3). Growth curves of each species
in the mono-culture (Fig. 2) are shown for comparison.
rather showed a promotive effect of bamboo extract on the growth of N. palea in the 5 g L−1 treatment. Few
studies have shown such opposing effects between cyanobacteria and other algal species simultaneously. Eladel
et al.65 reported that extract of rice straw inhibited the growth of cyanobacteria (Anabaena), while stimulating
the growth of green algae (Chlorella). According to their review, extracts from barley and rice straws often inhibit
the growth of cyanobacteria, including Microcystis, while stimulating the growth of green algae and diatoms as
a result of high nutrient (NO3 and PO4) release65. It is interesting that both straw plants and bamboo belong to
the family Poaceae and have many common properties, including high silica c ontent46.
It appears that, in the co-culture systems without bamboo extract, M. aeruginosa and S. obliquus affected each
other with less competitive advantage, whereas M. aeruginosa was competitively superior to N. palea. Growth
parameters of each species were lower in the co-culture system than in the mono-culture system, except for the
r of S. obliquus. It is known that S. obliquus can outcompete M. aeruginosa in cultures without herbicides or with
low to moderate pH and temperature c onditions49,66. The diatom N. palea has been shown to be a poor competitor
for nutrients among various algal species67.
The percent change in growth parameters from the mono-culture to co-culture suggests that the relationship
between M. aeruginosa and its competitor was modified by the bamboo extract. A greater percentage decrease in
the μ of M. aeruginosa in the 5.0 g L −1 treatment than in the control implies that negative impacts from competi-
tors increased in the presence of the extract. Impaired growth of M. aeruginosa in co-culture was also observed
as a non-sigmoidal increase (e.g., decrease, slow exponential increase) of cells in the 2.5 and 5.0 g L−1 treatments.
In contrast, a smaller percentage decrease in μ of S. obliquus and N. palea for the 5.0 g L −1 treatment compared to
the control implies that the negative impact by M. aeruginosa was reduced by the extract. The numerical superi-
ority between M. aeruginosa and N. palea in the control was completely reversed in the 5.0 g L−1 treatment. The
greater effects of N. palea on M. aeruginosa in the 5.0 g L −1 treatment compared to those of S. obliquus may be
attributed to its periphytic nature, as discussed in more detail in the following paragraph.
The ability of bamboo extract to control M. aeruginosa by promoting the growth of competitors was enhanced
in the colony-forming M. aeruginosa. In co-culture with colony-forming M. aeruginosa, M. aeruginosa increased
and N. palea decreased in the control, whereas in the 5 g L −1 treatment, M. aeruginosa decreased by less than
one-seventh and N. palea increased more than 10 -fold. It appears that the colony triggered a rapid death of
5
M. aeruginosa, rapid growth of N. palea, or both in the bamboo extract. A unique feature of N. palea is its
adhesion to, and gliding movement on, the substrate, which enables them to invade and consume the colony
Scientific Reports | (2022) 12:1605 | https://doi.org/10.1038/s41598-022-05506-2 5
Vol.:(0123456789)www.nature.com/scientificreports/
a M. aeruginosa S. obliquus b M. aeruginosa N. palea
Co-culture Co-culture
Mono-culture Mono-culture
Specific growth rate (µ) Specific growth rate (µ)
0.3 0.3
*
** ** –5% –5%
*
–17%
µ (d−1)
0.2 –20% –20% 0.2
–23% –16%
***
**
0.1 *** 0.1 –36%
***
–37% –51% –52%
–61%
0.0 0.0
Control 1.0 2.5 5.0 Control 1.0 2.5 5.0
1.0 Intrinsic growth rate (r) 1.0 Intrinsic growth rate (r)
16%
37% 8%
0.8 0.8
0.6 0.6 –6%
r (d−1)
–17%
–20%
0.4 –26% ** 0.4
* *
–35% –9%
0.2 0.2 –44%
0.0 0.0
Control 1.0 2.5 5.0 Control 1.0 2.5 5.0
16 Carrying capacity (K) 16 Carrying capacity (K)
14 14
K (106 cells ml−1)
12 12
10 10
8 8 –25% –16%
6 ** 6
*
4 4
–65% –65% –57%
2 2 ***
–69% –52% ** –72%
0 –73% –75%
0
Control 1.0 2.5 5.0 Control 1.0 2.5 5.0
Treatment (extract concentration g L−1)
Figure 4. Growth parameters (μ, r, K) calculated for each species in different treatments in co-culture systems
(a: Microcystis aeruginosa and Scenedesmus obliquus, b: M. aeruginosa and Nitzschia palea). Error bars are SD
(n = 3). Asterisks denote a significant difference between the control and extract treatments for each species
(Dunnett’s test, *: p < 0.05, **: p < 0.01, ***: p < 0.001). Growth parameters of each species in the mono-culture and
percentage decrease from mono- to co-culture systems for each parameter are also shown. Values of r and K
were not obtained for M. aeruginosa in some cases.
of M. aeruginosa51,52. We observed that the colonies of M. aeruginosa, which were initially intact and floating,
became partially fragmented, etiolated, and sank (settled to the bottom) in the extract treatment. The invasion
of M. aeruginosa by N. palea was possibly accelerated by the settlement of the colony. However, the process that
induced the loss of floating ability of the colonies, whether they were degraded by the extract or by the invasion
of N. palea, is unknown.
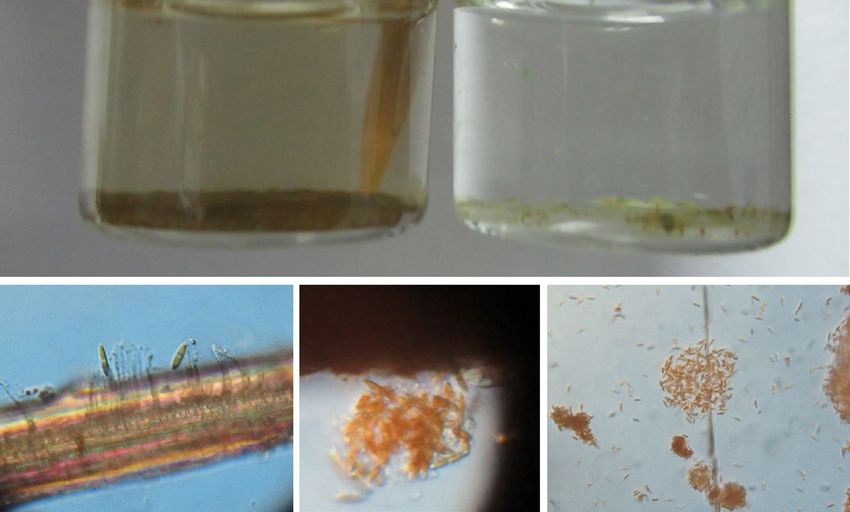
Our supplemental observations show the importance of bamboo as a substrate for the growth of N. palea
(Fig. 6). The colony-forming M. aeruginosa with N. palea taken from Lake Taihu was inoculated equally into
six vials (8 mL) with BG-11 medium, and a commercial toothpick made of bamboo was placed in two of the six
vials. Incubation conditions were the same as those in the main experiments. There was no visible change in the
color of the cultures for several weeks, but the color in vials with toothpicks changed to yellowish after 7–8 weeks
(Fig. 6a). Microscopic observations at day 60 revealed that in the vials with toothpicks all M. aeruginosa had sunk
and N. palea had increased substantially (Fig. 6b). In addition, a large number of N. palea formed flocks and
adhered to the surface of the toothpicks (Fig. 6c–e). The yellowish color was primarily N. palea that adhered to
the vial walls. The lack of coloring of the culture together with a lack of decrease in total number (float + sink) of
M. aeruginosa suggest that the leachate from the toothpicks was limited. This implies that the toothpick contrib-
uted as a growing substrate for N. palea and subsequently as a source of invaders for the colony of M. aeruginosa.
Scientific Reports | (2022) 12:1605 | https://doi.org/10.1038/s41598-022-05506-2 6
Vol:.(1234567890)www.nature.com/scientificreports/
a 6 c
Colony area (mm2)
M. aeruginosa N. palea Control
Control 5.0 g L−1
5.0 g L−1 4
106
Cell density (106 cells mL−1)
105 2
104 0
0 1 2 3 4 5 6 7
103 Time (day)
102 d
3 Float
10
2
1
Sample frequency
1 Sink
0 1 2 3 4 5 6 7
Time (day)
0
b e
3 Green
2
1 Etiolate
0
Cont. 5 g L−1 Cont. 5 g L−1 Cont. 5 g L−1
Intact colony Degraded colony
Day 0 Day 4 Day 7
(control, day 7) (5 g L−1, day 7)
Time and treatment
Figure 5. Growth patterns of Microcystis aeruginosa and Nitzschia palea (a) and changes in colony of M.
aeruginosa (b), including size (c), float/sink status (d), and color state (e), in the control and 5 g L
−1 treatment in
co-culture with colony-forming M. aeruginosa. Error bars are SD (n = 3).
a b M. aeruginosa
Proportion of sunk cells
N. palea
+ Bamboo toothpick Control Cell density (cells mL−1) 107 1.0
0.8
106
Proportion
0.6
105
c d e 0.4
104
0.2
103 0.0
Figure 6. Algal responses to bamboo toothpick in culture (a: experiment culture, b: cell density of Microcystis
aeruginosa and Nitzschia palea with the proportion of sunk cells for M. aeruginosa, c–e: microscopic observation
of N. palea attached on bamboo fragments individually and as a flock.
The increase of N. palea by bamboo addition was observed in another mono-culture experiment using different
bamboo sticks, while such response was not found for woody and plastic sticks (personal observations, MS).
Our results are still insufficient to generalize impacts of bamboo on algal species in fields. We used the extract
of bamboo culms collected from a certain bamboo stand. Our supplemental observation using the commercial
bamboo toothpicks (Fig. 6) partially supported the findings in the extract experiments. Further studies using
bamboos from different stands, different organs (e.g., leaves, roots), different ages, and different bamboo species
are required to understand general impacts of bamboo. Furthermore, the impacts of bamboo may differ between
sterilized and unsterilized extracts. Although we autoclaved to sterilize the extract, some compounds might have
been destroyed by this process. In addition, fungi and bacterial activities may be high on unsterilized extract
amboo35,36. In another observation, colony-forming M. aeruginosa in vials without N. palea
or natural litter of b
Scientific Reports | (2022) 12:1605 | https://doi.org/10.1038/s41598-022-05506-2 7
Vol.:(0123456789)www.nature.com/scientificreports/
Bamboo stand Bamboo stand
(upstream) (near bank)
Leachates exudates Leachates exudates
Stimulate growth Diatoms
DOM, Si
Inflow river Provide substrate
Submerged litter for growth Green algae
Inhibit growth Invade Compete
Bamboo poles & Stimulate growth Diatoms
other types DOM, Si Invade
of substrates
Compete
Provide substrate
for growth Green algae Cyanobacteria
Pond or Lake ecosystem
Figure 7. Possible pathways of bamboo control on cyanobacteria. DOM: dissolved organic matter, Si: silica.
disappeared within a few days after adding an unsterilized bamboo culm piece (collected from different stands)
in the vials (personal observations, SK). Both leachates from the bamboo and microbial activities associated with
the bamboo are possible causes of the disappearance.
We suggest that bamboo can suppress M. aeruginosa through inhibiting its growth by dissolved chemicals and
through stimulating the growth of competitors, especially diatoms, either as a result of dissolved chemicals or of
providing plant material as a substrate for growth (Fig. 7). The effective extract concentration in this study (i.e.,
1–5 g L−1) is not easy to obtain in the field other than in small ponds, because 1 and 5 kg of bamboo is needed
for 1 m3 of water. Planting bamboo stands along the shoreline would increase DOM associated with bamboo
and also increase the available substrates for diatoms and green algae (Fig. 7). In addition, bamboo poles are
known to be effective substrates for developing periphyton biofilms dominated by green algae and d iatoms43–45.
Periphyton has also garnered the attention of researchers for controlling the growth of c yanobacteria55,56. Bam-
boo enables such synergetic effects of DOM and substrates in controlling cyanobacteria, which would be more
feasible for application in the field.
The colony of M. aeruginosa, which plays a key role in dominance and bloom formation, may also be a clue to
degeneration. The colony (sheath and mucilage), which mainly consists of extracellular polysaccharides, protects
cells from predators, and mitigates stress under less suitable environmental c onditions54,59. The colony also pro-
vides nutrients for their cells under low nutrient conditions and it harbors a symbiotic bacterial c ommunity68,69.
However, the results of the present and previous studies52 suggest that the colony can turn into a substrate for
attachment and food for certain algal species. It is assumed that the barrier system of the colony is weakened
by a certain stress from the external environment (e.g., in the presence of bamboo extract), which subsequently
allows the invasion of competitors.
The control of cyanobacteria using bamboo might be categorized as a biological control in a conventional
classification. However, using bamboo differs from common case, where a plant or animal that directly suppresses
cyanobacteria, is introduced and maintained in an aquatic system. Using bamboo also differs from cases that
focus on allelochemicals of plants, in which selectivity, algistatic level, dosage, and persistence, are major con-
cerns, more similar to chemical control. Because we expect that modulating the water- and habitat-environment
to enhance competitors of cyanobacteria is the major way that bamboo effects are mediated, interventions using
bamboo could be termed habitat-environmental control. This study revealed the potential roles of bamboo
extract in controlling cyanobacteria using widespread species; however, several important questions, including
relevant chemicals, variations among plant organs and among life stages, the processes involved in the increase
and decrease of algal species, and the actual effects in the field need to be addressed through further studies.
Methods
Material preparation. Three common freshwater phytoplankton species, cyanobacterium Microcystis aer-
uginosa, green alga Scenedesmus obliquus, and diatom Nitzschia palea, were used. Unicellular M. aeruginosa
(FACHB-912), S. obliquus (FACHB-14), and N. palea (FACHB-2263) were obtained from the Freshwater Algae
Culture Collection at the Institute of Hydrobiology, Chinese Academy of Science, China. In addition, colony-
forming M. aeruginosa was isolated from natural populations in Lake Taihu, Zhejiang Province, China, in Octo-
ber 2020. Medium BG-11 and CS1 (Supplementary Table S1) were purchased from the same institute. Medium
BG-11 was used to culture M. aeruginosa, and S. obliquus and CS1 was used to culture N. palea.
A 15 mL liquid of each algal species was transferred to a sterile Erlenmeyer flask, in which cells were accli-
mated for three days under a 12:12 h light/dark cycle and 1000 lx light intensity at 25 °C. The liquid was then
transferred to another sterile flask containing 30 mL of the culture medium. The cells were cultivated under a
Scientific Reports | (2022) 12:1605 | https://doi.org/10.1038/s41598-022-05506-2 8
Vol:.(1234567890)www.nature.com/scientificreports/
12:12 h light/dark cycle and 2000 lx light intensity at 25 °C. Algal cells in the exponential growth phase were
used for the experiments.
Colony-forming M. aeruginosa collected in a sterile bottle from Lake Taihu was transported in a cooler box
to the laboratory. A 10 mL was sampled from the upper layer of floating algal materials (mainly M. aeruginosa)
and added to 120 mL of BG-11 medium in a sterile flask. The culture was incubated under a 12:12 h light/dark
cycle and 2000 lx light intensity at 25 °C for a several days until M. aeruginosa entered the growing phase.
An indigenous and widespread bamboo (short-spike bamboo, Semiarundinaria densiflora (Rendle) T.H. Wen)
was collected in a public place in Wenzhou, Zhejiang Province, China. The collection of the wild plants and the
following processes were done in accordance with rules of plant collection in public places in China. The bamboo
species was identified by Yonghua Zhang (College of Life and Environmental Sciences, Wenzhou University)
and the voucher specimen was deposited in the Herbarium of Wenzhou University (WZU) (collection number:
HAM2021001). Several culms of fresh and presumably young ramets (height: 2–3 m) were collected at the edge
of a bamboo stand in summer. Peeled pieces from various positions of the culms were rinsed with ultrapure
water and dried in a shaded and ventilated place indoors (Supplementary Fig. S1). The dried pieces were then
cut and ground using a mortar and pestle. A 10 g of bamboo powder was mixed with 200 mL ultrapure water in
a flask to obtain a 50 g L−1 concentration. The flask containing the aqueous solution was autoclaved at 120 °C for
30 min to obtain the bamboo extract. After cooling, the extract was transferred to a sterile tube and centrifuged
at 10,000 × g for 10 min at 25 °C. The supernatant was divided into several aliquots and stored at − 20 °C.
In the following experiments, different amounts (0.02–10 mL) of the bamboo extract were added to the media
adjusted to 100 mL in sterile flasks with cotton plugs to give different extract concentrations (0.001–5.0 g L −1).
Mono‑culture experiments. Control and bamboo extract-treated flasks (extract concentrations: 0.001,
0.01, 0.1, 0.5, 1.0, 5.0 g L−1) were prepared for each algal species using BG-11 for M. aeruginosa and S. obliquus
and the CSi for N. palea (Supplementary Fig. S1). Each 250 mL flask was inoculated with an algal species with
an initial cell density of ca. 1.0 × 10⁵ cells mL−1. All six treatments were performed in triplicate for each spe-
cies. All the flasks were placed in a 25 °C incubator with 12:12 h light/dark cycle and 3000 lx illumination, and
they were shaken, and positions randomly rearranged, three times per day. The experiment was performed for
16 days, and a 30 μL subsample was removed from each flask every two days. The cell density in each subsample
was determined by counting the cells three times (with each time using 10 μL) using a hemocytometer under
a microscope. To homogenize algal cells in culture, pipetting to flash algal cells adhered on the flask wall and
shaking were appropriately done before the subsampling. Because S. obliquus formed four-celled coenobia, we
counted the number of coenobia.
To measure the physiological status of M. aeruginosa, additional control and bamboo extract flasks (extract
concentrations: 1.0, 2.5, 5.0 g L−1) were prepared using BG-11. Each flask was inoculated with M. aeruginosa with
an initial cell density of ca. 1.0 × 10⁵ cells mL−1. All four treatments were performed in triplicate, with incubation
as previously described. As an indicator of physiology, the pH of the culture was measured using a portable water
quality meter (HQ40D, Hach, Loveland, USA) every two days. A 10 mL subsample was removed from each flask
on days 4 and 8 for the physiological measurements.
Co‑culture experiments. Control and bamboo extract-treated flasks (extract concentrations: 1.0, 2.5, 5.0 g
L−1) were prepared for two co-culture systems (M. aeruginosa vs. S. obliquus and M. aeruginosa vs. N. palea)
using BG-11 medium modified by adding 100 mg L−1 Na2SiO3·9H2O to the original (Supplementary Fig. S1).
Each 250 mL flask was inoculated with two algal species with an initial cell density of ca. 1.0 × 10⁵ cells mL−1 for
each species. All treatments were performed in triplicate for each system. Cultivation conditions and sampling
procedures were identical to those used in the mono-culture experiments.
Co‑culture experiments using colony‑forming M. aeruginosa. Control and bamboo extract-treated
wells were prepared on a sterile culture plate using 2 mL modified BG-11 medium, and extract concentration
of 5.0 g L−1 (Supplementary Fig. S1). An intact colony of M. aeruginosa was isolated under a microscope and
inoculated into each well. The initial density of N. palea, which was originally attached to the colony of M. aer-
uginosa, was not controlled, resulting in 2–8 × 10⁴ cells mL−1. Control and extract treatments were performed in
triplicate. The cultures were incubated under a 12:12 h light/dark cycle and 3000 lx light intensity at 25 °C, and
the plate was shaken once every day until day 7. A 10 μL subsample was removed from each well on days 4 and
7 for cell counting of N. palea. The colony of M. aeruginosa was partially removed for cell counting and the cell
number for the whole colony was estimated based on the subsampled area.
Growth calculation. The specific growth rate (μ, d−1) of each species was calculated based on the initial and
final cell densities using the following equation:
lnC2 − lnC1
µ=
t2 − t2
where C1 and C2 are the cell densities (cells mL−1) at time (d) t1 and t2, respectively. In this study, t1 was 0, and t2
was 16 for the mono- and co-culture experiments, whereas t2 was 7 for the experiment using the colony-forming
M. aeruginosa.
The intrinsic growth rate (r), which represents the initial growth rate, and carrying capacity (K), which rep-
resents the final equilibrium density, were also calculated by fitting a growth curve with the following logistic
function:
Scientific Reports | (2022) 12:1605 | https://doi.org/10.1038/s41598-022-05506-2 9
Vol.:(0123456789)www.nature.com/scientificreports/
K
N(t) =
1 + (K − N0 )e−rt /N0
where N0 is the initial cell density (cells m
L−1), Nt is the cell density (cells m
L−1) at time t, K is the carrying capac-
ity (cells mL−1), and r is the intrinsic growth rate (d−1). First, r and K were calculated by solving the y-intercept
and x-intercept, respectively, in a linear regression of per-capita growth rate (dN Nt−1 dt−1) by cell density (Nt)57
(Supplementary Fig. S2). Then, N0 was estimated by non-linear regression starting with N0 of 10 using the nlsm
function in R (version 4.0.3; R Development Core Team, Vienna, Austria).
Oxidative compounds and enzyme activities. Lipid peroxidation, malondialdehyde (MDA), and anti-
oxidant enzymes have been used as indices of oxidative damage to M. aeruginosa58. The MDA content and activi-
ties of superoxide dismutase (SOD), peroxidase (POD), and catalase (CAT) in the cells were measured using
assay kits (SOD-2-Y, POD-2-Y, CAT-2-W, MDA-2-Y, Suzhou Keming Biotechnology Co., Ltd., Suzhou, China)
(Supplementary Table S2).
Statistical analysis. Dunnett’s test, which compares extract treatments (6 and 3 treatments for mono- and
co-culture, respectively) with the control, was done for μ, r, and K of each species (n = 3 for each treatment)
using R with the package of “multcomp.” An α value of 0.05 was used to determine the significance of the effects.
Data availability
The data supporting the findings of this study are available within the article and https://figshare.com/s/2c76b
602a13cb4a140c3.
Received: 30 August 2021; Accepted: 10 January 2022
References
1. Merel, S. et al. State of knowledge and concerns on cyanobacterial blooms and cyanotoxins. Environ. Int. 59, 303–327 (2013).
2. Huisman, J. et al. Cyanobacterial blooms. Nat. Rev. Microbiol. 16, 471–483 (2018).
3. Paerl, H. W. & Otten, T. G. Harmful cyanobacterial blooms: Causes, consequences, and controls. Microb. Ecol. 65, 995–1010 (2013).
4. Ibelings, B. W. & Chorus, I. Accumulation of cyanobacterial toxins in freshwater “seafood” and its consequences for public health:
A review. Environ. Pollut. 150, 177–192 (2007).
5. Cheung, M. Y., Liang, S. & Lee, J. Toxin-producing cyanobacteria in freshwater: A review of the problems, impact on drinking
water safety, and efforts for protecting public health. J. Microbiol. 51, 1–10 (2013).
6. Rousso, B. Z., Bertone, E., Stewart, R. & Hamilton, D. P. A systematic literature review of forecasting and predictive models for
cyanobacteria blooms in freshwater lakes. Water Res. 182, 115959 (2020).
7. Vadeboncoeur, Y. et al. From Greenland to green lakes: Cultural eutrophication and the loss of benthic pathways in lakes. Limnol.
Oceanogr. 48, 1408–1418 (2003).
8. Han, Z. & Cui, B. Performance of macrophyte indicators to eutrophication pressure in ponds. Ecol. Eng. 96, 8–19 (2016).
9. Dorgham, M. Effects of Eutrophication. In Eutrophication: Causes, Consequences and Control (eds. Ansari, A. & Gill, S.). vol. 2,
29–44. (Springer, 2014).
10. Glibert, P. M. Eutrophication, harmful algae and biodiversity—Challenging paradigms in a world of complex nutrient changes.
Mar. Pollut. Bull. 124, 591–606 (2017).
11. Lürling, M. & Mucci, M. Mitigating eutrophication nuisance: In-lake measures are becoming inevitable in eutrophic waters in the
Netherlands. Hydrobiologia 847, 4447–4467 (2020).
12. Hall, R. O., Likens, G. E. & Malcom, H. M. Trophic basis of invertebrate production in 2 streams at the Hubbard Brook Experi-
mental Forest. J. N. Am. Benthol. Soc. 20, 432–447 (2001).
13. Tanentzap, A. J. et al. Forests fuel fish growth in freshwater deltas. Nat. Commun. 5, 4077 (2014).
14. Fey, S. B., Mertens, A. N. & Cottingham, K. L. Autumn leaf subsidies influence spring dynamics of freshwater plankton communi-
ties. Oecologia 178, 875–885 (2015).
15. Wondzell, S. M. & Bisson, P. A. Influence of wood on aquatic biodiversity. Am. Fish. Soc. Symp. 37, 249–263 (2003).
16. Czarnecka, M. Coarse woody debris in temperate littoral zones: Implications for biodiversity, food webs and lake management.
Hydrobiologia 767, 13–25 (2016).
17. Graham, M. D. & Vinebrooke, R. D. Coupling of boreal forests and lakes: Effects of conifer pollen on littoral communities. Limnol.
Oceanogr. 51, 1524–1529 (2006).
18. Kelly, P. T. et al. Experimental whole-lake increase of dissolved organic carbon concentration produces unexpected increase in
crustacean zooplankton density. Glob. Change Biol. 22, 2766–2775 (2016).
19. Shao, J., Li, R., Lepo, J. E. & Gu, J. D. Potential for control of harmful cyanobacterial blooms using biologically derived substances:
Problems and prospects. J. Environ. Manag. 125, 149–155 (2013).
20. Tan, K. et al. A review of allelopathy on microalgae. Microbiology 165, 587–592 (2019).
21. Tsuchiya, R., Kihei, M., Sakagami, Y. & Araki, T. Assessment of inhibition effect on growth of Microcystis aeruginosa by autoclaved
water extracts from leaves of 104 woody plant species. J. Jpn. Limnol. 79, 41–48 (2018) (in Japanese with English abstract).
22. Neilen, A. D., Hawker, D. W., O’Brien, K. R. & Burford, M. A. Phytotoxic effects of terrestrial dissolved organic matter on a
freshwater cyanobacteria and green algae species is affected by plant source and DOM chemical composition. Chemosphere 184,
969–980 (2017).
23. Chen, J., Zhang, H., Han, Z., Ye, J. & Liu, Z. The influence of aquatic macrophytes on Microcystis aeruginosa growth. Ecol. Eng.
42, 130–133 (2012).
24. Zhou, B., Fu, M., Xie, J., Yang, X. & Li, Z. Ecological functions of bamboo forest: Research and application. J. For. Res. 16, 143–147
(2005).
25. Xu, Q. F. et al. Rapid bamboo invasion (expansion) and its effects on biodiversity and soil processes +. Glob. Change Biol. 21, e00787
(2020).
26. Shinohara, Y., Misumi, Y., Kubota, T. & Nanko, K. Characteristics of soil erosion in a moso-bamboo forest of western Japan:
Comparison with a broadleaved forest and a coniferous forest. CATENA 172, 451–460 (2019).
27. Suzuki, S. & Nakagoshi, N. Expansion of bamboo forests caused by reduced bamboo-shoot harvest under different natural and
artificial conditions. Ecol. Res. 23, 641–647 (2008).
Scientific Reports | (2022) 12:1605 | https://doi.org/10.1038/s41598-022-05506-2 10
Vol:.(1234567890)www.nature.com/scientificreports/
28. Buziquia, S. T., Lopes, P. V. F., Almeida, A. K. & de Almeida, I. K. Impacts of bamboo spreading: A review. Biodivers. Conserv. 28,
3695–3711 (2019).
29. Kudo, G., Amagai, Y., Hoshino, B. & Kaneko, M. Invasion of dwarf bamboo into alpine snow-meadows in Northern Japan: Pattern
of expansion and impact on species diversity. Ecol. Evol. 1, 85–96 (2011).
30. Wei, Q. et al. The diversity of soil mesofauna decline after bamboo invasion in subtropical China. Sci. Total Environ. 789, 147982
(2021).
31. Fujii, Y. & Kobayashi, Y. Allelopathic activities of leaf leachates of Bamboo and Sasa; sandwich method of 80 species. Weed Biol.
Manag. 39, 94–95 (1994).
32. Ogita, S. & Sasamoto, H. In vitro bioassay of allelopathy in four bamboo species; Bambusa multiplex, Phyllostachys bambusoides,
P. nigra, Sasa kurilensis, using sandwich method and protoplast co-culture method with digital image analysis. Am. J. Plant Sci. 8,
1699 (2017).
33. Chuyen, N. V., Kurata, T., Kato, H. & Fujimaki, M. Antimicrobial activity of Kumazasa (Sasa albo-marginata). Agr. Biol. Chem. 46,
971–978 (1982).
34. Chongtham, N., Bisht, M. S. & Haorongbam, S. Nutritional properties of bamboo shoots: potential and prospects for utilization
as a health food. Compr. Rev. Food Sci. Food Saf. 10, 153–168 (2011).
35. Singhal, P., Satya, S. & Sudhakar, P. Antioxidant and pharmaceutical potential of bamboo leaves. Bamboo Sci. Cult. 24, 19–28
(2011).
36. Jin, L. et al. Bamboo nutrients and microbiome affect gut microbiome of giant panda. Symbiosis 80, 293–304 (2020).
37. Lin, Y. T. et al. Changes in the soil bacterial communities in a cedar plantation invaded by moso bamboo. Microb. Ecol. 67, 421–429
(2014).
38. Li, Y. et al. Bamboo invasion of broadleaf forests altered soil fungal community closely linked to changes in soil organic C chemical
composition and mineral N production. Plant Soil 418, 507–521 (2017).
39. Liu, X. et al. Moso bamboo (Phyllostachys edulis) invasion effects on litter, soil and microbial PLFA characteristics depend on sites
and invaded forests. Plant Soil 438, 85–99 (2019).
40. O’connor, P. J., Covich, A. P., Scatena, F. N. & Loope, L. L. Non-indigenous bamboo along headwater streams of the Luquillo
Mountains, Puerto Rico: Leaf fall, aquatic leaf decay and patterns of invasion. J. Trop. Ecol. 16, 499–516 (2000).
41. Cai, L., Zhang, K., McKenzie, E. H. & Hyde, K. D. Freshwater fungi from bamboo and wood submerged in the Liput River in the
Philippines. Fungal Divers. 13, 1–12 (2003).
42. Suto, S. Mariculture of seaweeds and its problems in Japan. NOAA Tech. Rep. NMFS Circ 388, 7–16 (1974).
43. Milstein, A., Azim, M. E., Wahab, M. A. & Verdegem, M. C. J. The effects of periphyton, fish and fertilizer dose on biological
processes affecting water quality in earthen fish ponds. Environ. Biol. Fishes 68, 247–260 (2003).
44. Azim, M. E. et al. The effect of periphyton substrate density on production in freshwater polyculture ponds. Aquaculture 232,
441–453 (2004).
45. Khatoon, H., Yusoff, F., Banerjee, S., Shariff, M. & Bujang, J. S. Formation of periphyton biofilm and subsequent biofouling on
different substrates in nutrient enriched brackishwater shrimp ponds. Aquaculture 273, 470–477 (2007).
46. Ma, J. F. & Takahashi, E. Soil, Fertilizer, and Plant Silicon Research in Japan. (Elsevier Science, 2002).
47. Akagi, T. et al. Dissolved ion analyses of stream water from bamboo forests: Implication for enhancement of chemical weathering
by bamboo. Geochem. J. 46, 505–515 (2012).
48. Umemura, M. & Takenaka, C. Biological cycle of silicon in moso bamboo (Phyllostachys pubescens) forests in central Japan. Ecol.
Res. 29, 501–510 (2014).
49. Lürling, M. & Roessink, I. On the way to cyanobacterial blooms: impact of the herbicide metribuzin on the competition between
a green alga (Scenedesmus) and a cyanobacterium (Microcystis). Chemosphere 65, 618–626 (2006).
50. Ji, X., Verspagen, J. M., Stomp, M. & Huisman, J. Competition between cyanobacteria and green algae at low versus elevated CO2:
Who will win, and why?. J. Exp. Bot. 68, 3815–3828 (2017).
51. Kang, C. et al. Effects of macrophyte Vallisneria asiatica biomasses on the algae community. Int. J. Environ. Eng. 7, 1161–1166
(2013).
52. Hao, A., Haraguchi, T., Kuba, T., Kai, H., Lin, Y. & Iseri, Y. Effect of the microorganism-adherent carrier for Nitzschia palea to
control the cyanobacterial blooms. Ecol. Eng. 159, 106127 (2021).
53. Wang, Z., Li, G., Li, G. & Li, D. The decline process and major pathways of Microcystis bloom in Taihu Lake, China. Chin. J.
Oceanol. Limnol. 30, 37–46 (2012).
54. Xiao, M., Li, M. & Reynolds, C. S. Colony formation in the cyanobacterium. Microcystis Biol. Rev. 93, 1399–1420 (2018).
55. Wu, Y. et al. Allelopathic control of cyanobacterial blooms by periphyton biofilms. Environ. Microb. 13, 604–615 (2011).
56. Ko, S. R. et al. Bioremediation of eutrophic water and control of cyanobacterial bloom by attached periphyton. Int. J. Environ. Sci.
Technol. 16, 4173–4180 (2019).
57. Mühlbauer, L. K., Schulze, M., Harpole, W. S. & Clark, A. T. gauseR: Simple methods for fitting Lotka-Volterra models describing
Gause’s “Struggle for Existence”. Ecol. Evol. 10, 13275–13283 (2020).
58. Li, J. et al. Growth inhibition and oxidative damage of Microcystis aeruginosa induced by crude extract of Sagittaria trifolia tubers.
J. Environ. Sci. 43, 40–47 (2016).
59. Ma, J. et al. Environmental factors controlling colony formation in blooms of the cyanobacteria Microcystis spp. in Lake Taihu,
China. Harmful Algae 31, 136–142 (2014).
60. Hua, Q. et al. Allelopathic effect of the rice straw aqueous extract on the growth of Microcystis aeruginosa. Ecotoxicol. Environ.
Saf. 148, 953–959 (2018).
61. Zhao, W., Zheng, Z., Zhang, J., Roger, S. F. & Luo, X. Allelopathically inhibitory effects of eucalyptus extracts on the growth of
Microcystis aeruginosa. Chemosphere 225, 424–433 (2019).
62. Ball, A. S., Williams, M., Vincent, D. & Robinson, J. Algal growth control by a barley straw extract. Bioresour. Technol. 77, 177–181
(2001).
63. Park, M. H., Kim, B. H., Chung, I. M. & Hwang, S. J. Selective bactericidal potential of rice (Oryza sativa L. var. japonica) hull
extract on Microcystis strains in comparison with green algae and zooplankton. Bull. Environ. Contam. Toxicol. 83, 97–101 (2009).
64. Le Rouzic, B., Thiébaut, G. & Brient, L. Selective growth inhibition of cyanobacteria species (Planktothrix agardhii) by a riparian
tree leaf extract. Ecol. Eng. 97, 74–78 (2016).
65. Eladel, H., Battah, M., Dawa, A., Abd-Elhay, R. & Anees, D. Effect of rice straw extracts on growth of two phytoplankton isolated
from a fish pond. J. Appl. Phycol. 31, 3557–3563 (2019).
66. Yang, J. et al. High temperature and pH favor Microcystis aeruginosa to outcompete Scenedesmus obliquus. Environ. Sci. Pollut. Res.
25, 4794–4802 (2018).
67. Grover, J. P. Phosphorus-dependent growth kinetics of 11 species of freshwater algae. Limnol. Oceanogr. 34, 341–348 (1989).
68. Shia, L. et al. Community structure of bacteria associated with Microcystis colonies from cyanobacterial blooms. J. Freshwat. Ecol.
25, 193–203 (2010).
69. Smith, D. J. et al. Individual Microcystis colonies harbour distinct bacterial communities that differ by Microcystis oligotype and
with time. Environ. Microbiol. 23, 3020–3036 (2021).
Scientific Reports | (2022) 12:1605 | https://doi.org/10.1038/s41598-022-05506-2 11
Vol.:(0123456789)www.nature.com/scientificreports/
Acknowledgements
We thank Y. Zhang for the identification of bamboo species and the deposit of voucher specimen in herbarium,
students of Aquatic Ecology and Symbiology, College of Life and Environmental Sciences, Wenzhou University
for helping with the laboratory and field collections, and Editage for English language editing.
Author contributions
A.H. and M.S. originally designed the study, carried out experiments, analyzed, and summarized results. M.Z.
provided a key idea of the study and supported the experiments. S.K. and Y.I. reorganized data, developed inter-
pretation, and wrote manuscript with substantial input from the other authors.
Funding
This study was supported by a fund of National Key Research and Development Program of China (Grant No.
2018YFE0103700).
Competing interests
The authors declare no competing interests.
Additional information
Supplementary Information The online version contains supplementary material available at https://doi.org/
10.1038/s41598-022-05506-2.
Correspondence and requests for materials should be addressed to S.K. or Y.I.
Reprints and permissions information is available at www.nature.com/reprints.
Publisher’s note Springer Nature remains neutral with regard to jurisdictional claims in published maps and
institutional affiliations.
Open Access This article is licensed under a Creative Commons Attribution 4.0 International
License, which permits use, sharing, adaptation, distribution and reproduction in any medium or
format, as long as you give appropriate credit to the original author(s) and the source, provide a link to the
Creative Commons licence, and indicate if changes were made. The images or other third party material in this
article are included in the article’s Creative Commons licence, unless indicated otherwise in a credit line to the
material. If material is not included in the article’s Creative Commons licence and your intended use is not
permitted by statutory regulation or exceeds the permitted use, you will need to obtain permission directly from
the copyright holder. To view a copy of this licence, visit http://creativecommons.org/licenses/by/4.0/.
© The Author(s) 2022
Scientific Reports | (2022) 12:1605 | https://doi.org/10.1038/s41598-022-05506-2 12
Vol:.(1234567890)You can also read