Natural Gas - an Environmentally Friendly Fuel for Urban Vehicles: the Smart Demonstrator Approach - Revue d ...
←
→
Page content transcription
If your browser does not render page correctly, please read the page content below
Oil & Gas Science and Technology – Rev. IFP, Vol. 61 (2006), No. 1, pp. 155-164
Copyright © 2006, Institut français du pétrole

                                                                                                                      Dossier
                                                                                           Development and Control of Combustion Systems
                                                                                           Évolutions et contrôle des systèmes de combustion

       Natural Gas - an Environmentally Friendly Fuel
                    for Urban Vehicles:
            the Smart Demonstrator Approach
                                      R. Tilagone1, S. Venturi1 and G. Monnier2
                                                     1 IFP-Lyon, BP 3, 69390 Vernaison - France
                     2 Institut français du pétrole, 1 et 4, avenue de Bois-Préau, 92852 Rueil-Malmaison Cedex - France
                                  e-mail: richard.tilagone@ifp.fr - stephane.venturi@ifp.fr - gaetan.monnier@ifp.fr

           Résumé — Le gaz naturel, un carburant adapté pour les véhicules urbains : cas du démonstrateur
           Smart — La réduction des gaz à effet de serre est un objectif important qui concerne l’ensemble des
           consommateurs dont notamment le secteur industriel.
           En ce qui concerne l’automobile, l’engagement pris par les constructeurs européens (diminution des
           émissions de CO2 émis par le parc commercialisé à 140 g/km sur cycle normalisé d’ici 2008) répond aux
           recommandations de la Commission européenne en la matière.
           La réduction sensible du CO2 émis par les automobiles nécessite une réduction de la consommation
           globale de carburant. L’utilisation de carburants avantageux sur le plan du rapport H/C est également une
           voie efficace. Une solution technologique pertinente pour la réduction de la consommation spécifique des
           moteurs consiste à en réduire la cylindrée, approche communément appelée « downsizing » ou
           « éco-suralimentation ». Compte tenu de ses propriétés physico-chimiques, le gaz naturel est un carburant
           parfaitement adapté pour réduire ces émissions de CO2 ; il présente en effet un rapport H/C élevé (proche
           de 4) permettant un gain de l’ordre de 23 %, et des réglages de la combustion à très haut rendement
           (indice d’octane proche de 130).
           L’objectif majeur de ce projet a été de démontrer l’intérêt du gaz naturel en tant que carburant vis-à-vis
           de la réduction des émissions de CO2. La première étape a consisté à optimiser le moteur pour un
           fonctionnement dédié (pistons pour un rapport volumétrique de compression augmenté, bielles
           renforcées, vilebrequin, etc.), puis la combustion a été optimisée grâce à des essais au banc moteur où les
           cartographies de base ont été réalisées. La suralimentation par turbocompresseur et le calage de
           distribution ont été particulièrement travaillés pour maintenir des performances en puissance comparable
           au moteur essence. L’optimisation s’est poursuivie sur le véhicule dont les derniers résultats obtenus
           confirment le faible niveau de CO2, 90 g CO2/km ce qui représente une diminution de 27 % par rapport à
           l’essence, le respect des normes EURO IV et un agrément de conduite conforme aux attentes client.

           Abstract — Natural Gas - an Environmentally Friendly Fuel for Uurban Vehicles: the Smart
           Demonstrator Approach — The reduction of greenhouse gases emissions remains one of the most impor-
           tant challenges stakes for the next decades involving all energy consumers and especially the
           industrial actors, although the need to make better use of energy is not appreciated to the same extent by
           all industrial countries.
           For the automotive sector, the European car manufacturers’ commitment (reduction of the average fuel
           consumption for new vehicles to 140 grams of CO2 produced per kilometer by 2008) appears to be a
           valuable contribution towards meeting the recommendations of the European Commission.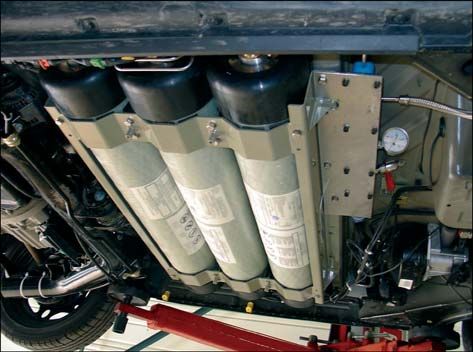
156                                   Oil & Gas Science and Technology – Rev. IFP, Vol. 61 (2006), No. 1

             A sharp CO2 emission reduction requires efforts both to reduce vehicle’s fuel consumption, and to widen
             the use of fuel with advantageous molecular hydrogen to carbon (H/C) ratio. Alongside vehicle’s
             optimization itself, improving engine efficiency remains the main target. Reduction of engine displace-
             ment volume (commonly named downsizing) is an efficient way to achieve this target. Due to its interest-
             ing chemical properties, Natural Gas can be used to achieve low carbon dioxide levels (H/C ratio close
             to 4), while at the same time maintaining high thermal efficiency through dedicated engine development.
             The main objective of this project is to confirm (with a dedicated demonstrator vehicle) the high
             efficiency of CNG fuel when used in urban conditions. The target is to achieve low CO2 emissions with a
             maximum level of 90 g/km on the MVEG driving cycle, while keeping pollutant emissions below
             EURO IV level.
             The first step was dedicated to CNG specific engine parts design (pistons, connecting rod, crankshaft,
             etc.) in order to optimize CNG configuration. During the following steps, the engine has
             been optimized on a test bench. Valve timing and turbocharger selection have been optimized in order
             to obtain the best trade-off in terms of power, consumption and pollutants. The final step has been spent
             to calibrate the engine, firstly on the test bench and secondly on the vehicle. This work allows
             coping with EURO IV emissions level with optimized catalyst light-off, transient running conditions, drive-
             ability, etc.

INTRODUCTION                                                                Mainly composed of methane (between 80% to 98%),
                                                                         Natural Gas has a high Research Octane Number (RON),
For many decades, Natural Gas has been used as a reliable,               higher than 120 as compared to 95 for European Eurosuper
safe and efficient fuel for transportation, in favor of emission         premium gasoline, leading to high knocking resistance.
reduction of greenhouse and toxic gases. Today, Natural Gas              Thanks to this characteristic, the engine can be designed with
resources are equivalent to oil resources in terms of energy             a higher compression ratio than for conventional gasoline
ready to be exploited, and with homogeneous distribution on              engines and Maximum Best Torque (MBT) advances can be
the earth.                                                               selected with continuous stoichiometric conditions whatever
   It has been demonstrated that local emissions from                    the load and engine speed.
Natural Gas vehicles present low reactivity and toxicity.                   These key factors enhance thermal efficiency and permit
Figure 1 compares the potential of ozone formation taking                exhaust emissions to be reduced especially for turbocharged
                                                                         engines. For instance, raw unburned hydrocarbon emissions
into account types of exhaust gases emitted by conventional
                                                                         are 50% smaller than those of the gasoline baseline engine.
vehicles: gas fuels remain the most promising.
                                                                         The gaseous state avoids the wall-wetting effect on the intake
                                                                         manifold and cylinder liner especially at cold start conditions
                                                                         and limits oil film adsorption-desorption phenomena.
                                                                            Moreover, due to the H/C molecular ratio close to four,
                                                                         CO2 emissions at stoichiometric conditions are 23 % lower
  CNG with 3W-cat            0.02                                        than for gasoline (for the same energy introduced into the
                                    0.06                                 combustion chamber), Table 1.
   LPG with 3W-cat
                                                                            These advantages are highlighted by several Well-to-
      Diesel with cata                     0.24                          Wheel analyses as shown in the EUCAR-Concawe-JRC
                                              0.30
                                                                         study published in 2003, Figure 2, which reveals Natural Gas
   Diesel w/out cata
                                                                         as a promising way to reduce equivalent CO2 emissions.
 Gasoline with cata                           0.33                       Natural Gas offers a real alternative to fulfil European Car
                                                       6.00              Manufacturers commitments, which aim to reduce CO2 emis-
Gasoline w/out cata
                                                                         sions from European cars on the road to 140 g/km by 2008.
          2 Wheeler                                        14.00         This remains ambitious however considering the gains
                                                                         already obtained by small gasoline and Diesel vehicles on the
                      0.01       0.1        1        10        100
                                                                         European traffic.
                              Ozone potential (grO3/km)
                                                                            Alongside the benefits of using Natural Gas, some draw-
                                                                         backs should be mentioned:
      Figure 1                                                           – Depending on the gas field location and the gas supplier’s
      Ozone potential for several vehicles.                                 strategy on the commercial network, characteristics vary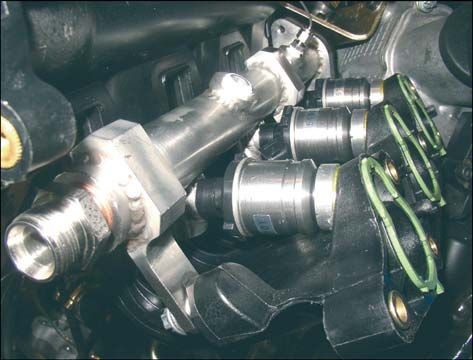
R Tilagone et al. / Natural Gas - an Environmentally Friendly fuel for Urban Vehicles: the Smart Demonstrator Approach 157
TABLE 1
Theoretical CO2 emissions for stoichiometric combustion
CO2 LHV CO2
H/C
(gr/gr of fuel) (kJ/kg (gr/kJ) × 1000
Natural Gas 3.7/3.9 2.75 –13.5% 48,444 56.8 –23.8%
LPG (50/50) 2.5 3.03 –4.7% 46,055 65.8 –11.7%
Diesel fuel 1.9 3.17 –0.3% 42,769 74.1 –0.5%
Gasoline 1.8 3.18 – 42,690 74.5 –
in accordance with Natural Gas composition. Fortunately engine should develop an output power of approximately
however, whatever the Natural Gas variation (Air/Fuel 7 kW. This output power represents at 2000 rpm a Brake
ratio, Low Heat Value and knock Index), the energy held Mean Effective Pressure (BMEP) of 2 bars for a 2-Liter dis-
in a fixed equivalence ratio, and consequently the rated placement engine and twice as much for a 1-Liter displace-
power from the engine equipped with an Air/fuel ratio ment engine. Figure 3 shows a representative Specific Fuel
close-loop control system, are not greatly affected. Consumption (SFC) map of a current conventional SI-PFI
– Obviously, Low Heat Value may affect driving range, and gasoline engine.
so, a high capacity tank and high pressure are necessary By assuming the assumption that specific fuel consump-
for gaseous storage. For instance, with a storage pressure tion for a given engine load does not change depending on
of 20 MPa, the volume necessary for the same energy on the swept volume per unit, dividing the swept volume by 2
board is four times as big compared to gasoline, Table 2. results for this simple case in reducing the specific consump-
tion from 380 g/kWh to 300 g/kWh (look at the two colour
points). In a real case, due to the increase of losses for a small
1 STOICHIOMETRIC TURBOCHARGED SMALL
size combustion chamber (heat transfer and relative friction
ENGINES: THE DOWNSIZING APPROACH
losses), the benefit in terms of fuel consumption is less
The reduction of the engine’s size is an efficient way to important, and so the resulting CO2 emissions reduction is
reduce specific consumption by reducing friction losses for between 15% and 20%.
engine load controlled by a throttle, and promoting better Nevertheless, limitation of size reduction is necessary to
efficiency conditions (higher loads). avoid requirement of too high BMEP, especially for gasoline
For instance, to drive a mid-range vehicle at a constant application due to knock sensitivity and pollution. Moreover,
speed of 70 km/h, a conventional gasoline port injection reducing swept volume affects performances for naturally
Compressed natural gas (CNG) 296
1.1 263 302
Brake Mean Effective Pressure (MPa)
220 266 321
1.0 279 260
WTW GHG g CO 2eq/km)
255
200 0.9 289
Gasoline 2002 Piped, 310
255 344
4000 km
0.8 270
180 260
0.7 270 310
LNG 270 310
Conv. Diesel 2002 Gasoline CNG 2002 0.6
160 2010
Conv. Diesel 2010 290
0.5 290 320
Gasoline
140 2010 hyb. 0.4 310
CNG 2010 310 320
320 350
0.3 350
Conv. Diesel 350
120 2010 hyb.
430
430
0.2 430
CNG 2010 hyb.
100 0.1
150 170 190 210 230 250 270 290 310 0
WTW energy (MJ/100km) 1000 2000 3000 4000 5000 6000
Engine speed (rev/min)
Figure 3
Figure 2 Specific consumption for a conventional medium size SI-FPI
EUCAR-Concawe-JRC Well to Wheel analysis. gasoline engine.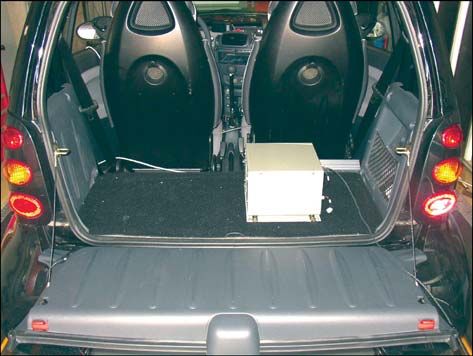
158 Oil & Gas Science and Technology – Rev. IFP, Vol. 61 (2006), No. 1
TABLE 2
Energy per storage volume for common fuel
Tank volume
Density LHV Energy
for equivalent
kg/m3 kg/m kg/m3
energy stored
Gasoline 750 42,690 32,020 –
Diesel fuel 835 42,770 35,710 × 0.9
Gaseous CH4
0.716 50,010 36 × 895
1013 hPa, 273 K
Gaseous CH4
173 50,010 8,652 × 3.7
20,0 Mpa, 293 K
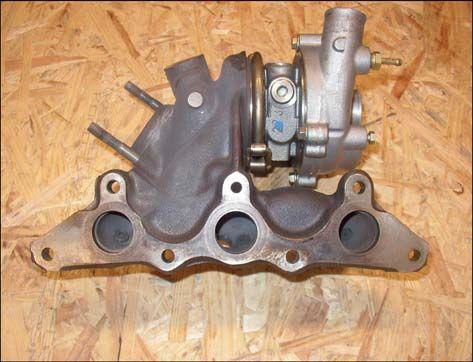
aspirated conditions, with more severe penalty for a Natural The same camshaft in the cylinder head (with hydraulic valve
Gas engine due to the gaseous phase (volumetric efficiency lift), driven with a chain actuates the two valves on each
could be affected by over 10%). cylinder. The exhaust manifold includes a turbine house as
The drop in performance can be partially removed with shown in Picture 1, allowing thermal losses to be reduced,
stoichiometric conditions, more suitable to cope with the strin- then the maximum of exhaust gas enthalpy to be obtained.
gent emissions regulation, using a proven three-way catalyst Two spark plugs per cylinder stabilize the combustion at
and with fewer penalties to control transient conditions. Using delayed spark advance.
a supercharger is another efficient way to overcome this
drawback.
In the case of a downsized turbocharged Natural Gas 3 REFERENCE TESTS WITH THE SMART GASOLINE
engine, the stoichiometric approach leads to a higher exhaust VEHICLE
temperature in comparison to lean-burn approach, helpful
In order to establish reference data and to be able to quantify
both to optimize enthalpy of the exhaust gas and to reduce
unburned hydrocarbon during the cold start-up phase. the real impact of using Natural Gas compared to gasoline
fuel, many tests have been carried out at IFP. Tests on the
chassis-dynamometer bench concern two gasoline vehicles:
2 TECHNICAL FEATURES the first one unused and the second one underlining the
OF THE PRODUCTION SMART 600cc ENGINE impact of mileage.
The Smart vehicle offers characteristics proper to urban vehi-
cles: small dimensions, light weight and low consumption
helping to reduce CO2 emissions. Designed by SUPREX for
MCC, the mechanical features of this 3 cylinder-in-line
engine are as follows:
– bore x stroke: 63.5 mm x 63 mm;
– gasoline compression ratio: 9.5:1.
Output performances announced by MCC are attainable
with the GT12 cooled turbocharger produced by AlliedSignal
Automotive (GARRETT), allowing over-boost conditions. In
this case, the intake manifold pressure is regulated to 2 bars
instead of 1.8 bars:
– output Power: 40 kW at 5250 rev/min;
– maximum Torque: 80 Nm from 2000 rev/min to 4500 rev/
min;
– maximum over boost Torque: 88 Nm from 2000 rev/min
to 4500 rev/min.
The air coming from the compressor is cooled with a Picture 1
specific air/air cooler without any exhaust gas recirculation. Exhaust manifold.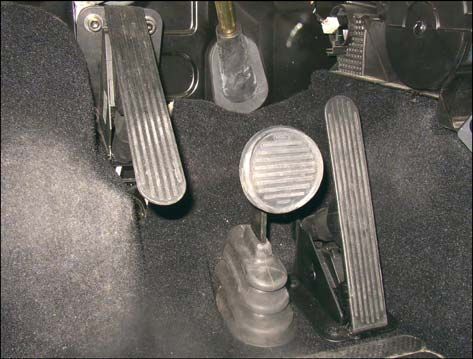
R Tilagone et al. / Natural Gas - an Environmentally Friendly fuel for Urban Vehicles: the Smart Demonstrator Approach        159

 Results obtained on the European Driving Cycle are similar             lower electrical power and help to reduce leakage after
to those found by UTAC, the company in charge of determin-              engine switch-off.
ing the drag and friction losses curve. They confirm that                   As shown in Picture 2, a special Natural Gas rail has been
gasoline vehicle pollutant emissions meet the EURO IV reg-              fitted on the intake manifold without any design modification.
ulation whatever the mileage, Table 3.                                      Tests on the engine-bench were performed using the IFP
    Nevertheless, CO2 emissions for the gasoline Smart are              in-house electronic management system ACEboxTM (Auto-
unexpected, with an increase between 10% and 15% in com-                motive Control Engine based on XPCtargetTM), which is able
parison to official figures, probably due to higher mechanical          to drive the engine on the bench as in a vehicle. Mappings on
losses.                                                                 steady state conditions were optimised before implementing
                                                                        the data into the vehicle Electronic Control Unit.
                                TABLE 3
                                                                            Figure 4 compares Break Mean Effective Pressure versus
                     UTAC and IFP NEDC results                          engine speed at full load conditions, for Natural Gas and
                      Mileage        CO            HC    NOx    CO2
                                                                        gasoline settings. From 2700 rpm to maximum engine speed,
                       km           g/km          g/km   g/km   g/km
                                                                        the turbocharger is able to compensate the volumetric effi-
                                                                        ciency drop, noticeable when using gaseous fuel. The maxi-
         Euro IV - 2005              1.00         0.10   0.08
                                                                        mum output-power is not affected. At lower engine speed,
  UTAC results         3,150         0.26         0.08   0.04   140.5   maximum torque is obtained at 300 rpm higher than for gaso-
  IFP results           3,270        0.30         0.09   0.04   136.4   line. This difference can of course be partially removed with
  IFP results          52,220        0.38         0.06   0.05   131.7   additional improvements (turbocharger geometry, electrical
                                                                        assistance, etc.) but it does not affect significantly the vehicle
                                                                        behavior.
4 BENCH RESULTS WITH A NATURAL GAS ENGINE                                   Looking at thermal efficiency, the Natural Gas curve
                                                                        stands out from the gasoline curve with a favorable gap
Several mechanical adaptations were made before carrying                whatever the engine speed. From 2500 rpm, thermal effi-
out engine tests for an optimal use of the Natural Gas                  ciency obtained with Natural Gas is 25% higher than for
Vehicle. Modifications concern the compression ratio                    gasoline, leading to a reduction of CO2 emissions close to
increase, from 9.5:1 to 12.0:1 and the setting up of the                35%, combining the effects of compression ratio, settings
Natural Gas line.                                                       and the H/C ratio. This good result is all the more advanta-
   Due to higher in-cylinder pressure (Best-Torque Spark                geous that the swept volume is reduced (downsizing) and
Advance and higher compression ratio) new strengthened                  consequently, that high load is in demand.
pistons have been designed and machined. Connecting rods                    Thanks to the high equivalence octane number, Natural
have been modified too. Low-pressure Natural Gas injectors              Gas spark advances are optimal although the compression
(~4 bar) from Keihin have been selected. They needed                    ratio of 12.0:1, leading to maximum torque, Figure 5. The
                                                                        gasoline spark advance on the reference engine must be
                                                                        reduced from 1800 rev/min (knock limit), and enrichment is
                                                                        rapidly necessary to control exhaust temperatures, which
                                                                        drastically increase when spark advances are delayed.
                                                                            Stoichiometric conditions and Maximum Best Torque
                                                                        advances are therefore continuously used for Natural Gas
                                                                        conditions. Due to high load conditions frequently used on so
                                                                        small engine, those results lead to a huge thermal efficiency
                                                                        in real operating conditions while maintaining near zero
                                                                        emission, whatever the driving conditions are, when the
                                                                        catalyst is warm.
                                                                            Results at part load conditions also distinguish the Natural
                                                                        Gas engine. Figures 6 compares at 2000 rpm the results
                                                                        obtained with Natural Gas (compression ration: 12.0:1) and
                                                                        gasoline (compression ration: 9.5:1). Thank to the compression
                                                                        ratio, thermal efficiency for Natural Gas tests is significantly
                                                                        higher than for gasoline, while NOx and unburned hydrocar-
                                                                        bons emissions are not significantly different from gasoline
     Picture 2                                                          tests. The mass of unburned hydrocarbons captured in
     Gas rail in connection with gas injectors.                         combustion chamber crevice increase during the compression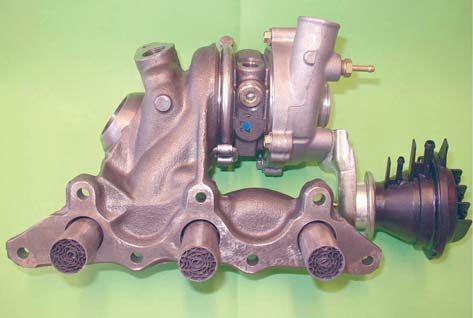
160 Oil & Gas Science and Technology – Rev. IFP, Vol. 61 (2006), No. 1
Full load comparison Full load comparison
20 44 1.45 20
+ 300 rpm 42 1750 rpm 15
Spark advance timing (CA)
18 1.40
Equivalence air fuel ratio
16 40 1.35 10
Thermal efficiency (%)
14 Gasoline bmep 38 1.30 5
NG bmep 0
36 1.25
BMEP (bar)
12 Gasoline efficiency
NG efficiency 1.20 -5
10 34 Gasoline equiv. ratio
1.15 2500 rpm -10
8 32 NG equiv. ratio
1.10 Gasoline spark timing -15
6 30 NG spark timing
- 35 % CO2 1.05 -20
4 + 25 % 28
1.00 -25
2 26
0.95 -30
0 24 0 1000 2000 3000 4000 5000 6000
800 1300 1800 2300 2800 3300 3800 4300 4800 5300 5800
Engine speed (rev/min)
Engine speed (rev/min)
Figure 4 Figure 5
BMEP and thermal efficiency at full load condition (gasoline Equivalence ratio and spark timing at full load condition
and Natural Gas). (gasoline and Natural Gas).
Thermal efficiency (%) and exhaust emissions (g/kWh)
Part load at 2000 rpm In-cylinder Pressure (bar) at 2000 rpm
Part load conditions
40
95 3
36
85 2
In-cylinder pressure- cyl1 (bar)
32
Thermal efficiency (%)
75 1
d(Pressure)/d(CA)
28
65 0
24
55 Natural Gas Gasoline -1
20 BMEP = 6.41 bar BMEP = 6.73 bar
45 IMEP = 7.45 bar IMEP = 7.33 bar NG In-Pcyl -2
16 NG efficiency IMEPhp = 7.75 bar IMEPhp = 7.64 bar Gasoline In-Pcyl
35 Pmax = 44.7 bar Pmax = 39.8 bar NG dPcyl/dCA -3
APmax = 373 CA APmax = 375 CA
12 Gasoline dPcyl/dCA
Gasoline efficiency 25
dP/dCA max = 1.9 bar/° dP/dCA max = 2.4 bar/°
Spark Ad. = 16° (BTDC) Spark Ad. = 15° (BTDC) -4
8
15 -5
4
5 -6
0
0 2 4 6 8 10 12 14 16 18 -5 -7
BMEP (bar) 0 60 120 180 240 300 360 420 480 540 600 660 720
Crank Angle (°)
Figure 6 Figure 7
Thermal effiiency at 2000 rpm (gasoline and Natural Gas). Combustion (gasoline and Natural Gas).
stroke due to higher in-cylinder pressure. Notice that at this The difference between gasoline and Natural Gas brake
engine speed, the turbocharger is not able to compensate the thermal efficiency expressed in equivalent gasoline fuel con-
drop of volumetric efficiency that occurs when using gaseous sumption is plotted for the entire running conditions on
fuel. For 2000 rpm at full load, the maximum BMEP is con- Figure 8. As seen, the gasoline engine consumption is higher
sequently limited for Natural Gas test. at low and high loads for each engine speed. The lowest dif-
For a comparable load at 2000 rpm, Figure 7 compares the ference calculated (based on steady state mapping) is
in-cylinder pressure curves during a cycle and the maximum of 3 g/kWh at 1500 rev/min and a Brake Mean Effective
heat releases. Despite of a maximum of pressure obtained with Pressure of 8 bars (star mark). Some steady state running
the Natural Gas configuration and its higher compression ratio, points corresponding to conditions encountered on the
the pressure diagram corresponding to maximum spark NEDC cycle are plotted (circle marks), mainly located in the
advance for best torque is worse than the gasoline one because highest difference area. As shown, fuel economy is sensitive
of too much negative mechanical energy before top dead cen- both on the NEDC cycle and all the more at maximum power
tre due to the slowest combustion speed of Natural Gas. conditions.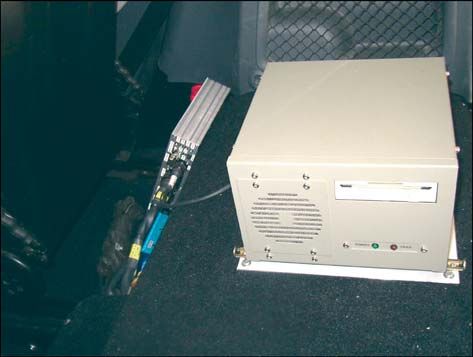
R Tilagone et al. / Natural Gas - an Environmentally Friendly fuel for Urban Vehicles: the Smart Demonstrator Approach      161

5 RESULTS OBTAINED WITH THE NATURAL GAS                             5.3 On-Board Management System
  SMART ON CHASSIS-DYNAMOMETER BENCH
                                                                    The vehicle’s on-board management system is composed of a
The Smart itself has been modified as a special Natural Gas         Supervisor computer located in the boot and a Sequencer
urban vehicle. The main modifications concern the original          computer, located behind the front right seat, in charge of tim-
driven gearbox, setting up of the gas tanks high-pressure           ing and of input/output signal management, Pictures 5 and 6.
line. Finally, the gas engine was installed in the vehicle with        The luggage space available is not affected, especially as
the in-board electronic management system developed by              the supervisor computer (the biggest one) will be removed at
IFP in partnership based on the ACEboxTM device.                    the end of the optimization tests.
                                                                       The Natural Gas Smart has been presented in 2004 at the
5.1 Gear Box Adaptations                                            Paris World Auto-show (“Gaz de France” booth) and at the
                                                                    Pollutec Exhibition.
For a simple gearbox control without any special Electronic            Today, the CO2 emissions on the NEDC cycle are already
Management System, the electrical engine that sets the gear         lower than 100 g/km, Table 4, which corresponds to a total
forks in motion has been removed and replaced by a classical        reduction of 27%, 23% of which is due to Natural Gas and
mechanical system. The clutch mechanism also driven by the          5% to engine optimization.
electrical engine is not modified, except for its control, which
                                                                       Work is still on going to reduce regulated emissions and
is done by an additional EMS developed especially for this
                                                                    especially Unburned Hydrocarbons mainly composed of
application.
                                                                    methane (> 90%). However, results obtained with a common
   As seen in Picture 3, an additional pedal is installed for
                                                                    gasoline exhaust line are similar to results for gasoline,
clutching operations.
                                                                    Table 4. These results are really encouraging, but post-treat-
                                                                    ment remains an essential stage to succeed in lowering regu-
5.2 Setting Up the Natural Gas Tanks                                lated exhaust emissions with a large margin.
Three tanks built with a composite material have been
                                                                                                 TABLE 4
designed and realized by ULLIT. Located in the chassis,
Picture 4, the ground clearance and volume of the boot are                    Smart results on NEDC with gasoline exhaust line
not modified. A metallic shell covers the tank during running
conditions (removed on this picture).                                                            CO         HC         NOx       CO2
                                                                                                g/km       g/km        g/km      g/km
   The total storage capacity is 35 liters, which represents on
an NEDC cycle and for 20 MPa gas pressure, a driving range              Euro IV - 2005           1.00       0.10       0.08
of approximately 180 kilometers (for a vehicle quoted                   Gasoline (IFP)           0.30       0.09       0.04      136.4
100 g CO2/km).                                                          Natural Gas (IFP)        0.31       0.11       0.05      100.0

     Picture 3                                                           Picture 4
     Added clutch pedal on the left side.                                Under floor view.
162 Oil & Gas Science and Technology – Rev. IFP, Vol. 61 (2006), No. 1
Picture 5 Picture 6
Boot with on-board EMS. Supervisor and Sequencer computers.
18
17 25 23
19 25
16 21
Brake mean effective pressure (bar)
15 20
14
10
12
120 km/h
10 7 5th gear
3 100 km/h
8 7 5 5th gear
7 70 km/h
6 5th gear
4
50 km/h
10 35 km/h 3rd gear
2 15 km/h 2nd gear
2015 1st gear
30
Picture 7 0
1000 2000 3000 4000 5000
Metallic light-off implementation. Engine speed (rev/min)
Figure 8
So, catalyst formulation and loading optimized for Natural Equivalent gasoline BSFC difference between gasoline and
Gas exhaust after-treatment are under assessment. Three NG engine.
small metallic converters (Bore 20 mm/Length 40 m/Volume
13 cc) are located between the cylinder-head duct and the
exhaust manifold, Picture 7. Loaded with the same formula-
tion, they should improve after-treatment efficiency, espe- over the official figure. This difference is probably due to
cially during the critical first seconds after start-up. Final friction loss difference.
results are expected by the year 2005.
To be able to estimate the real potential of the Natural Gas
Smart Demonstrator, the calibration of the chassis-dynamome-
6 EFFECT OF DRAG AND FRICTION LOSSES CURVE ter bench has been adjusted to measure the official emissions,
118 g CO2/km instead of 136 g CO2/km. As seen on Figure 9,
As previously mentioned chassis-dynamometer results reveal the Natural Gas Smart Demonstrator potential is lower than
that the tested gasoline Smart vehicle emits CO2 emissions 90 g CO2/km, more efficient than the Smart Diesel version.R Tilagone et al. / Natural Gas - an Environmentally Friendly fuel for Urban Vehicles: the Smart Demonstrator Approach 163
2 Heitzer, M., Langen, P., Kramer, F. and Meyer, O. (2000)
140 Achieving low emissions and high engine efficiency with
136 natural gas. IANGV Yokohama.
120
118 3 Sun, X., Wiedmann, T. and Hussain, S., Fuel management
100 and exhaust emissions of light-and heavy-duty trucks
CO2 emissions g/km
101 operating on CNG and LPG. SAE paper 971661.
80 87 4 Suga, T., Muraishi, T. and Bienenfeld, R. (2000) Potential of
a low-emission natural gas vehicle for the 21st century.
60 IANGV Yokohama.
40 5 Tilagone, R., Monnier, G., Satre, A., Lendresse, Y.,
Personnaz, J., Cullerier, D. and Turin F., Development of a
20 lean-burn natural gas powered vehicle based on a direct-
injection diesel engine. SAE paper 2000-01-1950.
0 6 Johansson, B. and Olsson, K. (1995) Combustion Chambers
Standard Modified Standard Modified for Natural Gas SI Engines Part I : Fluid Flow and
calibration: calibration: calibration: calibration: Combustion. SAE paper 950469.
Gasoline Gasoline Natural gas Natural gas
result result result result 7 Olsson, K., and Johansson, B. (1995) Combustion Chambers
for Natural Gas SI Engines Part I : Combustion and
Emissions. SAE paper 950517.
Figure 9
8 Tilagone, R., Monnier, G., Chaouche, A., Baguelin, Y. and
Chassis-dynamometer Bench calibration. De Chauveron, S. (1996) Development of a high efficiency,
low emission SI-CNG bus engine. SAE paper 961080. Detroit
(USA).
9 Gaz de France (1993) Combustibles gazeux et principes de la
combustion (BT104).
10 Union européenne (2000) Bilan Auto-oil.
CONCLUSION 11 Cornetti, G. (1999) Alternative fuels : the natural gas. ATA,
vol. 52, Nov.-Dec.
The partnership between Gaz de France and IFP with
12 Cedigaz (2002) Natural gas in the world.
funding from ADEME confirms the great interest of Natural
13 Guibet, J-C. (1997) Carburants et Moteurs, vol. 1 et 2.
Gas used as a special fuel for downsized engine.
14 Journal Officiel des Communautés Européennes, L107/10.
Important reductions of CO2 emissions on the NEDC Directive 2001/27/CE de la Commission du 10 April 2001.
cycle 27%, and 35% for full load conditions have been 15 Norm ISO 15403 (2000) Gaz naturel - Désignation de la
obtained. Regulated emissions with the conventional gasoline qualité de gaz naturel pour usage comme carburant
exhaust line are close to gasoline emissions: the next calibra- comprimé pour véhicules.
tion tests with special after-treatment should drastically 16 Norm ISO 6976 (1997) Gaz naturel - Calcul du pouvoir
reduce those emissions. calorifique, de la masse volumique, de la densité relative et
de l’indice de Wobbe à partir de la composition.
New gas tanks made of composite material are set up so
17 IANGV (International Association for Natural Gas Vehicles
that previous space inside the vehicle is not affected. The (2000) Emissions report, part 2 : fuel properties.
weight overload is limited to 40 kg. 18 Buthker, E. (2000) World Wide NGV standards and
Drive-ability and driving range are in accordance with Regulations. Session 2A. IANGV.
“urban” expectations 19 AFGNV (Association Française du gaz naturel pour
Finally, the development of the NG Smart demonstrator véhicules) (2001) Rapport d’activité.
copes with IFP strategy since the Natural Gas pathway is one 20 Zanetta, P. (2001) GNV : une première étape est franchie.
Pétrole et gaz informations, n° 1755.
of the most efficient ways to reduce both greenhouse gases
21 Plouchard, G. (2002) Le gaz naturel véhicules : les enjeux
and pollutant emissions from transportation. énergétiques et environnementaux de son développement
durable. Rapport du Groupe de travail Energie Environnement
de l’AFGNV.
ACKNOWLEDGEMENTS 22 Nylund, N.O., Laurikko, J., Ikonen, M (2002) Pathways for
natural gas into advanced vehicles.
The Authors would like to thank technical and financial 23 Well to Wheel Energy use and Green Gas Emissions of
partners and all colleagues from IFP involved in the projects. Advanced Fuel/Vehicle Systems - North American Analysis.
Argonne National Lab. vol 1-2 (2001).
24 Weiss, M.A., Heywood, J.B., Drake, E.M., Schafer, A. and
AuYeung, F.F. (2000) On the Road in 2020. A life-cycle
REFERENCES analysis of new automobile technologies. MIT EL 00-003.
1 Heitzer, M., Langen, P., Kramer, F and Meyer, O. (2000) 25 Choudhury, R. (2002) Well to Wheel analysis of energy use
Achieving low emissions and high engine efficiency with and greenhouse gas emissions of advanced fuel/vehicle
natural gas. IANGV Yokohama. systems.164 Oil & Gas Science and Technology – Rev. IFP, Vol. 61 (2006), No. 1
26 Livre Blanc (2001) La politique européenne des transports à 29 Orselli, J. (1992) Energies nouvelles pour l’automobile.
l’horizon 2010. L’heure des choix. European commission European commission.
COM, 370.
30 Rouveirolles, P., (2000) Les spécifications des carburants
27 Ly, H. (2002) Effects of Natural Gas Composition Variations GPL et GNV. Euroforum.
on the Operation, Performance and Exhaust Emissions of
natural Gas-Powered Vehicles. IANGV. 31 Douaud, A. (2001) Quelles énergies pour l’automobile de
demain. SIA.
28 Livre Vert (2002)Vers une stratégie européenne de sécurité
d’approvisionnement énergétique. COM, 321. Final manuscript received in November 2005
Copyright © 2006 Institut français du pétrole
Permission to make digital or hard copies of part or all of this work for personal or classroom use is granted without fee provided that copies are not made
or distributed for profit or commercial advantage and that copies bear this notice and the full citation on the first page. Copyrights for components of this
work owned by others than IFP must be honored. Abstracting with credit is permitted. To copy otherwise, to republish, to post on servers, or to redistribute
to lists, requires prior specific permission and/or a fee: Request permission from Documentation, Institut français du pétrole, fax. +33 1 47 52 70 78,
or revueogst@ifp.fr.You can also read