NEPAL CLIMATE RISK COUNTRY PROFILE
←
→
Page content transcription
If your browser does not render page correctly, please read the page content below
CLIMATE RISK COUNTRY PROFILE

          NEPAL
COPYRIGHT
© 2021 by the World Bank Group
1818 H Street NW, Washington, DC 20433
Telephone: 202-473-1000; Internet: www.worldbank.org

© 2021 Asian Development Bank
6 ADB Avenue, Mandaluyong City, 1550 Metro Manila, Philippines
Tel +63 2 8632 4444; Fax +63 2 8636 2444
www.adb.org

This work is a product of the staff of the World Bank Group (WBG) and the Asian Development Bank (ADB) and with external
contributions. The opinions, findings, interpretations, and conclusions expressed in this work are those of the authors’ and do not
necessarily reflect the views or the official policy or position of the WBG, its Board of Executive Directors, or the governments
it represents or of ADB, its Board of Governors, or the governments they represent.

The WBG and ADB do not guarantee the accuracy of the data included in this work and do not make any warranty, express or
implied, nor assume any liability or responsibility for any consequence of their use. This publication follows the WBG’s practice
in references to member designations, borders, and maps. ADB, however, recognizes “China” as the People’s Republic of China.
The boundaries, colors, denominations, and other information shown on any map in this work, or the use of the term “country” do
not imply any judgment on the part of the WBG or ADB, their respective Boards, or the governments they represent, concerning
the legal status of any territory or geographic area or the endorsement or acceptance of such boundaries.

The mention of any specific companies or products of manufacturers does not imply that they are endorsed or recommended
by either the WBG or ADB in preference to others of a similar nature that are not mentioned.

RIGHTS AND PERMISSIONS
The material in this work is subject to copyright. Because the WB and ADB encourage dissemination of their knowledge, this
work may be reproduced, in whole or in part, for noncommercial purposes as long as full attribution to this work is given. This
work is licensed under the Creative Commons Attribution-NonCommercial 3.0 IGO License. To view a copy of this license, visit
http://creativecommons.org/licenses/by-nc/3.0/igo/ or send a letter to Creative Commons, PO Box 1866, Mountain View,
CA 94042, USA.

This CC license does not apply to WBG or non-ADB copyright materials in this publication. If the material is attributed to another
source, please contact the copyright owner or publisher of that source for permission to reproduce it. WBG or ADB cannot be
held liable for any claims that arise as a result of your use of the material.

Please cite the work as follows: Climate Risk Country Profile: Nepal (2021): The World Bank Group and the Asian Development
Bank.

Any queries on rights and licenses, including subsidiary rights, should be addressed to World Bank Publications, The World Bank
Group, 1818 H Street NW, Washington, DC 20433, USA; fax: 202-522-2625; e-mail: pubrights@worldbank.org.

Cover Photos: © Simone D. McCourtier/World Bank, “Women carry bundles through field in Kaski, Nepal” February 1, 2009 via
Flickr, Creative Commons CC BY-NC-ND 2.0. © Simone D. McCourtier/World Bank, “Rooftops in Nepal” January 31, 2009 via
Flickr, Creative Commons CC BY-NCND 2.0.

Graphic Design: Circle Graphics, Reisterstown, MD

CLIMATE RISK COUNTRY PROFILE: NEPAL                                                                                              ii
ACKNOWLEDGEMENTS
This profile is part of a series of Climate Risk Country Profiles that are jointly developed by the World Bank Group (WBG) and the
Asian Development Bank (ADB). These profiles synthesize the most relevant data and information on climate change, disaster
risk reduction, and adaptation actions and policies at the country level. The profile is designed as a quick reference source for
development practitioners to better integrate climate resilience in development planning and policy making. This effort is co-led
by Veronique Morin (Senior Climate Change Specialist, WBG), Ana E. Bucher (Senior Climate Change Specialist, WBG) and
Arghya Sinha Roy (Senior Climate Change Specialist, ADB).

This profile was written by Alex Chapman (Consultant, ADB), William Davies (Consultant, ADB) and Ciaran Downey (Consultant).
Technical review of the profiles was undertaken by Robert L. Wilby (Loughborough University). Additional support was provided
by MacKenzie Dove (Senior Climate Change Consultant, WBG), Yunziyi Lang (Climate Change Analyst, WBG), Jason Johnston
(Operations Analyst, WBG), Adele Casorla-Castillo (Consultant, ADB), and Charles Rodgers (Consultant, ADB). This profile
also benefitted from inputs of WBG and ADB regional staff and country teams.

Climate and climate-related information is largely drawn from the Climate Change Knowledge Portal (CCKP), a WBG online
platform with available global climate data and analysis based on the latest Intergovernmental Panel on Climate Change (IPCC)
reports and datasets. The team is grateful for all comments and suggestions received from the sector, regional, and country
development specialists, as well as climate research scientists and institutions for their advice and guidance on use of climate
related datasets.

CLIMATE RISK COUNTRY PROFILE: NEPAL                                                                                            iii
CONTENTS

FOREWORD  .  .  .  .  .  .  .  .  .  .  .  .  .  .  .  .  .  .  .  .  .  .  .  .  .  .  .  .  .  .  .  .  .  .  .  . 1

KEY MESSAGES .   .   .   .   .   .   .   .   .   .   .   .   .   .   .   .   .   .   .   .   .   .   .   .   .   .   .   .   .   .   .   .   .   .  2

COUNTRY OVERVIEW .   .   .   .   .   .   .   .   .   .   .   .   .   .   .   .   .   .   .   .   .   .   .   .   .   .   .   .   .   .   .  2

CLIMATOLOGY  .   .   .   .   .   .   .   .   .   .   .   .   .   .   .   .   .   .   .   .   .   .   .   .   .   .   .   .   .   .   .   .   .   .   5
   Climate Baseline .  .  .  .  .  .  .  .  .  .  .  .  .  .  .  .  .  .  .  .  .  .  .  .  .  .  .  .  .  .  .  .  .  .  .  .  .  .  .  .           5
      Overview  .  .  .  .  .  .  .  .  .  .  .  .  .  .  .  .  .  .  .  .  .  .  .  .  .  .  .  .  .  .  .  .  .  .  .  .  .  .  .  .  .  .         5
      Key Trends .  .  .  .  .  .  .  .  .  .  .  .  .  .  .  .  .  .  .  .  .  .  .  .  .  .  .  .  .  .  .  .  .  .  .  .  .  .  .  .  .           6
   Climate Future .  .  .  .  .  .  .  .  .  .  .  .  .  .  .  .  .  .  .  .  .  .  .  .  .  .  .  .  .  .  .  .  .  .  .  .  .  .  .  .  .          7
      Overview  .  .  .  .  .  .  .  .  .  .  .  .  .  .  .  .  .  .  .  .  .  .  .  .  .  .  .  .  .  .  .  .  .  .  .  .  .  .  .  .  .  .         7

CLIMATE RELATED NATURAL HAZARDS .   .   .   .   .   .   .   .   .   .   .   .   .   .   .   .   .   .   .   .   .   . 11
       Heatwaves and Cold Waves  .  .  .  .  .  .  .  .  .  .  .  .  .  .  .  .  .  .  .  .  .  .  .  .  .  .  .  .  .  .  .  .  . 12
       Drought  .  .  .  .  .  .  .  .  .  .  .  .  .  .  .  .  .  .  .  .  .  .  .  .  .  .  .  .  .  .  .  .  .  .  .  .  .  .  .  .  .  . 12
       Flood .  .  .  .  .  .  .  .  .  .  .  .  .  .  .  .  .  .  .  .  .  .  .  .  .  .  .  .  .  .  .  .  .  .  .  .  .  .  .  .  .  .  .  . 13

CLIMATE CHANGE IMPACTS .   .   .   .   .   .   .   .   .   .   .   .   .   .   .   .   .   .   .   .   .   .   .   .   .   .   .   . 14
   Natural Resources  .  .  .  .  .  .  .  .  .  .  .  .  .  .  .  .  .  .  .  .  .  .  .  .  .  .  .  .  .  .  .  .  .  .  .  .  .  .  . 14
     Water .  .  .  .  .  .  .  .  .  .  .  .  .  .  .  .  .  .  .  .  .  .  .  .  .  .  .  .  .  .  .  .  .  .  .  .  .  .  .  .  .  .  . 14
     Forests and Biodiversity .  .  .  .  .  .  .  .  .  .  .  .  .  .  .  .  .  .  .  .  .  .  .  .  .  .  .  .  .  .  .  .  .  .  . 15
   Economic Sectors  .  .  .  .  .  .  .  .  .  .  .  .  .  .  .  .  .  .  .  .  .  .  .  .  .  .  .  .  .  .  .  .  .  .  .  .  .  .  . 16
     Agriculture .  .  .  .  .  .  .  .  .  .  .  .  .  .  .  .  .  .  .  .  .  .  .  .  .  .  .  .  .  .  .  .  .  .  .  .  .  .  .  .  . 16
     Urban .  .  .  .  .  .  .  .  .  .  .  .  .  .  .  .  .  .  .  .  .  .  .  .  .  .  .  .  .  .  .  .  .  .  .  .  .  .  .  .  .  .  . 17
   Communities  .  .  .  .  .  .  .  .  .  .  .  .  .  .  .  .  .  .  .  .  .  .  .  .  .  .  .  .  .  .  .  .  .  .  .  .  .  .  .  .  . 19
     Poverty, Inequality and Disaster Vulnerability  .  .  .  .  .  .  .  .  .  .  .  .  .  .  .  .  .  .  .  .  .  .  .  .  . 19
     Human Health .  .  .  .  .  .  .  .  .  .  .  .  .  .  .  .  .  .  .  .  .  .  .  .  .  .  .  .  .  .  .  .  .  .  .  .  .  .  . 20

POLICIES AND PROGRAMS  .   .   .   .   .   .   .   .   .   .   .   .   .   .   .   .   .   .   .   .   .   .   .   .   .   .   .   . 22
   National Adaptation Policies and Plans .  .  .  .  .  .  .  .  .  .  .  .  .  .  .  .  .  .  .  .  .  .  .  .  .  .  .  .  .                      22
   Climate Change Priorities of ADB and the WBG  .  .  .  .  .  .  .  .  .  .  .  .  .  .  .  .  .  .  .  .  .  .  .  .  .                           22
      ADB – Country Partnership Strategy .  .  .  .  .  .  .  .  .  .  .  .  .  .  .  .  .  .  .  .  .  .  .  .  .  .  .  .  .                       22
      WBG – Country Partnership Framework .  .  .  .  .  .  .  .  .  .  .  .  .  .  .  .  .  .  .  .  .  .  .  .  .  .  .                            22

CLIMATE RISK COUNTRY PROFILE: NEPAL                                                                                                                  iv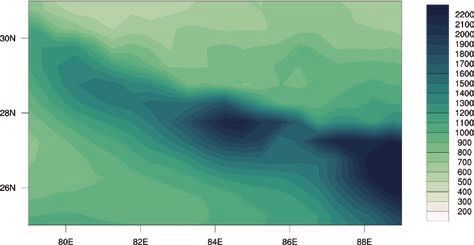
FOREWORD

Climate change is a major risk to good development outcomes, and the World Bank Group is committed to playing an important
role in helping countries integrate climate action into their core development agendas. The World Bank Group (WBG) and
the Asian Development Bank (ADB) are committed to supporting client countries to invest in and build a low-carbon,
climate-resilient future, helping them to be better prepared to adapt to current and future climate impacts.

Both institutions are investing in incorporating and systematically managing climate risks in development operations through
their individual corporate commitments.

For the World Bank Group: a key aspect of the World Bank Group’s Action Plan on Adaptation and Resilience (2019) is to help
countries shift from addressing adaptation as an incremental cost and isolated investment to systematically incorporating climate
risks and opportunities at every phase of policy planning, investment design, implementation and evaluation of development
outcomes. For all International Development Association and International Bank for Reconstruction and Development operations,
climate and disaster risk screening is one of the mandatory corporate climate commitments. This is supported by the World
Bank Group’s Climate and Disaster Risk Screening Tool which enables all Bank staff to assess short- and long-term climate
and disaster risks in operations and national or sectoral planning processes. This screening tool draws up-to-date and relevant
information from the World Bank’s Climate Change Knowledge Portal, a comprehensive online ‘one stop shop’ for global,
regional, and country data related to climate change and development.

For the Asian Development Bank: its Strategy 2030 identified “tackling climate change, building climate and disaster resilience,
and enhancing environmental sustainability” as one of its seven operational priorities. Its Climate Change Operational
Framework 2017–2030 identified mainstreaming climate considerations into corporate strategies and policies, sector and
thematic operational plans, country programming, and project design, implementation, monitoring, and evaluation of climate
change considerations as the foremost institutional measure to deliver its commitments under Strategy 2030. ADB’s climate
risk management framework requires all projects to undergo climate risk screening at the concept stage and full climate risk
and adaptation assessments for projects with medium to high risk.

Recognizing the value of consistent, easy-to-use technical resources for our common client countries as well as to support
respective internal climate risk assessment and adaptation planning processes, the World Bank Group’s Climate Change Group
and ADB’s Sustainable Development and Climate Change Department have worked together to develop this content. Standardizing
and pooling expertise facilitates each institution in conducting initial assessments of climate risks and opportunities across sectors
within a country, within institutional portfolios across regions, and acts as a global resource for development practitioners.

For common client countries, these profiles are intended to serve as public goods to facilitate upstream country diagnostics,
policy dialogue, and strategic planning by providing comprehensive overviews of trends and projected changes in key climate
parameters, sector-specific implications, relevant policies and programs, adaptation priorities and opportunities for further actions.

We hope that this combined effort from our institutions will spur deepening of long-term risk management in our client countries
and support further cooperation at the operational level.

Bernice Van Bronkhorst                            Preety Bhandari
Global Director                                   Chief of Climate Change and Disaster Risk Management Thematic Group
Climate Change Group                              concurrently Director Climate Change and Disaster Risk Management Division
The World Bank Group                              Sustainable Development and Climate Change Department
                                                  Asian Development Bank

CLIMATE RISK COUNTRY PROFILE: NEPAL                                                                                                 1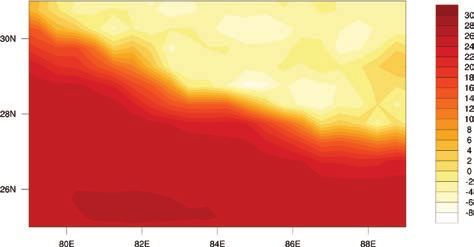
KEY MESSAGES

•     Warming in Nepal is projected to be higher than the global average. By the 2080s, Nepal is projected to
      warm by 1.2°C–4.2°C, under the highest emission scenario, RCP8.5, as compared to the baseline period
      1986–2005. The range in possible temperature rises highlights the significantly lower rates of warming
      expected on lower 21st century emissions pathways.
•     Rises in maximum and minimum temperatures are expected to be stronger than the rise in average temperature,
      likely amplifying the pressure on human health, livelihoods, and ecosystems. Temperature increase is expected
      to be strongest during the winter months.
•     Climate change is already having significant impacts on the environment in Nepal, species’ ranges are shifting
      to higher altitudes, glaciers are melting, and the frequency of precipitation extremes is increasing.
•     Natural hazards such as drought, heatwave, river flooding, and glacial lake outburst flooding are all projected
      to intensify over the 21st century, potentially exacerbating disaster risk levels and putting human life at risk.
•     Modelling has suggested that the number of people annually affected by river flooding could more than double
      by 2030 as a result of climate change. At the same time the economic impact of river flooding could triple.
•     The vulnerability of Nepal’s communities, particularly those living in poverty, in remote areas, and operating
      subsistence agriculture, increases the risk posed by climate change.
•     Some important adaptation approaches, such as air conditioning, irrigation, water storage and new crop
      varieties, may be inaccessible to these communities, and even with adaptation they are likely to experience
      damage and loss. Without support to the poorest in Nepalese society inequalities are likely to widen.

COUNTRY OVERVIEW

N
         epal is a landlocked country of South Asia, located in the Himalayas between India and China.
         The terrain is generally mountainous and contains many of the world’s highest peaks, including Mount
         Everest (8,848 meters [m]). The country also has low-lying areas in the south with elevations less
than 100 m. About 80% of the country’s 28 million inhabitants (2019) live in rural areas. Small-scale, subsistence
agriculture is a mainstay of Nepal’s economy, employing 69% of the country’s workforce in 2015. Despite this,
agriculture contributed only 25% to GDP in 2019, compared to a 60% contribution from the service sector.1
Nepal’s National Planning Commission estimated in 2018 that around 28.6% of the population experiences
multidimensional poverty,2 with a clear divide between rural areas, where the rate is 33%, and urban areas where the
rate is 7%. An estimated 8% of Nepal’s population are undernourished (see key indicators in Table 1).

1
    World Bank (2020). DataBank – World Development Indicators. URL: https://databank.worldbank.org/source/world-development-
    indicators [accessed 19 September 2020].
2
    NPC (2018). Nepal Multidimensional Poverty Index 2018: Analysis Towards Action. National Planning Commission, Government of
    Nepal. URL: https://www.npc.gov.np/images/category/Nepal_MPI.pdf

CLIMATE RISK COUNTRY PROFILE: NEPAL                                                                                           2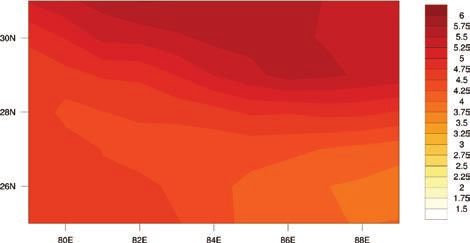
Water and forests are Nepal’s most abundant natural resources, with freshwater (derived from glaciers, snowmelt,
and rainfall) accounting for an estimated 2.27% of the total world supply. This water feeds the country’s
major rivers: Koshi, Gandaki, and Karnali. Together, these river systems supply freshwater to a large portion of
the 500 million people who live in the Ganges river basin. Nepal’s varied topography and social vulnerability
make the country particularly susceptible to geological and climate-related disasters. Weakness in effective
response mechanisms and strategies for dealing with natural hazards has historically exacerbated this vulnerability.
An increase in soil erosion, landslides, flash floods, and droughts has been reported in recent years across the
country, with increased intensity and impact on the lives and livelihoods of the Nepalese. Nepal is highly vulnerable
to climate change impacts and recent studies by the Asian Development Bank suggested Nepal faces losing
2.2% of annual GDP due to climate change by 2050.3 Nepal ratified the Paris Climate Agreement and its
Second Nationally Determined Communication (NDC) in 2020.4 Nepal’s Second National Communication to the
UNFCCC (2014) (NC2) identifies the country’s energy, agriculture, water resources, forestry and biodiversity and
health sectors as the most at risk to climate change.5

TABLE 1. Key indicators

     Indicator                                               Value                         Source
     Population Undernourished       6                       6.1% (2017–2019)              FAO, 2020
     National Poverty Rate7                                  28.6% (2018)                  National Planning Commission, 2020
     Share of Wealth Held by Bottom 20%                      8.3% (2010)                   World Bank, 2018
     Net Annual Migration Rate   8                           0.15% (2015–2020)             UNDESA, 2019
     Average Annual Change in Urban Population           9   3.15% (2015–2020)             UNDESA, 2018
     Dependents per 100 Independent Adults          10       53.0 (2020)                   UNDESA, 2019
     Urban Population as % of Total Population11             20.6% (2020)                  CIA, 2020
     External Debt Ratio to GNI   12                         18.9% (2018)                  ADB, 2020b
     Government Expenditure Ratio to GDP       12            27.5% (2017)                  ADB, 2020b

3
      Ahmed, M., & S. Suphachalasai (2014). Assessing the costs of climate change and adaptation in South Asia. Asian Development
      Bank. URL: https://www.adb.org/sites/default/files/publication/42811/assessing-costs-climate-change-and-adaptation-south-
      asia.pdf
4
      Government of Nepal (2020). Second Nationally Determined Contributions. URL: https://www4.unfccc.int/sites/ndcstaging/
      PublishedDocuments/Nepal%20Second/Second%20Nationally%20Determined%20Contribution%20(NDC)%20-%202020.pdf
5
      Nepal (2014). Second National Communications to the United Nations Framework Convention on Climate Change. URL: https://
      unfccc.int/sites/default/files/resource/nplnc2.pdf
6
      FAO, IFAD, UNICEF, WFP, WHO (2020). The state of food security and nutrition in the world. Transforming food systems for
      affordable healthy diets. FAO. Rome. URL: http://www.fao.org/documents/card/en/c/ca9692en/
7
      National Planning Commission (2020). Nepal Human Development Report 2020. URL: https://www.npc.gov.np/images/category/
      NHDR_2020_-_Final_-_TheSquare_compressed_final1.pdf [accessed 14/01/21]
8
      UNDESA (2019). World Population Prospects 2019: MIGR/1. URL: https://population.un.org/wpp/Download/Standard/Population/
      [accessed 17/12/20]
9
      UNDESA (2019). World Urbanization Prospects 2018. URL: https://population.un.org/wup/Download/ [accessed 28/11/18]
10
      UNDESA (2019). World Population Prospects 2019: POP/11-A. URL: https://population.un.org/wpp/Download/Standard/Population/
      [accessed 17/12/20]
11
      CIA (2020), The World Factbook. Central Intelligence Agency. Washington DC. URL: https://www.cia.gov/the-world-factbook/
12
      ADB (2020b). Key Indicators for Asia and the Pacific 2020. Asian Development Bank. URL: https://www.adb.org/publications/key-
      indicators-asia-and-pacific-2020

CLIMATE RISK COUNTRY PROFILE: NEPAL                                                                                              3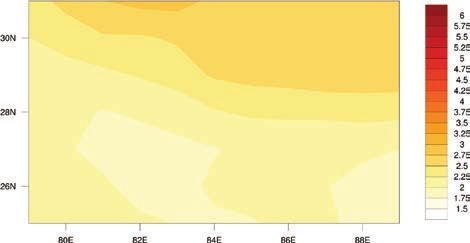
This document aims to succinctly summarize the climate risks faced by Nepal. This includes rapid onset and
long-term changes in key climate parameters, as well as impacts of these changes on communities, livelihoods
and economies, many of which are already underway. This is a high-level synthesis of existing research and
analyses, focusing on the geographic domain of Nepal, therefore potentially excluding some international influences
and localized impacts. The core data presented is sourced from the database sitting behind the World Bank
Group’s Climate Change Knowledge Portal (CCKP), incorporating climate projections from the Coupled Model
Inter-comparison Project Phase 5 (CMIP5). This document is primarily meant for WBG and ADB staff to inform
their climate actions. The document also aims and to direct the reader to many useful sources of secondary data
and research.

Due to a combination of political, geographic, and
social factors, Nepal is recognized as vulnerable                      FIGURE 1. The ND-GAIN Index summarizes a
to climate change impacts, ranked 128th out of                         country’s vulnerability to climate change and
181 countries in the 2020 ND-GAIN Index.13 The                         other global challenges in combination with its
ND-GAIN Index ranks 181 countries using a                              readiness to improve resilience. It aims to help
score which calculates a country’s vulnerability                       businesses and the public sector better prioritize
to climate change and other global challenges as                       investments for a more efficient response to the
well as their readiness to improve resilience. The                     immediate global challenges ahead.
more vulnerable a country is the lower their score,                           46

while the more ready a country is to improve its
                                                                              45
resilience the higher it will be. Norway has the
highest score and is ranked 1st. Figure 1 is a                                44

time-series plot of the ND-GAIN Index showing
                                                                      Score

                                                                              43
Nepal’s progress
                                                                              42

                                                                              41

Green, Inclusive and                                                          40
                                                                                   1995 1997 1999 2001 2003 2005 2007 2009 2011 2013

Resilient Recovery                                                                    Nepal

The coronavirus disease (COVID-19) pandemic has
led to unprecedented adverse social and economic
impacts. Further, the pandemic has demonstrated the compounding impacts of adding yet another shock on top
of the multiple challenges that vulnerable populations already face in day-to-day life, with the potential to create
devastating health, social, economic and environmental crises that can leave a deep, long-lasting mark. However,
as governments take urgent action and lay the foundations for their financial, economic, and social recovery, they
have a unique opportunity to create economies that are more sustainable, inclusive and resilient. Short and long-
term recovery efforts should prioritize investments that boost jobs and economic activity; have positive impacts on
human, social and natural capital; protect biodiversity and ecosystems services; boost resilience; and advance the
decarbonization of economies.

13
     University of Notre Dame (2020). Notre Dame Global Adaptation Initiative. URL: https://gain.nd.edu/our-work/country-index/

CLIMATE RISK COUNTRY PROFILE: NEPAL                                                                                                    4
CLIMATOLOGY
Climate Baseline
Overview
Nepal’s climate varies considerably both seasonally (Figure 2) and according to altitude. Nepal can be divided
into different climate zones according to altitude, ranging from the Terai region in the south at less than 500 m
above sea-level to the High Himalayan region in the north at over 5,000 m. Average temperatures decline from
a peak of over 24°C in the south down to sub-zero temperatures in Nepal’s highest mountains. Precipitation is
spatially variable with some central and northerly pockets of the country receiving more than 3,000 millimeters
(mm), the central and southern plains typically receiving 1,500–2,000 mm, and some high-altitude areas in the
north receiving less than 1,000 mm. Figure 3 shows the spatial variations of observed temperature and rainfall
across Nepal.
Annual Cycle
FIGURE 2. Average monthly temperature and rainfall in Nepal (1991–2020)14
36 360
Temperature (°C)
24 240
Rainfall (mm)
12 120
0 0
Jan Feb Mar Apr May Jun Jul Aug Sep Oct Nov Dec
Rainfall Temperature
14
WBG Climate Change Knowledge Portal (CCKP, 2021). Nepal Climate Data: Historical. URL: https://climateknowledgeportal.
worldbank.org/country/nepal/climate-data-historical
CLIMATE RISK COUNTRY PROFILE: NEPAL 5Spatial Variations
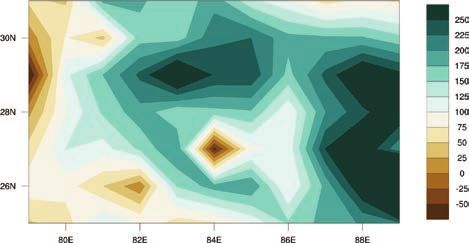
FIGURE 3. (Left) Annual Mean Temperature, and (Right) Annual Mean Rainfall (mm) in
Nepal over the period 1991–2020.15 Maps present the coordinates of Nepal: latitude 80°03’42”E –
88°10’10”E and 30°26’12”N – 26°21’46”N.
Key Trends
Temperature
Data from the Berkeley Earth Dataset can be used to estimate warming across Nepal over the 20th century.
Based on temperature changes between the periods 1900–1917 and 2000–2017 historical warming in Nepal is
estimated at between 1.0°C–1.3°C. Nepal’s NC2 suggests that the spatial distribution of this warming is complex,
and not homogenous across Nepal’s surface area, nor defined consistently by altitude.16 Additional studies, which
focused specifically on the Himalayas region (a significantly larger area than Nepal’s national territory) reports
higher rates of warming, with average temperatures increasing by 1.5°C between 1982–2006.17
Precipitation
Nepal’s NC2 suggests there have been only minor changes to historical annual precipitation rates in the country
and these vary spatially and include both positive and negative movements. Some regions (notably western Nepal)
are believed to have experienced an increase in the frequency and intensity of extreme precipitation events.18
One study has suggested that wet areas are becoming wetter, and dry areas are becoming drier.19 Alongside this,
another study suggested the Himalayan region has experienced increasing average annual precipitation at a rate
of 6.5mm/yr between 1982–2006.11 Other factors affecting inter-annual precipitation variability include global
climate phenomena such as El Niño-Southern Oscillation (ENSO) and the Indian Ocean Dipole.20 ENSO has been
shown to have complex relationships with both drought and extreme precipitation.12
15
WBG Climate Change Knowledge Portal (CCKP, 2021). Nepal Climate Data: Projections. URL: https://climateknowledgeportal.
worldbank.org/country/nepal/climate-data-projections
16
Nepal (2014). Second National Communications to the United Nations Framework Convention on Climate Change. URL: https://
unfccc.int/sites/default/files/resource/nplnc2.pdf
17
Shrestha, U. B., Gautam, S., & Bawa, K. S. (2012). Widespread climate change in the Himalayas and associated changes in local
ecosystems. PloS One, 7(5), 1–10. URL: https://journals.plos.org/plosone/article?id=10.1371/journal.pone.0036741
18
Bohlinger, P., & Sorteberg, A. (2018). A comprehensive view on trends in extreme precipitation in Nepal and their spatial distribution.
International Journal of Climatology, 38(4), 1833–1845. URL: https://rmets.onlinelibrary.wiley.com/doi/abs/10.1002/joc.5299
19
Dahal, P., Shrestha, N. S., Shrestha, M. L., Krakauer, N. Y., Panthi, J., Pradhanang, S. M., . . . Lakhankar, T. (2016). Drought risk
assessment in central Nepal: temporal and spatial analysis. Natural Hazards, 80(3), 1913–1932. URL: https://link.springer.com/
article/10.1007/s11069-015-2055-5
20
Sigdel, M., & Ikeda, M. (2011). Spatial and Temporal Analysis of Drought in Nepal using Standardized Precipitation Index and its Relationship
with Climate Indices. Journal of Hydrology and Meteorology, 7(1), 59–74. URL: https://www.nepjol.info/index.php/JHM/article/view/5617
CLIMATE RISK COUNTRY PROFILE: NEPAL 6A Precautionary Approach
Climate Future
Studies published since the last iteration Overview
of the IPCC’s report (AR5), such as Gasser The main data source for the World Bank Group’s Climate
et al. (2018), have presented evidence which Change Knowledge Portal (CCKP) is the Coupled Model
suggests a greater probability that earth willInter-comparison Project Phase 5 (CMIP5) models,
experience medium and high-end warming which are utilized within the Fifth Assessment Report
scenarios than previously estimated.21 Climate(AR5) of the Intergovernmental Panel on Climate Change
change projections associated with the (IPCC), providing estimates of future temperature
highest emissions pathway (RCP8.5) are and precipitation. Four Representative Concentration
presented here to facilitate decision making Pathways (i.e. RCP2.6, RCP4.5, RCP6.0, and RCP8.5)
which is robust to these risks. were selected and defined by their total radiative forcing
(cumulative measure of GHG emissions from all sources)
pathway and level by 2100. In this analysis, RCP2.6
and RCP8.5, the extremes of low and high emissions pathways, are the primary focus where RCP2.6 represents
a very strong mitigation scenario and RCP8.5 assumes business-as-usual scenario. For more information, please
refer to the RCP Database.
For Nepal, these models show a trend of consistent warming that will be more significant for northern regions.
While rainfall projections are less certain and vary by both RCP scenario as well as models, projected precipitation
trends show a decrease in rainfall in the 2050s and an increase in rainfall for the 2090s. More precipitation is
expected to be received through increased intensity and occurrence of extreme events. Tables 2 and 3 below,
TABLE 2. Projected anomaly (changes oC) for maximum, minimum, and average daily temperatures
in Nepal for 2040–2059 and 2080–2099, from the reference period of 1986–2005 for all RCPs. The
table is showing the median of the CCKP model ensemble and the 10–90th percentiles in brackets22
Average Daily Maximum Average Daily Minimum
Temperature Average Daily Temperature Temperature
Scenario 2040–2059 2080–2099 2040–2059 2080–2099 2040–2059 2080–2099
RCP2.6 1.4 1.4 1.4 1.4 1.4 1.4
(−0.7, 3.4) (−0.6, 3.6) (−0.3, 3.1) (0.2, 3.2) (−0.4, 3.5) (−0.5, 3.5)
RCP4.5 1.8 2.5 1.7 2.5 1.7 2.5
(−0.4, 3.9) (0.3, 5.0) (−0.1, 3.4) (0.6, 4.4) (−0.1, 3.8) (0.6, 4.8)
RCP6.0 1.5 3.1 1.6 3.1 1.7 3.3
(−0.6, 3.7) (0.7, 5.5) (−0.1, 3.4) (1.2, 5.1) (0.2, 3.5) (1.2, 5.4)
RCP8.5 2.4 5.0 2.3 4.8 2.4 5.0
(0.1, 4.4) (2.5, 7.5) (0.6, 4.0) (2.9, 7.1) (0.6, 4.7) (2.9, 7.4)
21
Gasser, T., Kechiar, M., Ciais, P., Burke, E. J., Kleinen, T., Zhu, D., . . . Obersteiner, M. (2018). Path-dependent reductions in CO2
emission budgets caused by permafrost carbon release. Nature Geoscience. URL: http://pure.iiasa.ac.at/id/eprint/15453/
22
WBG Climate Change Knowledge Portal (CCKP, 2021). Nepal Climate Data: Projections. URL: https://climateknowledgeportal.
worldbank.org/country/nepal/climate-data-projections
CLIMATE RISK COUNTRY PROFILE: NEPAL 7TABLE 3. Projections of average temperature change (°C) in Nepal for different seasons
(3-monthly time slices) over different time horizons and emissions pathways, showing the median
estimates of the full CCKP model ensemble and the 10th and 90th percentiles in brackets.16
2040–2059 2080–2099
Scenario Jun–Aug Dec–Feb Jun–Aug Dec–Feb
RCP2.6 1.1 1.5 1.1 1.4
(−0.4, 3.3) (−0.3, 3.1) (−0.3, 3.5) (−0.3, 3.1)
RCP4.5 1.3 2.0 2.0 2.7
(−0.2, 3.6) (0.0, 3.4) (0.4, 4.6) (0.7, 4.6)
RCP6.0 1.2 1.9 2.4 3.6
(−0.3, 3.4) (−0.1, 3.3) (0.8, 4.9) (1.2, 5.3)
RCP8.5 1.9 2.6 4.1 5.2
(0.4, 4.0) (1.8, 4.2) (2.5, 6.7) (3.2, 7.6)
provide information on temperature projections and anomalies for the four RCPs over two distinct time horizons;
presented against the reference period of 1986–2005.
Climate projections presented in this document are derived from datasets available through the CCKP, unless
otherwise stated. These datasets are processed outputs of simulations performed by multiple General Circulation
Models (GCM) (for further information see Flato et al., 2013).23 Collectively, these different GCM simulations
are referred to as the ‘model ensemble’. Due to the differences in the way GCMs represent the key physical
processes and interactions within the climate system, projections of future climate conditions can vary widely
between different GCMs, this is particularly the case for rainfall related variables and at national and local scales.
The range of projections from 16 GCMs for annual average temperature change and annual precipitation change
in Nepal under RCP8.5 is shown in Figure 4. Spatial representation of future projections of annual temperature
and precipitation for mid and late century under RCP8.5 are presented in Figure 5.
FIGURE 4. ‘Projected average temperature 7
miroc_esm_chem
Average temperature anomaly ( °C)
anomaly’ and ‘projected annual rainfall anomaly’ 6
in Nepal. Outputs of 16 models within the 5 cesm1_cam5
ensemble simulating RCP8.5 over the period 4 fio_esm
2080–2099. Models shown represent the subset 3
of models within the ensemble which provide 2 Median,
10th and 90th
projections across all RCPs and therefore are 1 Percentiles
most robust for comparison. Three outlier 0
–20% –10% 0% 10% 20% 30% 40% 50%
models are labelled. Average annual precipitation anomaly (%)
23
Flato, G., Marotzke, J., Abiodun, B., Braconnot, P., Chou, S. C., Collins, W., . . . Rummukainen, M. (2013). Evaluation of Climate
Models. Climate Change 2013: The Physical Science Basis. Contribution of Working Group I to the Fifth Assessment Report of the
Intergovernmental Panel on Climate Change, 741–866. URL: http://www.climatechange2013.org/images/report/WG1AR5_ALL_
FINAL.pdf
CLIMATE RISK COUNTRY PROFILE: NEPAL 8Spatial Variation
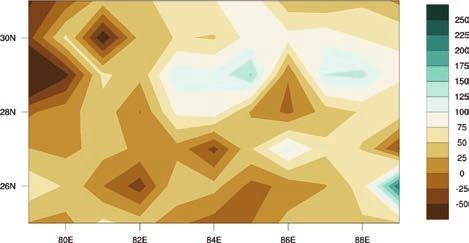
FIGURE 5. CMIP5 ensemble projected change (32 GCMs) in annual temperature (top) and precipitation
(bottom) by 2040–2059 (left) and by 2080–2090 (right) relative to 1986–2005 baseline under
RCP8.5.24 Maps present the coordinates of Nepal: latitude 80°03’42” E – 88°10’10” E and
30°26’12” N – 26°21’46” N.
Temperature
Projections of future temperature change are presented in three primary formats. Shown in Table 2 are the
changes in daily maximum and daily minimum temperatures over the given time period, as well as changes
in the average temperature. Figures 6 and 7 display the annual and monthly average temperature projections.
While similar, these three indicators can provide slightly different information. Monthly and annual average
temperatures are most commonly used for general estimation of climate change, but the daily maximum and
minimum can explain more about how daily life might change in a region, affecting key variables such as the viability
of ecosystems, health impacts, productivity of labor, and the yield of crops, which are often disproportionately
influenced by temperature extremes.
The model ensemble’s median estimate of warming over the 1986–2005 baseline in Nepal is significantly above
the global average. Under the highest emissions pathway (RCP8.5) warming in Nepal is projected to reach 5.0°C
by the 2090s. The lowest emissions pathway (RCP2.6) ensemble mean projects warming of 1.4°C by the 2040s,
followed by relatively constant temperatures up through the 2090s. Warming in monthly minimum and maximum
temperatures is projected to be higher still, with minimum temperatures in Nepal projected to rise by 5.0°C by
24
WBG Climate Change Knowledge Portal (CCKP, 2021). Nepal Climate Data: Projections. URL: https://climateknowledgeportal.
worldbank.org/country/nepal/climate-data-projections
CLIMATE RISK COUNTRY PROFILE: NEPAL 9the end of the 21st century under the highest emissions pathway. The CCKP model ensemble projects a
strong seasonal bias in temperature rises under higher emissions pathways, with warming strongest during the
winter and spring months from November through to May (Figure 7). This trend reflects the stronger projected
rise in minimum temperatures, which typically occur during the winter months. Spatial patterns in the warming
experienced in Nepal are likely to be heavily influenced by elevation. Global research suggests warming is happening
at a faster pace in higher altitude regions.25 This trend is seen in Nepal, where night time temperatures in Nepal’s
highest altitude areas (over 4,000 m) have been rising at almost double the rate of temperatures in lower altitude
(< 2,000 m) areas.26 However, the complexity presented by the extreme variations in altitude seen in Nepal and
the different processes which drive variation in warming (such as snow melt), may mean that model projections of
future temperature rise are subject to above average levels of uncertainty.27
FIGURE 6. Historic and projected average FIGURE 7. Projected change (°C) in monthly
annual temperature in Nepal under RCP2.6 temperature, shown by month, for Nepal
(blue) and RCP8.5 (red) estimated by the for the period 2080–2099 under RCP8.5.
model ensemble. Shading represents The value shown represents the median of
the standard deviation of the model the model ensemble with the shaded areas
ensemble.28 showing the 10th–90th percentiles.19
19 8
18
7
17
16 6
degreesC
15
degC
5
14
13 4
12
3
11
1980 2000 2020 2040 2060 2080 2100 2
Year Jan Feb Mar Apr May Jun Jul Aug Sep Oct Nov Dec
Historical RCP 2.6 RCP 4.5 RCP 6.0 RCP 8.5
Precipitation
The CCKP model ensemble provides minimal information on future changes in annual precipitation under
all emissions pathways (Figure 8). The median ensemble change typically shows a small increase in annual
precipitation, in the range of 5%–10% but uncertainty is very high and a minority of models also project
decreases (Figure 4). Downscaled (i.e. localized) analysis conducted on the previous ensemble of IPCC
25
Pepin, N., Bradley, R.S., Diaz, H.F., Baraër, M., Caceres, E.B., Forsythe, N., Fowler, H., Greenwood, G., Hashmi, M.Z., Liu, X.D. and Miller,
J.R. (2015). Elevation-dependent warming in mountain regions of the world. Nature Climate Change, 5(5), p.424. URL: https://www.
nature.com/articles/nclimate2563?proof=t
26
Zhao, W., He, J., Wu, Y., Xiong, D., Wen, F. and Li, A. (2019). An Analysis of Land Surface Temperature Trends in the
Central Himalayan Region Based on MODIS Products. Remote Sensing, 11(8), p.900. URL: https://www.researchgate.net/
publication/332401472_remote_sensing_An_Analysis_of_Land_Surface_Temperature_Trends_in_the_Central_Himalayan_Region_
Based_on_MODIS_Products
27
Revadekar, J.V., Hameed, S., Collins, D., Manton, M., Sheikh, M., Borgaonkar, H.P., Kothawale, D.R., Adnan, M., Ahmed, A.U., Ashraf, J.
and Baidya, S. (2013). Impact of altitude and latitude on changes in temperature extremes over South Asia during 1971–2000.
International Journal of Climatology, 33(1), pp.199–209. URL: https://rmets.onlinelibrary.wiley.com/doi/full/10.1002/joc.3418
28
WBG Climate Change Knowledge Portal (CCKP, 2021). Nepal Climate Data: Projections. URL: https://climateknowledgeportal.
worldbank.org/country/nepal/climate-data-projections
CLIMATE RISK COUNTRY PROFILE: NEPAL 10climate models (CMIP3) pointed towards moderate
increases in precipitation.29 While considerable FIGURE 8. Historical and projected average
uncertainty surrounds projections of local long- annual precipitation for Nepal in the period
term future precipitation trends, some global trends 2080–2099.19
are evident and likely to affect Nepal. The intensity 4500
of sub-daily extreme rainfall events appears to be 4000
3500
increasing with temperature, a finding supported by
3000
evidence from multiple regions of Asia.30 However,
mm
2500
as this phenomenon is highly dependent on local
2000
geographical contexts further research is required 1500
to constrain its localized impacts in Nepal. Future 1000
precipitation trends in Nepal will depend in part on 500
Historical RCP 2.6 RCP 4.5 RCP 6.0 RCP 8.5
how climate changes affect the ENSO phenomenon.
Simulation of ENSO, however, is an area in which
the CMIP5 set of models perform inconsistently.31
CLIMATE RELATED NATURAL HAZARDS
N
epal experiences significant disaster risk, ranked 31st on the 2019 INFORM Risk Index (Table 4).32
Key drivers of risk in Nepal include its high exposure to flood hazard as well as its lack of coping capacity.
Nepal also holds moderate exposure to drought hazard, and moderate levels of vulnerability. However,
the largest source of exposure-risk derives from earthquake. While not directly linked to climate change, earthquake
exposure remains relevant in the context of a changing climate. More precipitation and higher temperatures affect
TABLE 4. Selected indicators from the INFORM 2019 Index for Risk Management for Nepal.
For the sub-categories of risk (e.g. “Flood”) higher scores represent greater risks. Conversely the
most at-risk country is ranked 1st. The average score across all countries is shown in brackets.
Lack of Overall
Tropical Coping Inform
Cyclone Drought Vulnerability Capacity Risk Level
Flood (0–10) (0–10) (0–10) (0–10) (0–10) (0–10) Rank (1–191)
6.7 [4.5] 0.2 [1.7] 2.8 [3.2] 4.7 [3.6] 5.8 [4.5] 5.4 [3.8] 31
29
Sigdel, M. and Ma, Y. (2016). Evaluation of future precipitation scenario using statistical downscaling model over humid, subhumid,
and arid region of Nepal—a case study. Theoretical and applied climatology, 123(3–4), pp.453–460. URL: https://pubag.nal.usda.
gov/catalog/4802706
30
Westra, S., Fowler, H. J., Evans, J. P., Alexander, L. V., Berg, P., Johnson, F., Kendon, E. J., Lenderink, G., Roberts, N. (2014). Future
changes to the intensity and frequency of short-duration extreme rainfall. Reviews of Geophysics, 52, 522–555. URL: https://
agupubs.onlinelibrary.wiley.com/doi/full/10.1002/2014RG000464
31
Chen, C., Cane, M. A., Wittenberg, A. T., & Chen, D. (2017). ENSO in the CMIP5 Simulations: Life Cycles, Diversity, and Responses to
Climate Change. Journal of Climate, 30(2), 775–801. URL: https://journals.ametsoc.org/jcli/article/30/2/775/96236/ENSO-in-the-
CMIP5-Simulations-Life-Cycles
32
European Commission (2019). INFORM Index for Risk Management. Nepal Country Profile. URL:https://drmkc.jrc.ec.europa.eu/
inform-index/Countries/Country-Profile-Map
CLIMATE RISK COUNTRY PROFILE: NEPAL 11the stability of terrain and hence susceptibility to hazards from mudflows, avalanches, GLOFs and landslides that could
be triggered by an earthquake. Additionally, the risk of simultaneous, multi-hazard, exposure is significant,33 for
instance hydro-climatic hazards following an earthquake have been shown to compound damages.34
Heatwaves and Cold Waves
The current median probability of a heat wave (defined as a period of 3 or more days where the daily temperature
is above the long-term 95th percentile of daily mean temperature) in Nepal is around 3%. The median estimated
probability of cold wave also sits at around 3% (defined as a period of 3 or more days where the daily temperature
is below the long-term 5th percentile of daily mean temperature).
As shown in Figure 9, the probability of heatwave
is projected to increase significantly, potentially FIGURE 9. Projected change in the probability
as high as 27% by the 2090s under the highest of observing a heat wave in Nepal by
emissions pathway (RCP8.5). Simultaneously, the 2080–2099. A ‘Heat Wave’ is defined as
probability of cold wave is projected to decrease a period of 3 or more days where the daily
significantly, to less than 1% annually over the temperature is above the long-term
same time period. Both metrics reflect the projected 95th percentile of daily mean temperature.19
rise in temperatures, which constantly moves the 0.50
0.45
average away from the historical daily mean.
0.40
Nonetheless, the significant increase in the 0.35
daily probability
potential for extreme high temperatures, particularly 0.30
0.25
in Nepal’s more populous lower altitude region 0.20
demands both further research and disaster risk 0.15
0.10
reduction efforts. Another lens through which to 0.05
view the heat hazard is the annual maximum of 0
Historical RCP 2.6 RCP 4.5 RCP 6.0 RCP 8.5
daily maximum temperatures. The CCKP model
suggests this value could increase from a baseline
(1986–2005) of around 32°C, to almost 34°C by the 2030s (under all emissions pathways). Under RCP8.5 the
annual maximum of daily maximum temperatures could approach 38°C by the 2080s.
Drought
Two primary types of drought may affect Nepal, meteorological (usually associated with a precipitation deficit) and
hydrological (usually associated with a deficit in surface and subsurface water flow, potentially originating in the
region’s wider river basins). At present Nepal faces an annual median probability of severe meteorological drought
of around 2%, as defined by a standardized precipitation evaporation index (SPEI) of less than −2. There is some
evidence that drought frequency in Nepal increased between 1981–2012.35
33
Gill, J.C. and Malamud, B.D. (2017). Anthropogenic processes, natural hazards, and interactions in a multi-hazard framework.
Earth-Science Reviews, 166, 246–269. URL: https://www.sciencedirect.com/science/article/pii/S0012825216302227
34
Gautam, D. and Dong, Y. (2018). Multi-hazard vulnerability of structures and lifelines due to the 2015 Gorkha earthquake and 2017
central Nepal flash flood. Journal of Building Engineering, 17, pp.196–201. URL: http://ira.lib.polyu.edu.hk/handle/10397/77914
35
Dahal, P., Shrestha, N. S., Shrestha, M. L., Krakauer, N. Y., Panthi, J., Pradhanang, S. M., . . . Lakhankar, T. (2016). Drought risk
assessment in central Nepal: temporal and spatial analysis. Natural Hazards, 80(3), 1913–1932. URL: https://link.springer.com/
article/10.1007/s11069-015-2055-5
CLIMATE RISK COUNTRY PROFILE: NEPAL 12The climate model ensemble projects an increase
in drought probability over the 21st century FIGURE 10. Annual probability of experiencing
(Figure 10). The ensemble projects a median annual a ‘severe drought’ in Nepal (−2 SPEI index) in
drought probability of at least 10% by 2080–2099 2080–2099 under four emissions pathways.19
under all emission pathways. However, uncertainty 1.5
remains very high due to poor understanding of 1.0
future ENSO behavior. 0.5
unitless
0
–0.5
Flood –1.0
The World Resources Institute’s AQUEDUCT –1.5
Global Flood Analyzer36 can be used to establish –2.0
a baseline level of flood exposure. As of 2010, Historical RCP 2.6 RCP 4.5 RCP 6.0 RCP 8.5
assuming protection for up to a 1 in 10-year event,
the population annually affected by river flooding
in Nepal is estimated at 157,000 people and the expected annual impact on GDP is estimated at $218 million. This is
higher than that of UNISDR who placed a figure of $143 million on average annual losses to all types of flood in
2014.37 The difference in these values may be due to model errors and biases inherent in AQUEDUCT, however,
it may also relate to the underreporting of flood impacts –a known issue with the dataset underpinning UNSIDR’s
estimate. Economic development, population growth and climate change are likely to increase the impacts of river
flooding. The climate change component can be isolated and by 2030 is expected to increase the annually affected
population by 199,000 people, and the annual impact on GDP by $574 million under the RCP8.5 emissions pathway
(AQUEDUCT Scenario B). In both cases, the impact more than doubles over the 20-year reference period.
An increase in potential flooding impact is also projected by Paltan et al. (2018)38 who demonstrate that even under
lower emissions pathways coherent with the Paris Climate Agreement almost all Asian countries face an increase
in the frequency of extreme river flows.31 What would historically have been a 1 in 100-year flow, is projected to
become a 1 in 50-year or 1 in 25-year event in Nepal. There is good agreement among models on this trend.
This increased severity of extreme river floods can be seen in estimates by Willner et al. (2018)39 (Table 5) who
project that an additional 8,000–43,000 people will be affected by an extreme flood event by 2035–2044 as
a result of climate change.
Nepal also faces a growing hazard from glacier lake outburst floods (GLOFs). Nepal is believed to contain well over
1,000 glacier lakes. although most do not represent a threat to Nepalese communities. Lakes such as Phoksundo Tal,
Tsho Rolpa, Chamlang North Tsho, Chamlang South Tsho, and Lumding Tsho glacier lakes, could pose significant
disaster risk.40 Glacier lakes are believed to be rapidly forming in the Nepal region of the Himalayas as a result of
36
WRI (2018). AQUEDUCT Global Flood Analyzer. URL: https://floods.wri.org/# [Accessed: 22/11/2018]
37
UNISDR (2014). PreventionWeb: Basic country statistics and indicators. URL:https://www.preventionweb.net/countries [accessed
14/08/2018]
38
Paltan, H., Allen, M., Haustein, K., Fuldauer, L., & Dadson, S. (2018). Global implications of 1.5°C and 2°C warmer worlds on extreme
river flows Global implications of 1.5°C and 2°C warmer worlds on extreme river flows. Environmental Research Letters, 13.
URL: https://iopscience.iop.org/article/10.1088/1748-9326/aad985/meta
39
Willner, S., Levermann, A., Zhao, F., Frieler, K. (2018). Adaptation required to preserve future high-end river flood risk at present
levels. Science Advances: 4:1. URL: https://advances.sciencemag.org/content/4/1/eaao1914
40
Rounce, D. R., Watson, C. S., & McKinney, D. C. (2017). Identification of Hazard and Risk for Glacial Lakes in the Nepal Himalaya
Using Satellite Imagery from 2000–2015. Remote Sensing, 9(7). URL: https://www.mdpi.com/2072-4292/9/7/654
CLIMATE RISK COUNTRY PROFILE: NEPAL 13TABLE 5. Estimated number of people in Nepal affected by an extreme river flood (extreme flood
is defined as being in the 90th percentile in terms of numbers of people affected) in the historic
period 1971–2004 and the future period 2035–2044. Figures represent an average of all four
RCPs and assume present day population distributions.32
Population Exposed Population Exposed Increase in
to Extreme Flood to Extreme Flood Affected
Estimate (1971–2004) (2035–2044) Population
16.7 Percentile 350,844 358,940 8,096
Median 353,695 369,120 15,425
83.3 Percentile 356,916 400,498 43,582
glacier melting, with most of the existing lakes formed since the mid-20th century.41 When a moraine that holds
back the meltwater is breached, either as a result of climate or geological processes, significant flood surges
can result, causing major damage to downstream communities. This risk includes a potential interaction with the
significant earthquake hazard in Nepal. As increasing numbers of glacial lakes form, the risk of GLOFs during
earthquake events is also believed to be increasing.42 Potential impacts include loss of life and livelihoods, and
damage to infrastructure both as a result of flooding but also through the significant transport of sediment and
debris which can accompany GLOFs. Significant work is already underway in Nepal to mitigate the risk of disaster.
CLIMATE CHANGE IMPACTS
Natural Resources
Water
The future of the water resources sector in Nepal depends on the management of several key pressures: notably
local development, as well as hydrological climate changes and the future of Asia’s high mountain glaciers in a
warmer world. One study estimates that warming will result in the loss of between 36% to 64% of ice mass in
Asia’s high mountain glaciers by the end of the 21st century, with the higher end of the range associated with
higher emissions pathways.43 Glacial mass in the Himalayas over the coming decades will also depend on changes in
the level of snowfall and the intensity of precipitation during the monsoon season, although there is less certainty
among forecasts on the direction of this impact.44 Moreover, a recent high-resolution study of Himalayan glaciers
41
Haritashya, U. K., Kargel, J. S., Shugar, D. H., Leonard, G. J., Strattman, K., Watson, C. S., . . . Regmi, D. (2018). Evolution and
Controls of Large Glacial Lakes in the Nepal Himalaya. Remote Sensing, 10(5). URL: https://www.mdpi.com/2072-4292/10/5/798
42
Kargel, J. S., Leonard, G. J., Shugar, D. H., Haritashya, U. K., Bevington, A., Fielding, E. J., . . . Young, N. (2015). Geomorphic and geologic
controls of geohazards induced by Nepal’s 2015 Gorkha earthquake. Science, aac8353. URL: https://pubmed.ncbi.nlm.nih.gov/26676355/
43
Kraaijenbrink, P. D. A., Bierkens, M. F. P., Lutz, A. F., & Immerzeel, W. W. (2017). Impact of a global temperature rise of 1.5 degrees
Celsius on Asia’s glaciers. Nature, 549, 257. URL: https://pubmed.ncbi.nlm.nih.gov/28905897/
44
Bolch, T., Kulkarni, A., Kääb, A., Huggel, C., Paul, F., Cogley, J.G., Frey, H., Kargel, J.S., Fujita, K., Scheel, M. & Bajracharya, S.
(2012). The state and fate of Himalayan glaciers. Science, 336(6079), pp.310–314. URL: https://science.sciencemag.org/
content/336/6079/310/tab-figures-data
CLIMATE RISK COUNTRY PROFILE: NEPAL 14indicates that there is considerable localized variation in the impact of climate change on glacial mass, suggesting a
need for more localized forecasts for Nepalese glacier regions.45 A key impact of glacial melting is expected to be
the disruption of the historical runoff regime. One study projects both increasing runoff volume and extreme flows,
but only limited shifts in runoff seasonality in the Nepalese Himalayas as a result of climate change.46
These changes, along with natural hazards such as flood and drought will challenge an already vulnerable water
sector. As of 2015, only 88% of Nepal’s population had access to at least a basic water supply47 and access to
basic sanitation is believed to be even lower. World Bank data (2012) suggest that less than 60% of Nepal’s
population has access to basic sanitation, and that this is strongly biased towards higher income groups.48 Despite
a generally high national water supply, many Nepalese communities, particularly in rural and remote areas, are
vulnerable to water stress. Access to water for household use can be inconsistent, as can water availability for
small-scale hydropower,49 and agriculture remains a vital part of many households’ livelihoods and subsistence.
In particular, rain-fed agriculture remains prominent in Nepal and is likely to be vulnerable to changes in the local
precipitation regime. Many households are dependent on groundwater for subsistence and this too is under stress.
Research has documented springs drying up and communities having to dig deeper and travel further to access
water for consumption and basic household needs.50 Losses in groundwater are linked primarily to declines in
annual precipitation rates. Without action existing weaknesses in governance, which have failed to ensure equal
access and necessary infrastructure, may be exposed by the new challenges being presented by climate change.51
Forests and Biodiversity
Nepal is home to a wealth of biodiversity, many unique Himalayan ecosystems, and natural resources. As well as
their intrinsic value and the cultural value these assets hold to local communities, Nepal’s natural resources underpin
many sectors of the country’s economy. As of 2017 the World Travel and Tourism Council suggested tourism made
around an 8% total contribution to Nepal’s GDP and 7% total contribution to employment.52 Studies suggest
45
Bonekamp, P.N., de Kok, R.J., Collier, E. & Immerzeel, W.W. (2019). Contrasting meteorological drivers of the glacier mass
balance between the Karakoram and central Himalaya. Frontiers in Earth Science, 7, p.107. URL: https://www.frontiersin.org/
articles/10.3389/feart.2019.00107/full
46
Ragettli, S., Immerzeel, W. W., & Pellicciotti, F. (2016). Contrasting climate change impact on river flows from high-altitude
catchments in the Himalayan and Andes Mountains. Proceedings of the National Academy of Sciences, 113(33), 9222–9227.
URL: https://www.pnas.org/content/113/33/9222
47
Water Aid (2018). The State of the World’s Water 2018. URL: https://washmatters.wateraid.org/sites/g/files/jkxoof256/files/
The%20Water%20Gap%20State%20of%20Water%20report%20lr%20pages.pdf
48
Hallegatte, S., Bangalore, M., Bonzanigo, L., Fay, M., Kane, T., Narloch, U., Rozenberg, J., Treguer, D., and Vogt-Schilb, A.
(2016). Shock Waves: Managing the Impacts of Climate Change on Poverty. Climate Change and Development Series.
Washington, DC: World Bank. URL: https://openknowledge.worldbank.org/bitstream/handle/10986/22787/9781464806735.
pdf?sequence=13&isAllowed=y
49
McDowell, G., Ford, J. D., Lehner, B., Berrang-Ford, L., & Sherpa, A. (2013). Climate-related hydrological change and human
vulnerability in remote mountain regions: a case study from Khumbu, Nepal. Regional Environmental Change, 13(2), 299–310.
URL: https://link.springer.com/article/10.1007/s10113-012-0333-2
50
Poudel, D.D. and Duex, T.W. (2017). Vanishing springs in Nepalese mountains: Assessment of water sources, farmers’ perceptions,
and climate change adaptation. Mountain Research and Development, 37(1), pp.35–46. URL: https://bioone.org/journals/mountain-
research-and-development/volume-37/issue-1/MRD-JOURNAL-D-16-00039.1/Vanishing-Springs-in-Nepalese-Mountains—
Assessment-of-Water-Sources/10.1659/MRD-JOURNAL-D-16-00039.1.full
51
Biggs, E. M., Duncan, J. M. A., Atkinson, P. M., & Dash, J. (2013). Plenty of water, not enough strategy: How inadequate accessibility,
poor governance and a volatile government can tip the balance against ensuring water security: The case of Nepal. Environmental
Science & Policy, 33, 388–394. URL: https://research-repository.uwa.edu.au/en/publications/plenty-of-water-not-enough-
strategy-how-inadequate-accessibility-
52
World Travel and Tourism Council (2018). Travel and tourism economic impact 2018: Nepal. URL: https://wttc.org
CLIMATE RISK COUNTRY PROFILE: NEPAL 15You can also read