Neuroimaging of depression with diffuse optical tomography during repetitive transcranial magnetic stimulation - Nature
←
→
Page content transcription
If your browser does not render page correctly, please read the page content below
www.nature.com/scientificreports
OPEN Neuroimaging of depression
with diffuse optical tomography
during repetitive transcranial
magnetic stimulation
Shixie Jiang1, Jingyu Huang2, Hao Yang2, Ryan Wagoner1, F. Andrew Kozel1,3,
Glenn Currier1 & Huabei Jiang2*
Repetitive transcranial magnetic stimulation (rTMS) is an effective and safe treatment for depression;
however, its potential has likely been hindered due to non-optimized targeting, unclear ideal
stimulation parameters, and lack of information regarding how the brain is physiologically responding
during and after stimulation. While neuroimaging is ideal for obtaining such critical information,
existing modalities have been limited due to poor resolutions, along with significant noise interference
from the electromagnetic spectrum. In this study, we used a novel diffuse optical tomography (DOT)
device in order to advance our understanding of the neurophysiological effects of rTMS in depression.
Healthy and depressed subjects aged 18–70 were recruited. Treatment parameters were standardized
with targeting of the left dorsolateral prefrontal cortex with a magnetic field intensity of 100% of
motor threshold, pulse frequency of 10 per second, a 4 s stimulation time and a 26 s rest time. DOT
imaging was simultaneously acquired from the contralateral dorsolateral prefrontal cortex. Six
healthy and seven depressed subjects were included for final analysis. Hemoglobin changes and
volumetric three-dimensional activation patterns were successfully captured. Depressed subjects were
observed to have a delayed and less robust response to rTMS with a decreased volume of activation
compared to healthy subjects. In this first-in-human study, we demonstrated the ability of DOT to
safely and reliably capture and compare cortical response patterns to rTMS in depressed and healthy
subjects. We introduced this emerging optical functional imaging modality as a novel approach to
investigating targeting, new treatment parameters, and physiological effects of rTMS in depression.
Major depressive disorder is a chronic, recurrent, and debilitating mental health illness linked to significant
functional impairment, disability, and m ortality1. It is the primary cause of mental health-related disease bur-
den globally, affecting approximately 300 million individuals2. Although there have been numerous clinical
trials and studies on existing pharmacological and non-pharmacological options, its overall treatment is still
challenging3. The largest and most extensive trial, the Sequenced Treatment Alternatives to Relieve Depression
(STAR*D), revealed that antidepressants, even with augmentation, demonstrated suboptimal remission r ates4.
In lieu of medications then, a concerted effort has been dedicated to studying other treatment options, such as
brain stimulation techniques. Transcranial magnetic stimulation (TMS) has now been established over the past
decades as a safe and effective treatment for depression5.
Repetitive transcranial magnetic stimulation (TMS) was cleared by the Food and Drug Administration (FDA)
for the treatment of depression in 20086. When TMS is administered repeatedly at a specific frequency, it is
referred to as rTMS. It involves passing an electrical current through an insulated coil, which creates an alter-
nating magnetic field that penetrates the scalp and skull to induce neuronal depolarization and m odulation7.
Several landmark trials were conducted that reliably demonstrated its efficacy and safety in improving depressive
symptoms8–11. However, despite its increasing use, the average response and remission rates have been modest
at best. A previous meta-analysis of 29 studies and 1371 patients reported only a 29% average response rate
and 19% average remission rate in randomized t rials12. The effectiveness of TMS is likely reduced due to: (1)
1
Department of Psychiatry and Behavioral Neurosciences, University of South Florida, Tampa, FL,
USA. 2Department of Medical Engineering, University of South Florida, 4202 E. Fowler Avenue, ENG 030, Tampa,
FL, USA. 3Department of Behavioral Sciences and Social Medicine, Florida State University, Tallahassee, FL,
USA. 4These authors contributed equally: Shixie Jiang and Jingyu Huang. *email: hjiang1@usf.edu
Scientific Reports | (2021) 11:7328 | https://doi.org/10.1038/s41598-021-86751-9 1
Vol.:(0123456789)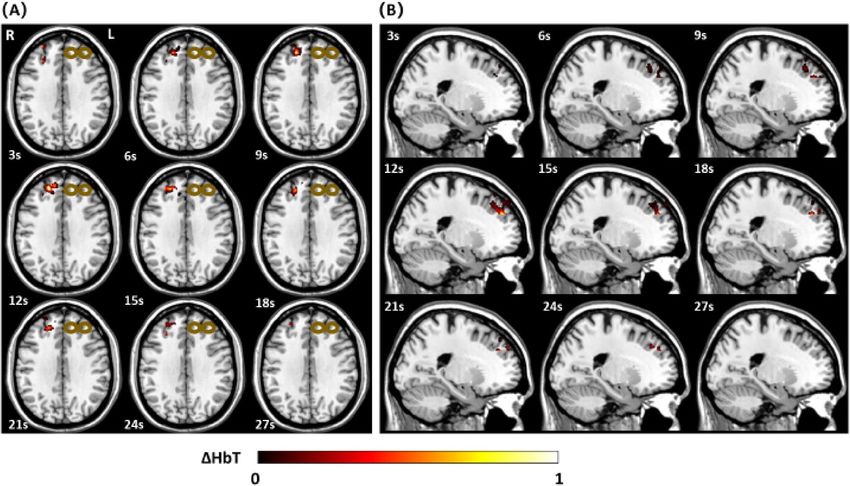
www.nature.com/scientificreports/
non-optimized targeting, (2) unclear ideal stimulation parameters (e.g., patterns, frequencies, dosage), and (3)
a lack of understanding of how the brain is physiologically responding, during and after, stimulation13. As such,
neuroimaging with rTMS has been a particularly promising area of research that has been pursued in order to
answer these questions.
Brain imaging is theoretically able to offer valuable information regarding the above unanswered questions
about improving TMS. However, due to the immediate brain changes that occur, only a few modalities possess
the temporal resolution required to appropriately evaluate such conditions. Prior studies on brain activation and
connectivity during TMS include the usage of functional magnetic resonance imaging (fMRI), magnetoencepha-
lography (MEG), electroencephalography (EEG), and functional near-infrared spectroscopy (fNIRS)14–17. As
fMRI, MEG, and EEG use signals that involve the electromagnetic spectrum, their overall resolution and qual-
ity are subject to significant measurement artifacts given the fact that TMS produces very strong magnetic and
electrical fields. Due to this, fNIRS has been investigated for concurrent imaging as it measures an optical signal,
which has no electromagnetic interference. It also has benefits of being portable, safe, cost-effective, and less
restrictive than other devices. However, fNIRS has several technical limitations including scalp interference, shal-
low imaging depth, low spatial resolution, and an inability to produce three-dimensional i mages18. Our proposed
solution to these problems involves a more novel neuroimaging technique called diffuse optical tomography.
Diffuse optical tomography (DOT) is an emerging noninvasive imaging modality based on the scatter-
ing and absorption properties of non-ionizing near-infrared light in biological tissue. It can be viewed as an
extension and improvement to fNIRS, similar to the distinction between magnetic resonance spectroscopy and
magnetic resonance imaging. Using multiple near-infrared wavelengths, it is able to accurately measure absolute
and relative deoxygenated ([Hb]), oxygenated ([HbO]), and total hemoglobin ([HbT]) concentrations. Most
pertinently, it combines multi-channel data acquisition with sophisticated image reconstruction algorithms to
produce quantitative three-dimensional images of changes in regional blood volume and oxygenation at high
temporal and spatial r esolutions19. It overcomes many of the limitations of fNIRS due to taking advantage of
multiple overlapping channels and a wider range of source-detector distances, along with inherently different
reconstruction algorithms. This allows DOT to distinguish between hemodynamic changes at different and
further depths and reduce interference from the scalp or s kull20. Over the past decades, it has been successfully
used clinically for imaging of epilepsy, breast cancer, osteoarthritis, and cortical a ctivations21–24. Impressively,
it has been demonstrated that DOT is able to detect hemodynamic responses equivalent to fMRI in terms of
spatial resolution (within a depth of 5 cm)25. Similar to fNIRS, it also possesses the benefits of being portable,
safe, and cost-effective.
The primary objective of this study was to introduce DOT as a safe, effective, and feasible option for conduct-
ing noninvasive, continuous functional imaging of the brain during and after rTMS in healthy and depressed
individuals. We hypothesized that rTMS would produce cortical activation patterns that would be reliably cap-
tured by DOT. In addition, we theorized that the hemodynamic changes, especially in terms of volume, between
healthy and depressed individuals may offer new insights into how neuroimaging can be further used to improve
TMS parameters and our understanding of the physiologic effects of brain stimulation.
Methods and materials
Study sample. Eligible subjects included individuals with no previous or current history of a psychiatric
disorder (healthy control group) and those with a current Diagnostic and Statistical Manual of Mental Disor-
ders, 5th Edition (DSM-5) diagnosis of major depressive disorder (depressed group) aged 18–70. Exclusionary
criteria for study participation included a previous history of psychosis, bipolar disorder, posttraumatic stress
disorder, eating disorder, or obsessive–compulsive disorder; pregnancy; personal or immediate family history of
a seizure disorder; presence of ferromagnetic material in the head, neurologic disorder, or medication capable of
altering the seizure threshold; vagus nerve stimulation implant; or history of electroconvulsive therapy failure.
The research protocol was approved by the University of South Florida Institutional Review Board. All meth-
ods, including those involving humans, were conducted in accordance to standard protocols mandated by the
Institutional Review Board. Informed written consent was appropriately obtained by each subject (depressed and
healthy) prior to enrollment in the study. Additional informed written consent was also completed by one sub-
ject for permission to publish their image in any hard-copy, online, and/or open-access journal article (Fig. 1b).
A physician screened participants with a Structured Clinical Interview for DSM-526, Transcranial Magnetic
Stimulation Adult Safety Screening Q uestionnaire27, a medical history review, and a physical exam. Routine
laboratory studies including a complete blood count, complete metabolic panel, thyroid stimulating hormone,
urine toxicology screen, urine pregnancy test (if the participant was a woman of child-bearing potential), and
electrocardiogram were obtained during the screening process. Subjects were required to be medically stable
before enrollment. All imaging and treatments were conducted in the same suite at the University of South
Florida Neurotherapies Clinic.
rTMS procedure. All rTMS treatments were performed with a Neurostar TMS Therapy System (Neuronet-
ics, Inc., Malvern, PA, USA). Stimulation protocol was followed per the product documentation. Subjects were
placed in a recliner and ear plugs were inserted to minimize possible hearing impairment from the TMS machine
noise. The location of the motor strip was estimated by stimulating the cortex at low frequency (1 Hz) and device
output (45%), advancing the power and repositioning the coil to elicit a reliable (5 out of 10 trials) muscle twitch
of the abductor pollicis brevis in the appropriate contralateral hand28. Using the TMS Motor Threshold Assess-
ment Tool, the motor threshold (MT) was determined four times and averaged29. Treatment parameters were
standardized for each individual at the left dorsolateral prefrontal cortex (DLPFC) (Neurostar standards; 5.5 cm
forward parasagitally from the identified point used to determine the MT) with a magnetic field intensity of
Scientific Reports | (2021) 11:7328 | https://doi.org/10.1038/s41598-021-86751-9 2
Vol:.(1234567890)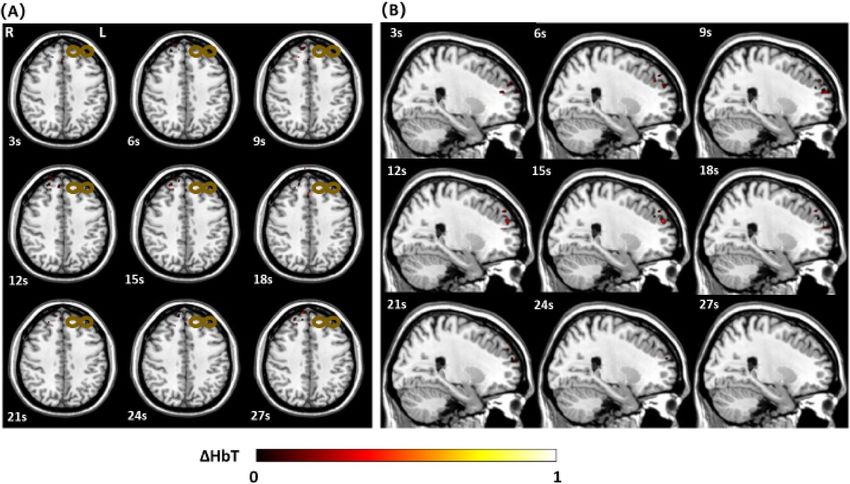
www.nature.com/scientificreports/
Figure 1. Custom DOT head interface. (A) Two layer design with an inner and outer layer superimposed
upon a modified electroencephalogram cap; (B) top-down schematic depicting the location of the TMS coil
(light brown figure of eight symbol) over the left dorsolateral prefrontal cortex and the DOT cap over the right
hemisphere (centered upon the R DLPFC); (C) photographs of the interface connected to a human subject; the
probe comprised of 48 source-detector pairs in total.
100% of MT, at a pulse frequency of 10 pulses per second, with a 4 s stimulation time and a 26 s inter-stimulation
interval time for a total exposure of 3000 pulses per session.
DOT procedure. All imaging was captured by a custom built fast multispectral DOT imaging system con-
structed from our laboratory’s previous studies30. The system involves a main computer sending a signal to a
light emitting diode (LED) controller which activates two groups of LEDs (48 optodes per group; one group at
780 nm and the other at 850 nm) (High-power NIR LEDs, Epitex, Inc.). Two core boards (CuteDigi Technolo-
gies), consisting of an Altera EP2C8 FPGA, 50-megahertz crystal oscillator, and 139 input/output pins, were
used to control the time sequences of each LED. The light beams were sequentially delivered to the measuring
interface through fiber optical bundles. The subsequent diffusing light from the tissue was received by 48 highly
sensitive avalanche photodiode detectors (APD C5460-01, 12-bit resolution, maximum analog–digital conver-
sion rate of 1.25 mega-samples/s) and converted to electrical signals for further processing. Continuous-wave
measurements of three-dimensional data were captured through the 48 pairs of highly sensitive photo source-
detectors. A full set of high density tomographic optical data was acquired with a unit consisting of two PCI-
DAS6071 boards at a 14.4 Hz collection rate for both the wavelengths.
Participants were positioned in the TMS device chair and adjusted to ensure comfort throughout the experi-
mental procedure. We utilized a two-layer interface coupled with a 256-channel medium-sized EEG cap capable
of fitting the head size of all of our subjects (Fig. 1). All external light was blocked from entering the clinical
lab, and the ambient lighting was tested to ensure that it did not contaminate the DOT signal. The DOT probe,
consisting of the 48 pairs of source-detectors, was then positioned over the right hemisphere (centered on the R
DLPFC). The probe was fastened using velcro straps and attached against the scalp with the tips directly touching
Scientific Reports | (2021) 11:7328 | https://doi.org/10.1038/s41598-021-86751-9 3
Vol.:(0123456789)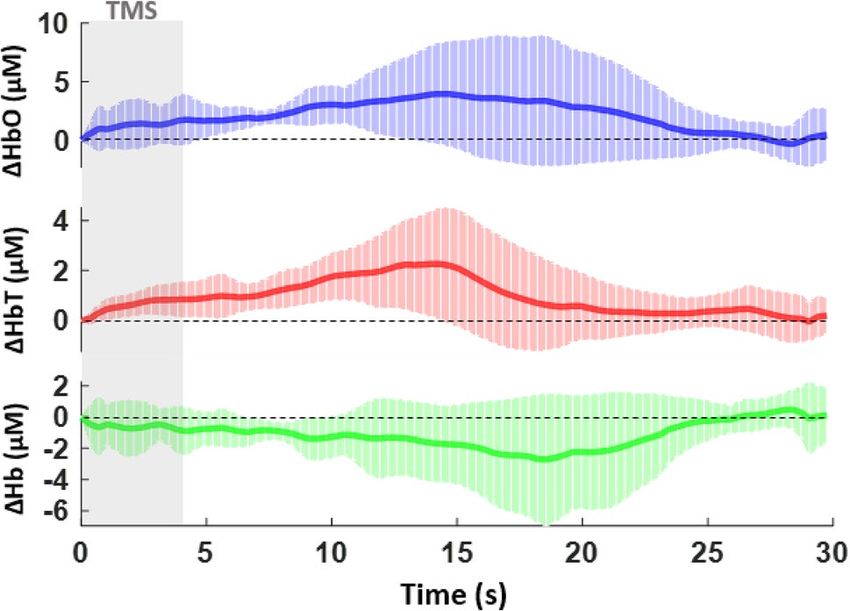
www.nature.com/scientificreports/
the skin for maximum efficiency of light transmission. Any hair strands under the probes were manually moved
away using combs to facilitate optimal contact and avoid contamination by light absorption. The subjects were
then instructed to sit quietly, remain awake, not move, and keep their eyes open. DOT data acquisition occurred
1 min prior to stimulation, during the 24 stimulation/rest epochs (30 s per epoch), and during a 2-min post
stimulation period, resulting in a total recording time of 15 min. Images were only captured for a single treat-
ment session.
Image analysis and processing. The DOT data were processed and analyzed channel-wise (one chan-
nel represents one source-detector pair). The setup comprised of 48 channels in total. The raw data for each
channel were inspected during the entire experiment time course in order to exclude epochs with significant
discontinuity. Several channels had epochs with inadequate measurements due to suspected motion artifact,
thus were removed accordingly. After ensuring the quality of the data, we used a band pass filter (cut off frequen-
cies fH = 9 Hz, fL = 0.02 Hz) to exclude instrumental noise and saturated signals. Contamination of signal from
peripheral co-stimulation during TMS is inherently prevented by the DOT reconstruction algorithms which
include boundary limits when calculating the data from the high number of source-detector pairs. Skin pigmen-
tation is also accounted for based on inherent DOT algorithms and adjustment of signal output and interface
settings to prevent polluted data acquisition. Data were averaged for all participants and the resting time in the
experiment was used as the baseline. The high-density tomographic data acquired at each wavelength was used
to reconstruct a three-dimensional image of tissue absorption coefficient using a finite element-based algorithm
previously developed and optimized31. The physiological measurements in terms of oxygenated and deoxygen-
ated hemoglobin, [HbO] and [Hb], respectively, were calculated using the absorption coefficient images at both
wavelengths and a modified Beer–Lambert law coupled with a least-square fitting procedure through pseudo-
inverse matrix calculations32. Cerebral blood volume was estimated by calculating the total hemoglobin concen-
tration, [HbT], which was achieved by summing [HbO] and [Hb].
Definition of regions of interest. Regions of interest were identified on a MRIcron ch2.nii.gz MRI tem-
plate. The coordinate system used was based on a Cartesian three-dimensional configuration combined with
a 256 channel EEG system. The origin [0, 0, 0] was set at C18 on the EEG system. From this location, three-
dimensional images including coronal, sagittal, and transverse views were derived. The direction of the X, Y, and
Z axes were defined as right to left, posterior to anterior, and inferior to superior. This coordinate configuration
was combined with an EEG system for ease of use and recognition purposes as EEG mapping is commonly
employed in other protocols. The right prefrontal cortex was centered at coordinates [51, 35, 53] for the healthy
subjects. For the depressed group, this location was centered at coordinates [48, 39, 57]. These coordinates were
based on the averaged areas of maximum peak activations during image capturing and were within the expected
range (Figure S1).
DOT statistical analysis. Data analysis was conducted using MATLAB (version R 2018a) and SAS (9.4).
Subject means were allowed to vary around an individualized intercept across trails with stimulation type as a
within subject factor. Redundant analysis was conducted using repeated measures analysis of variance (ANOVA)
to allow simpler interpretation of the results. The alpha level was set at 0.05 for all calculations.
Results
Participants. Eight healthy individuals (7 men and 1 woman) with a mean age of 33.5 ± 15.9 years and 11
depressed patients (2 men and 9 women) with a mean age of 51.8 ± 15.7 years were initially recruited as paid
volunteers. Two healthy subjects were excluded due to significant motion artifacts that could not be rectified.
One depressed subject was excluded due to weak signal processing and three others volitionally left the experi-
ment prior to any stimulation or data collection due to personal life conflicts. In total, six healthy individuals (5
men and 1 woman) with a mean age of 36.3 ± 16.7 years and seven depressed individuals (2 men and 5 women)
with a mean age of 49.1 ± 17.8 years were included for final analysis. All the participants were right-handed, as
determined by the modified Edinburgh Handedness Questionnaire33, and had normal or corrected-to-normal
vision. All subjects were of Caucasian descent except for two Asian females (one from each study group). For
the depressed individuals, all of them had failed at least 3 antidepressants, been diagnosed by a psychiatrist for at
least 3 years with Major Depressive Disorder, and remained on antidepressants while receiving rTMS treatment.
DOT imaging data. As hypothesized, there was an observable quantitative difference in the hemodynamic
response between healthy and depressed subjects within the right dorsolateral prefrontal cortex. In healthy indi-
viduals, [HbO] and [HbT] began to increase sharply beginning at 2.62 s until a peak observed at 10.40 s (95% CI
[1.544, 9.609] and [1.734, 6.220] for [HbO] and [HbT], respectively). The average absolute value of hemoglobin
change was calculated to be 5.58 µM and 3.98 µM for [HbO] and [HbT], respectively. [Hb] was found to decrease
in a reciprocal manner at first until 5.3 s, with a gradual decline thereafter for the rest of the epoch. Its average
absolute value was calculated at 3.04 µM (Fig. 2). In the depressed subjects, [HbO] and [HbT] increased more
gradually and their values plateaued later in comparison to the healthy subjects at 14.55 s (95% CI [1.869, 4.169]
and [1.108, 2.462] for [HbO] and [HbT], respectively) (p = 0.013 for [HbO] and p = 0.011 for [HbT]). The aver-
age absolute values of hemoglobin change in this group were noted to be decreased, at 3.98 µM and 2.27 µM for
[HbO] and [HbT], respectively. [Hb], in a similar fashion, decreased gradually though reached a nadir later at
18.43 s (Fig. 3). The average value of change was calculated to be 2.71 µM.
When comparing the two groups, the difference in time to peak [HbO] and [HbT] was 4.15 s (p = 0.032 for
[HbO] and p = 0.010 for [HbT]), with a later onset in the depressed subjects. The average hemoglobin change in
Scientific Reports | (2021) 11:7328 | https://doi.org/10.1038/s41598-021-86751-9 4
Vol:.(1234567890)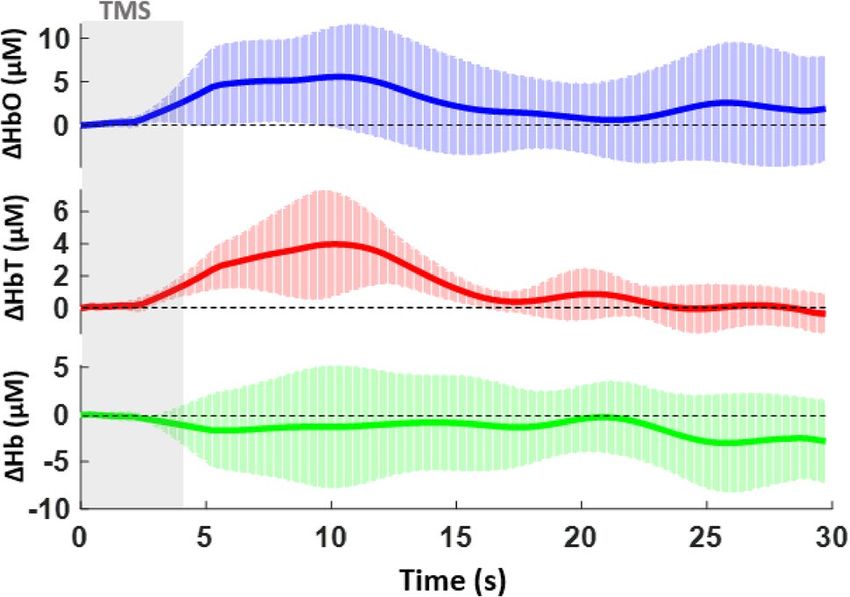
www.nature.com/scientificreports/
Figure 2. Averaged time course of oxygenated [HbO], total [HbT], and deoxygenated [Hb] hemoglobin
signals in the healthy subjects for the contralateral or right dorsolateral prefrontal cortex. Ten hertz stimulation
was performed for 4 s followed by 26 s of rest for a total of 12 epochs. The x-axis represents the time from 0
to 30 s during the epoch and the y-axis represents the mean and standard deviation for relative hemoglobin
concentration in µM/L.
Figure 3. Averaged time course of oxygenated [HbO], total [HbT], and deoxygenated [Hb] hemoglobin signals
in the depressed subjects for the contralateral or right dorsolateral prefrontal cortex. Ten hertz stimulation
was performed for 4 s followed by 26 s of rest for a total of 12 epochs. The x-axis represents the time from 0
to 30 s during the epoch and the y-axis represents the mean and standard deviation for relative hemoglobin
concentration in µM/L.
this group was also observed to be decreased by 1.60 µM, 1.71 µM, and 0.33 µM for [HbO], [HbT], and [Hb],
respectively.
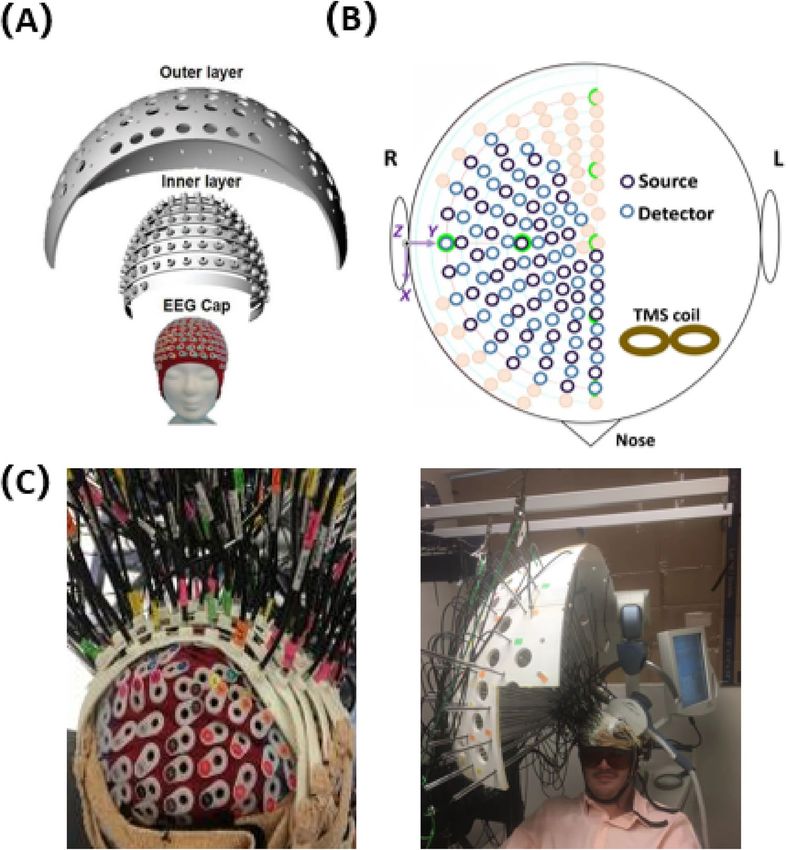
Three-dimensional functional imaging during and after rTMS stimulation was successfully captured by our
DOT system. In the provided transverse and sagittal images of the right DLFPC (Figs. 4, 5), clear distinctions
in activation patterns between a depressed and healthy subject can be observed. Healthy subjects were observed
to have a more robust area of activation prior to a return to baseline. In comparison, depressed individuals had
a smaller change in hemodynamic response with a more restricted distribution pattern. By taking advantage of
the inherent ability of DOT to assess depth, a volumetric analysis of the change in [HbO] was also calculated.
During the 4 s of stimulation, alterations in the volume (in cm3) of activation were observed to occur, which
continued even after cessation of stimulation. Healthy subjects reached a maximum average volume change of
6.99 cm3 whereas depressed subjects peaked at 2.95 cm3 (p = 0.016). As can be seen in Fig. 6, we were able to
concurrently plot volume changes with three dimensional images in our subjects. An increase in volume stimu-
lated can clearly be seen in both groups that peaks and then gradually trends towards baseline, with a smaller
volume of response in the depressed group.
Scientific Reports | (2021) 11:7328 | https://doi.org/10.1038/s41598-021-86751-9 5
Vol.:(0123456789)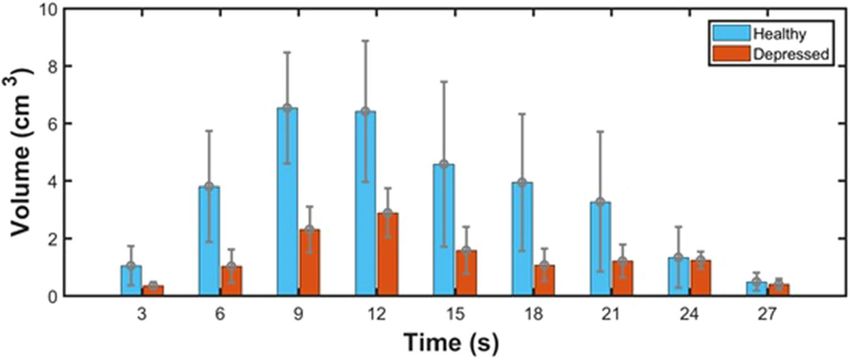
www.nature.com/scientificreports/

                                            Figure 4.  (A) Transverse view of the three-dimensional [HbT] images collected by DOT in a healthy subject
                                            during a 30 s epoch. (B) Sagittal view of the three-dimensional [HbT] images collected by DOT in a healthy
                                            subject during a 30 s epoch. Data was only acquired from the right hemisphere of the brain. The bronze colored
                                            coil symbol represents stimulation of the left side.

                                            Figure 5.  (A) Transverse view of the three-dimensional [HbT] images collected by DOT in a depressed subject
                                            during a 30 s epoch. (B) Sagittal view of the three-dimensional [HbT] images collected by DOT in a depressed
                                            subject during a 30 s epoch. Data was only acquired from the right hemisphere of the brain. The bronze colored
                                            coil symbol represents stimulation of the left side.

                                            Discussion
                                            In this study, we have demonstrated for the first time the ability of a novel DOT system to capture cerebral hemo-
                                            dynamic activity during and after rTMS in depressed and healthy individuals. Previous studies with fNIRS and
                                            other modalities have only been able to offer incomplete insights due to the lack of adequate temporal and spatial
                                            resolution, and more importantly, volumetric three-dimensional images. Many of those experiments focused
                                            on lower frequency stimulation in healthy subjects as well. No prior study has directly compared depressed

          Scientific Reports |   (2021) 11:7328 |                https://doi.org/10.1038/s41598-021-86751-9                                                 6

Vol:.(1234567890)
www.nature.com/scientificreports/
Figure 6. Averaged volume change (in c m3) with error bars of [HbO] signal compared between the healthy and
depressed groups.
individuals with healthy ones, especially using treatment parameters closer to those that are approved by the
FDA in the United States. As such, the implications of our findings potentially create a new frontier in further-
ing our knowledge of the mechanism of TMS in depression and how we can improve it to more effectively treat
depression.
A plethora of past fNIRS studies have observed how different frequencies and motor thresholds of TMS
stimulation cause variable inhibitory or excitatory effects within the brain. Lower frequencies (1, 2, 5 Hz) tend
to cause decreases in [HbO] in the motor or prefrontal cortices, and previous studies have demonstrated that
1 Hz stimulation on the right DLPFC has a clinical effect on treating depression. 10 Hz stimulation has been
shown to increase [HbO], which was associated with continued therapeutic effects of TMS34–36. Our results show
a clear difference in the time to peak [HbO] and [HbT] and average hemoglobin value change between depressed
and healthy subjects. There is a noticeable delayed and decreased hemodynamic change that likely reflects a less
robust response to rTMS treatment. The reasoning underlying this finding is possibly linked to what is occurring
at the neuronal or cellular level.
The neurobiology and pathophysiology of depression is a much-debated topic without any definitive conclu-
sions. There is suspected to be a complex interplay within multiple realms including neurocircuitry, molecular
signaling, genetics and epigenetics, homeostatic adaptations, and immune responses37. An exact circuit has not
been identified, though several regions have been noted to be malfunctioning including the orbitomedial pre-
frontal cortex, anterior cingulate cortex, amygdala, hippocampus, cerebellum, and basal ganglia38. Within these
areas, one such hypothesis suggests that there are redundant and dysfunctional firing of neurons which leads to
overall decreased activity, and thus reduced neurovascular coupling and blood flow, which is potentially what is
being observed in our depressed s ubjects39.
Regarding laterality of stimulation in relation to our results, previous studies have demonstrated variable
results. Some report bilateral and congruent responses, whereas others report interhemispheric differences18.
The underlying etiology for these discrepancies is unknown. Proposed hypotheses have included disjointed cou-
pling and heterogeneous connectivity errors in the setting of depression through pathoetiologic mechanisms as
described above. An additional reason may be due to the varying capabilities of previous imaging modalities and
diversity of their sample sizes. Though we were unable to study the ipsilateral DLPFC (due to technical feasibility),
our results of the contralateral side were congruent with the majority of previous fNIRS l iterature18. Moreover,
previous studies have not been able to reliably capture three-dimensional data during the active stimulation in
both depressed and healthy subjects, thus highlighting another potential explanation for any differences observed
here compared to other studies.
In terms of our volumetric three-dimensional analyses, we also observed distinct differences in the time to
maximum volume change between depressed and healthy subjects. At 12 s (or 8 s after the stimulation window),
depressed subjects only reached approximately half the depth of hemodynamic change that healthy individuals
experienced. Although DOT is unable to reliably obtain data of the deepest structures within the brain, this
finding may further reinforce the rationale underlying theories about what TMS is truly stimulating in depres-
sion. The left DLPFC is the most common target for treating depression not only necessarily due to this specific
region itself, but from studies demonstrating that it modulates the blood flow response and activity of the ante-
rior cingulate cortex as well40. The rates of perfusion and metabolism in this region in particular may predict
response to t reatments41. Thus, the observed reduced hemodynamic response of the DLPFC may suggest that
either: (1) even near-FDA approved treatment parameters in our study were not adequate enough to generate
appropriate treatment response or stimulation or (2) depressed individuals at baseline have a blunted response
and could require individualized treatment parameters to achieve proper activation. However, this would have
to be clarified in future studies that directly study the connectivity between the DLPFC and anterior cingulate
cortex or other structures actively during stimulation.
The significance of our data then may potentially pave the way towards truly optimizing TMS for depression
at even the individual level. Ideal stimulation parameters have remained unknown as there has previously been
Scientific Reports | (2021) 11:7328 | https://doi.org/10.1038/s41598-021-86751-9 7
Vol.:(0123456789)www.nature.com/scientificreports/
no reliable mechanism to measure neural connectivity and hemodynamic responses actively during stimula-
tion. Utilizing DOT simultaneously with TMS in testing variable frequencies, intensities, number of pulses, and
interval timings offers a new promising approach to allowing such exploration in real time and with three dimen-
sional images. Cortical activation/inhibition patterns and hemodynamic responses would be reliably captured
in depressed and healthy individuals. In addition, pairing DOT with newer protocols such as intermittent theta
burst stimulation (iTBS) may also lend further credence to such approaches. iTBS uses 50 Hz triplet “bursts”
every 200 ms to activate the brain and deliver an entire therapeutic dose equivalent of stimulation in 3 to 10 min
versus the standard 18 to 37 min. Recently Cole et. al published the first trial demonstrating a high efficacy when
delivering iTBS ten times daily for 5 days, thus dramatically shortening the usual treatment t ime42. To the best
of our knowledge, no neuroimaging studies have been conducted which compare iTBS or other techniques with
traditional 10 Hz rTMS, which a direct comparison may offer even further insights into discovering optimal
parameters. Additionally, using a modality like DOT to study iTBS by itself may help us understand this par-
ticular technique more as well.
Another unanswered question of how TMS can be improved involves developing more precise stimulation
site targeting. Traditionally, providers will identify the left DLPFC by the “5-cm rule”, which involves finding the
area over the motor cortex that produces a finger twitch, then moving 5–6 cm anterior43,44. As there are inher-
ent differences in neuroanatomy, this method may lead to enormous treatment response heterogeneity among
individuals45. It has been recently speculated that structural magnetic resonance imaging-guided placement of
the coil may lead to improved outcomes; however, this has not been established46. Instead, targeting with fMRI
has preliminarily shown improved antidepressant response if stimulated at more anterior and lateral locations
within the DLFPC or at a site more negatively correlated to the subgenual c ingulate47,48. Unfortunately, it is very
challenging to reliably use fMRI simultaneously with TMS. Additionally, these machines are quite expensive,
not portable, and not readily available in many areas of the world. DOT on the other hand would be able to
theoretically assist with targeting in a similar fashion as the area that requires identification is superficial enough
to be within standard DOT imaging depths.
Our study was certainly not without limitations. First, this was a pilot study with a heterogeneous, small
sample size at a single center, without randomization or a TMS sham group. As such, the generalizability of
our results is limited due to the inherent design. Additionally, due to the small sample size, there was a notable
imbalance between the study groups in terms of age and gender. As such, age and gender-related cortical atro-
phy could have affected our results given potential changes in coil to cortex distance theoretically49; though the
average age of our groups was not within the range at which atrophy rates increase significantly. We also did not
conduct any regular standardized symptom scales or assessments throughout that would allow us to comment
on TMS treatment efficacy differences within the depressed group. Next, the intensity of our TMS parameters
was set at 100% instead of 120% which could certainly affect the neural activation patterns captured by imaging.
Our parameters otherwise were within FDA approved limits for the treatment of depression. For initial feasibility
purposes, the DOT setup was created to obtain images from the contralateral DLPFC. Directly under the coil
and bilateral data acquisition would have been more ideal, as fNIRS can be used in such a way. However, our
results were still congruent with previous functional imaging data and future directions include augmentation
of the setup to obtain bilateral information in subsequent studies.
In addition, further obstacles regarding the DOT setup itself should be mentioned. Due to the physical limi-
tations of the optical fibers and optodes used in the headgear design, meticulous planning of the array must be
considered. Movement artifacts, as with any other techniques, is still a significant barrier that will inevitably be
present. Proper construction of the optode headgear with fixation may assist with reducing this phenomenon,
along with further advancements in post-processing and filtering methodologies. Physiological signal contamina-
tion is another technical limitation that is common to all optical methods especially. Although DOT suffers much
less from scalp interference (compared to fNIRS), the presence of hair itself or dark shades impairs signal quality.
As such, pinning or separation of hair is an unideal and imprecise method often employed. Further development
of analysis and filtering algorithms may assist with bypassing this issue. Additionally, though theoretically the
magnetic field of TMS should not interfere with the DOT recording signal, there are no published studies of this
(likely due to the improbable nature of it occurring). Lastly, the maximum depth that can be reliably and accu-
rately imaged is greater than fNIRS, though is still limited compared to fMRI. It is estimated to be approximately
5 cm, which reduces the ability to detect deeper brain structures (e.g., basal ganglia, amygdala), but more than
capable of capturing cortical and some subcortical structures.
Conclusion
In summary, this is the first study to our knowledge of using DOT to simultaneously measure functional brain
changes induced by rTMS in depressed and healthy subjects. Standard treatment parameters were conducted
along with concurrent neuroimaging that demonstrated a delayed and less robust response in depressed indi-
viduals. Three-dimensional images with high spatial and temporal resolutions were collected, along with associ-
ated volumetric changes. This novel optical neuroimaging device is a safe, noninvasive, portable, and effective
modality that may pave the path towards furthering our understanding of neural hemodynamic responses in
depression and with further studies may allow for optimization of treatment parameters and thus improved
outcomes in depression.
Received: 23 October 2020; Accepted: 10 March 2021
Scientific Reports | (2021) 11:7328 | https://doi.org/10.1038/s41598-021-86751-9 8
Vol:.(1234567890)www.nature.com/scientificreports/
References
1. Kessler, R. C. & Bromet, E. J. The epidemiology of depression across cultures. Annu. Rev. Public Health 34, 119–138 (2013).
2. Patel, V. et al. Addressing the burden of mental, neurological, and substance use disorders: Key messages from Disease Control
Priorities, 3rd edition. Lancet 387(10028), 1672–1685 (2016).
3. Gartlehner, G. et al. Pharmacological and non-pharmacological treatments for major depressive disorder: Review of systematic
reviews. BMJ Open 7(6), e014912 (2017).
4. Sinyor, M., Schaffer, A. & Levitt, A. The sequenced treatment alternatives to relieve depression (STAR*D) trial: A review. Can. J.
Psychiatry 55(3), 126–135 (2010).
5. Perera, T. et al. The clinical TMS society consensus review and treatment recommendations for TMS therapy for major depressive
disorder. Brain Stimul. 9(3), 336–346 (2016).
6. George, M. S. et al. Daily left prefrontal transcranial magnetic stimulation therapy for major depressive disorder: A sham-controlled
randomized trial. Arch. Gen. Psychiatry 67(5), 507–516 (2010).
7. Higgins, E. S. & George, M. S. Brain Stimulation Therapies for Clinicians 2nd edn. (American Psychiatric Association Publishing,
2020).
8. George, M. S. et al. Daily repetitive transcranial magnetic stimulation (rTMS) improves mood in depression. NeuroReport 6(14),
1853–1856 (1995).
9. George, M. S. et al. Changes in mood and hormone levels after rapid-rate transcranial magnetic stimulation (rTMS) of the pre-
frontal cortex. J. Neuropsychiatry Clin. Neurosci. 8(2), 172–180 (1996).
10. George, M. S. et al. Mood improvement following daily left prefrontal repetitive transcranial magnetic stimulation in patients with
depression: A placebo-controlled crossover trial. Am. J. Psychiatry 154(12), 1752–1756 (1997).
11. O’Reardon, J. P. et al. Efficacy and safety of transcranial magnetic stimulation in the acute treatment of major depression: A multisite
randomized controlled trial. Biol. Psychiatry 62(11), 1208–1216 (2007).
12. Berlim, M. T., van den Eynde, F., Tovar-Perdomo, S. & Daskalakis, Z. J. Response, remission and drop-out rates following high-
frequency repetitive transcranial magnetic stimulation (rTMS) for treating major depression: A systematic review and meta-analysis
of randomized, double-blind and sham-controlled trials. Psychol. Med. 44(2), 225–239 (2014).
13. George, M. S. Whither TMS: A one-trick pony or the beginning of a neuroscientific revolution?. Am. J. Psychiatry 176(11), 904–910
(2019).
14. Bestmann, S., Baudewig, J., Siebner, H. R., Rothwell, J. C. & Frahm, J. BOLD MRI responses to repetitive TMS over human dorsal
premotor cortex. Neuroimage 28(1), 22–29 (2005).
15. Shibasaki, H. Human brain mapping: Hemodynamic response and electrophysiology. Clin. Neurophysiol. 119(4), 731–743 (2008).
16. Farzan, F. et al. Suppression of gamma-oscillations in the dorsolateral prefrontal cortex following long interval cortical inhibition:
A TMS-EEG study. Neuropsychopharmacology 34(6), 1543–1551 (2009).
17. Kozel, F. A. et al. Using simultaneous repetitive transcranial magnetic stimulation/functional near infrared spectroscopy (rTMS/
fNIRS) to measure brain activation and connectivity. Neuroimage 47(4), 1177–1184 (2009).
18. Curtin, A. et al. A systematic review of integrated functional near-infrared spectroscopy (fNIRS) and transcranial magnetic
stimulation (TMS) studies. Front. Neurosci. 13, 84 (2019).
19. Hoshi, Y. & Yamada, Y. Overview of diffuse optical tomography and its clinical applications. J. Biomed. Opt. 21(9), 091312 (2016).
20. Lee, C. W., Cooper, R. J. & Austin, T. Diffuse optical tomography to investigate the newborn brain. Pediatr. Res. 82(3), 376–386
(2017).
21. Dai, X. et al. Fast noninvasive functional diffuse optical tomography for brain imaging. J. Biophoton. 11, 3 (2018).
22. Jiang, H. et al. Near-infrared optical imaging of the breast with model-based reconstruction. Acad. Radiol. 9(2), 186–194 (2002).
23. Yuan, Z., Zhang, Q., Sobel, E. S. & Jiang, H. Tomographic x-ray-guided three-dimensional diffuse optical tomography of osteoar-
thritis in the finger joints. J. Biomed. Opt. 13(4), 044006 (2008).
24. Zeff, B. W., White, B. R., Dehghani, H., Schlaggar, B. L. & Culver, J. P. Retinotopic mapping of adult human visual cortex with
high-density diffuse optical tomography. Proc. Natl. Acad. Sci. USA 104(29), 12169–12174 (2007).
25. Habermehl, C. et al. Somatosensory activation of two fingers can be discriminated with ultra high-density diffuse optical tomog-
raphy. Neuroimage 59(4), 3201–3211 (2012).
26. First, M., Williams, J. B. W., Karg, R. & Spitzer, R. L. Structured Clinical Interview for DSM-5 (SCID) (American Psychiatric Press,
2015).
27. Keel, J. C., Smith, M. J. & Wassermann, E. M. A safety screening questionnaire for transcranial magnetic stimulation. Clin. Neu-
rophysiol. 112(4), 720 (2001).
28. Pridmore, S., Fernandes Filho, J. A., Nahas, Z., Liberatos, C. & George, M. S. Motor threshold in transcranial magnetic stimulation:
A comparison of a neurophysiological method and a visualization of movement method. J. ECT. 14(1), 25–27 (1998).
29. Borckardt, J. J., Nahas, Z., Koola, J. & George, M. S. Estimating resting motor thresholds in transcranial magnetic stimulation
research and practice: A computer simulation evaluation of best methods. J. ECT. 22(3), 169–175 (2006).
30. Yang, J., Zhang, T., Yang, H. & Jiang, H. Fast multispectral diffuse optical tomography system for in vivo three-dimensional imaging
of seizure dynamics. Appl. Opt. 51(16), 3461–3469 (2012).
31. Jiang, H. Diffuse Optical Tomography: Principles and Applications (CRC Press, 2010).
32. Delpy, D. T. et al. Estimation of optical pathlength through tissue from direct time of flight measurement. Phys. Med. Biol. 33(12),
1433–1442 (1988).
33. Oldfield, R. C. The assessment and analysis of handedness: The Edinburgh inventory. Neuropsychologia 9(1), 97–113 (1971).
34. Hada, Y., Abo, M., Kaminaga, T. & Mikami, M. Detection of cerebral blood flow changes during repetitive transcranial magnetic
stimulation by recording hemoglobin in the brain cortex, just beneath the stimulation coil, with near-infrared spectroscopy.
Neuroimage 32(3), 1226–1230 (2006).
35. Cao, T. T. et al. A near infra-red study of blood oxygenation changes resulting from high and low frequency repetitive transcranial
magnetic stimulation. Brain Stimul. 6(6), 922–924 (2013).
36. Shinba, T., Kariya, N., Matsuda, S., Matsuda, H. & Obara, Y. Increase of frontal cerebral blood volume during transcranial mag-
netic stimulation in depression is related to treatment effectiveness: A pilot study with near-infrared spectroscopy. Psychiatry Clin.
Neurosci. 72(8), 602–610 (2018).
37. Dean, J. & Keshavan, M. The neurobiology of depression: An integrated view. Asian J. Psychiatr. 27, 101–111 (2017).
38. Helm, K. et al. Neuronal connectivity in major depressive disorder: A systematic review. Neuropsychiatr. Dis. Treat. 14, 2715–2737
(2018).
39. Chaudhury, D., Liu, H. & Han, M. H. Neuronal correlates of depression. Cell Mol. Life Sci. 72(24), 4825–4848 (2015).
40. Barrett, J., Della-Maggiore, V., Chouinard, P. A. & Paus, T. Mechanisms of action underlying the effect of repetitive transcranial
magnetic stimulation on mood: Behavioral and brain imaging studies. Neuropsychopharmacology 29(6), 1172–1189 (2004).
41. Paus, T. & Barrett, J. Transcranial magnetic stimulation (TMS) of the human frontal cortex: Implications for repetitive TMS treat-
ment of depression. J. Psychiatry Neurosci. 29(4), 268–279 (2004).
42. Cole, E. J. et al. Stanford accelerated intelligent neuromodulation therapy for treatment-resistant depression. Am. J. Psychiatry.
177(8), 716–726 (2020).
Scientific Reports | (2021) 11:7328 | https://doi.org/10.1038/s41598-021-86751-9 9
Vol.:(0123456789)www.nature.com/scientificreports/
43. Johnson, K. A. et al. Prefrontal rTMS for treating depression: Location and intensity results from the OPT-TMS multi-site clinical
trial. Brain Stimul. 6(2), 108–117 (2013).
44. McClintock, S. M. et al. Consensus recommendations for the clinical application of repetitive transcranial magnetic stimulation
(rTMS) in the treatment of depression. J. Clin. Psychiatry 79, 1 (2018).
45. Herwig, U., Padberg, F., Unger, J., Spitzer, M. & Schönfeldt-Lecuona, C. Transcranial magnetic stimulation in therapy studies:
Examination of the reliability of “standard” coil positioning by neuronavigation. Biol. Psychiatry 50(1), 58–61 (2001).
46. Li, C. T. et al. Antidepressant efficacy of prolonged intermittent theta burst stimulation monotherapy for recurrent depression and
comparison of methods for coil positioning: A randomized, double-blind sham-controlled study. Biol. Psychiatry 87(5), 443–450
(2020).
47. Herbsman, T. et al. More lateral and anterior prefrontal coil location is associated with better repetitive transcranial magnetic
stimulation antidepressant response. Biol. Psychiatry 66(5), 509–515 (2009).
48. Weigand, A. et al. Prospective validation that subgenual connectivity predicts antidepressant efficacy of transcranial magnetic
stimulation sites. Biol. Psychiatry 84(1), 28–37 (2018).
49. Kozel, F. A. et al. How coil-cortex distance relates to age, motor threshold, and antidepressant response to repetitive transcranial
magnetic stimulation. J. Neuropsychiatry Clin. Neurosci. 12(3), 376–384 (2000).
Acknowledgements
This research was supported in part by University of South Florida internal funds.
Author contributions
S.J. and H.J. conceived and directed the presented study. All authors listed assisted with overall design of the
study. G.C. and R.W. recruited and enrolled appropriate subjects. They also administered the TMS treatments.
J.H., H.Y., and H.J. carried out construction of the imaging device and imaging data collection. S.J. and J.H.
performed the data analyses and calculations. F.A.K. assisted with manuscript writing and data analysis. S.J. was
the primary writer of this manuscript, with supervision and guidance from the other co-authors.
Competing interests
Dr. Huabei Jiang is currently on the editorial board of Scientific Reports. None of the other authors listed in this
manuscript have any competing interests, conflicts, or financial disclosures to report.
Additional information
Supplementary Information The online version contains supplementary material available at https://doi.org/
10.1038/s41598-021-86751-9.
Correspondence and requests for materials should be addressed to H.J.
Reprints and permissions information is available at www.nature.com/reprints.
Publisher’s note Springer Nature remains neutral with regard to jurisdictional claims in published maps and
institutional affiliations.
Open Access This article is licensed under a Creative Commons Attribution 4.0 International
License, which permits use, sharing, adaptation, distribution and reproduction in any medium or
format, as long as you give appropriate credit to the original author(s) and the source, provide a link to the
Creative Commons licence, and indicate if changes were made. The images or other third party material in this
article are included in the article’s Creative Commons licence, unless indicated otherwise in a credit line to the
material. If material is not included in the article’s Creative Commons licence and your intended use is not
permitted by statutory regulation or exceeds the permitted use, you will need to obtain permission directly from
the copyright holder. To view a copy of this licence, visit http://creativecommons.org/licenses/by/4.0/.
© The Author(s) 2021
Scientific Reports | (2021) 11:7328 | https://doi.org/10.1038/s41598-021-86751-9 10
Vol:.(1234567890)You can also read