North Bay Fire Recovery: Building a More Resilient and Inclusive Economy - January 2020
←
→
Page content transcription
If your browser does not render page correctly, please read the page content below
January 2020

North Bay Fire Recovery:
Building a More Resilient
and Inclusive Economy

Acknowledgments                                           About the Institute
This report was prepared by the Bay Area Council          Since 1990, the Bay Area Council Economic Institute has
Economic Institute with generous support from the         been the leading think tank focused on the economic and
Hewlett Foundation. Project partners include Sonoma       policy issues facing the San Francisco/Silicon Valley Bay
County, the City of Santa Rosa, Sonoma County Transit     Area, one of the most dynamic regions in the United
Authority (SCTA), California Forward (CAFWD), North Bay   States and the world’s leading center for technology and
Leadership Council, Rebuild North Bay Foundation, and     innovation. A valued forum for stakeholder engagement
Rob Eyler, Professor at Sonoma State University and CEO   and a respected source of information and fact-based
of Economic Forensics Analytics (EFA).                    analysis, the Institute is a trusted partner and adviser to
                                                          both business leaders and government officials. Through
                                                          its economic and policy research and its many partnerships,
                                                          the Institute addresses major factors impacting the
                                                          competitiveness, economic development and quality of
                                                          life of the region and the state, including infrastructure,
                                                          globalization, science and technology, and health policy. It
                                                          is guided by a Board of Trustees drawn from
                                                          influential leaders in the corporate, academic, non-profit,
                                                          and government sectors. The Institute is housed at and
                                                          supported by the Bay Area Council, a public policy
                                                          organization that includes hundreds of the region’s largest
                                                          employers and is committed to keeping the Bay Area the
Photo Credits
                                                          world’s most competitive economy and best place to live.
Front Cover: Laguna Road; photo by Bob Dass on Flickr.    The Institute also supports and manages the Bay Area
Used under the Creative Commons license.                  Science and Innovation Consortium (BASIC), a partnership
                                                          of Northern California’s leading scientific research
Page 3: Santa Rosa; photo by Bob Dass on Flickr. Used
                                                          laboratories and thinkers.
under the Creative Commons license.

Page 15: Downtown Santa Rosa, Wednesday Night
Market; photo by Greenbelt Alliance on Flickr. Used
under the Creative Commons license.

Page 15: DSC08741; photo by Greenbelt Alliance on
Flickr. Used under the Creative Commons license.

Page 34: Female Nurse; photo by Diabetes Care on
Flickr. Used under the Creative Commons license.

Page 45: DSC_0016; photo by Greenbelt Alliance on
Flickr. Used under the Creative Commons license.

Page 51: St. Helena Road, Sonoma County, California;
photo by Bob Dass on Flickr. Used under the Creative
Commons license.

Page 51: Mercury Blues; photo by Robert Couse-Baker
on Flickr. Used under the Creative Commons license.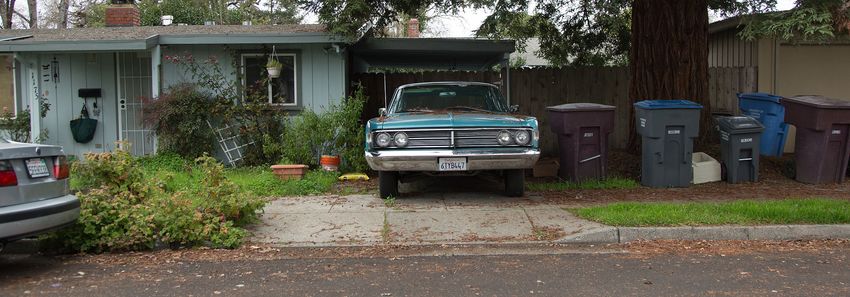
Contents
Introduction..............................................................2
Chapter One: Housing and Affordability
   Impact of the Fires...................................................... 3
   Preexisting Housing Affordability Crisis..................... 4
   Impediments to Increasing Supply........................... 12
Chapter Two: The Economy of Sonoma County
   Understanding Economic Impact............................. 15
   Income, Wages and Employment............................. 18
   Impact of the Fires on Employment......................... 20
   Understanding Economic Impact through Equity.... 27
   Other Important Equity Factors............................... 31
Chapter Three: The Health of Sonoma County
   Physical Health.......................................................... 34
   Behavioral Health...................................................... 38
   Access to Healthcare................................................ 41
   Crime in Sonoma County......................................... 42
Chapter Four: SCTA Transportation Analysis
Zones
   Analysis..................................................................... 45
   Wild Urban Interface................................................. 50
Chapter Five: North Bay Workforce Housing
Needs Survey
   Survey....................................................................... 51
Chapter Six: Equity in Housing
   Neighborhood Profiles............................................. 56
Bay Area Council Economic Institute

Introduction
In October 2017, devastating wildfires swept through
the North Bay, burning more than 245,000 acres in total.
                                                           Objective
Sonoma County was hit the hardest, with over 5,000         Moving forward, it will be beneficial for the various
homes and many businesses destroyed. In the following      rebuilding and resiliency efforts to have access to a
months, countless community groups began the long,         broad and common set of data, analysis of these data,
difficult, and ongoing task of rebuilding Sonoma and       and technical policy expertise. Being able to share the
the surrounding counties. While the immediate post-        same set of information about the impact of the fires,
disaster relief work has been completed, rebuilding        the needs of the community, and best practices for
the community will be a longer road ahead, and it will     planning will be critical to the success of these multiple
require ongoing research and planning as the climate       organizations in rebuilding Sonoma County.
continues to change.
                                                           In that spirit, the primary objectives of this report are:
Over the course of the past year and a half, the
Economic Institute has held or attended dozens of          1. to document and ensure the public availability of the
meetings and convenings, developed a database of              conversations, research, and findings accumulated
public and private sector data, and has provided policy       during the Institute’s work; and
technical assistance to a variety of public departments
                                                           2. to provide a foundation of knowledge in the
and officials. To ensure the public availability of that
                                                              Institute’s core study areas from which stakeholders
research and provide a foundation of knowledge
                                                              can rely on and make informed decisions with.
and analysis, the Institute developed this report and
associated appendices.

2
North Bay Fire Recovery

                                                                                                              1
Housing and Affordability
Impact of the Fires                                         The Tubbs, however, is part of a larger subset of
                                                            devastating wildfires that occurred throughout the North
                                                            Bay in October 2017, burning over 245,000 acres of
October 8, 2017                                             land and hitting Sonoma County the hardest. In total,
On the night of October 8th, the Tubbs Fire roared          the North Bay fires burned down over 8,000 structures,
across 36,807 acres of land across Napa and Sonoma          killed over 40 people, and damaged over 200,000
counties. The fire, which started northwest of Calistoga,   structures (Vives and Winton, 2017). According to
reached Santa Rosa only three hours later in the early      CalFire, over half of the state’s most destructive wildfires
morning of October 9th, where it continued to burn          are fires that have occurred in the last 5 years. Four of
until the following day. Over the course of those three     these fires swept through Napa and Sonoma counties––
days in October, the rampant fire––which was only           bringing to light the fact that these natural disasters are
amplified by excessive winds that had hit the area at       becoming the new normal for California.
over 50 miles per hour––killed at least 22 people and
                                                            The October 2017 fires, and those that have preceded
destroyed approximately 5,636 structures.
                                                            them, have had a lasting impact on the homes,
Of those 5,636 structures that burned down, over            businesses, and residents of Sonoma County and the
2,000 structures were homes. The fire, which began          surrounding region. In this chapter we analyze the
on Bennett Lane in Calistoga, damaged and burned            effects of the fires on housing in Sonoma County in
down several nearby properties, but the most significant    the context of the region’s broader housing market
damage occurred in the city of Santa Rosa and               characteristics and challenges.
surrounding area, in places such as Santa Rosa’s Coffey
Park, which was entirely burned down.

Today, the Tubbs Fire is California’s second most
destructive fire in state history, behind only Butte
County’s Camp Fire, which occurred in November 2018
and burned down four times the number of acres. The
Tubbs Fire is also the third deadliest wildfire by number
of deaths (CalFire, 2019).

                                                                                                                      3
Bay Area Council Economic Institute

Preexisting Housing                                          housing costs. While the Bay Area region, in particular,
                                                             has generated significant economic activity, the region
Affordability Crisis                                         has in turn failed to supply adequate levels of housing
                                                             to meet its growing demand––thus seeing a spike in
Understanding the true severity of the Tubbs Fire first      home prices and rental unit costs since the recession
requires understanding the state of the region and           compared to other metro areas. This jobs-housing
California’s housing affordability crisis prior to October   imbalance is due to several factors:
2017, which compounded the devastation of the fires
and their long-term impacts. With a limited supply of        ■■ Compared to similar metro areas, the Bay Area builds
housing to begin with, the North Bay was primed for             and permits fewer homes;
a severe hit to affordability when disaster struck. The
massive destruction of homes further reduced the tight       ■■ Development and construction costs are higher in
housing supply, displacing residents and driving up sky-        California than in most states across the U.S.;
high rents.                                                  ■■ Local and political resistance to building housing is
                                                                paired with significant local control within the state,
Before the Fires                                                where communities on average view more housing as
                                                                a cultural and financial threat; and
For the past 70 years, California has been an
increasingly unaffordable state to live in. Parts of the     ■■ Zoning, environmental, and other historic laws have
state, such as the Bay Area region, San Diego, and              made it difficult to build new housing, particularly
Los Angeles are notorious for their especially high             affordable housing

4
North Bay Fire Recovery

             As shown on the previous page, the Bay Area has permitted a smaller number of new
             housing units for every 1,000 people added to its population than its peer metros have.
             This failure to provide sufficient housing for those moving to the region has contributed
             to the steep escalation of home prices throughout the Bay Area. In the San Francisco
             metro area, which encompasses Alameda, Contra Costa, San Francisco, San Mateo, and
             Marin counties, the median value of a home has risen by nearly 40% just in the past four
             years––reaching almost $1 million. In the Santa Rosa MSA, this increase was about 30%.

                                                          #& &                                                          ' )
 ******

 *****

 *****

 $*****

 %*****

 *****

 *****
                       "

                                                                            " %

                                                                                                                                 " $

                                                                                                                                                                                      "


                                )

                                                         (

                                                                    %

                                                                                     ) %

                                                                                                              ( %

                                                                                                                         $

                                                                                                                                          ) $

                                                                                                                                                                   ( $


                                                                                                                                                                                               )

                                                                                                                                                                                                                        (


                                                 !

                                                                                                      ! %

                                                                                                                                                           ! $

                                                                                                                                                                                                                !
                                        '

                                                                                             ' %

                                                                                                                                                  ' $

                                                                                                                                                                                                       '

                                                                               &  #  +                               " # +                              "
               '"
              + )##

             A Crisis Made Suddenly Worse
             With rapidly escalating home prices and an extremely limited housing supply even
             before the fires, the Sonoma County housing market did not have much room
             to accommodate a sudden shock. This put renters at particular risk. While most
             homeowners had some insurance to guarantee them a place to stay and an eventual
             rebuild of their homes, renters––especially lower-income residents––were displaced into
             a rental market with few options and high prices, with some having to leave the county
             entirely. Even with price gouging restrictions in place, a clear spike in rental prices
             occurred just after the fires in 2017, and prices have not fully returned to their pre-fire
             levels.

                                                                                                                                                                                                                                          5
Bay Area Council Economic Institute

                                                                   Median Rental Rates for Single Family Residences
                  $3,800

                  $3,600

                  $3,400

                  $3,200

                  $3,000

                  $2,800

                  $2,600

                  $2,400

                  $2,200

                  $2,000

                                                                                                                                                                                                         Mar-18

                                                                                                                                                                                                                           Jul-18
                                                                                                                                                                                                                                    Sep-18
                                                                                                                                                                                                                                             Nov-18
                                                                                                                                                                                                                                                      Jan-19
                              Jan-15
                                       Mar-15

                                                                                    Jan-16
                                                                                             Mar-16

                                                                                                                                          Jan-17

                                                                                                                                                            May-17
                                                                                                                                                                     Jul-17
                                                                                                                                                                              Sep-17
                                                                                                                                                                                       Nov-17
                                                                                                                                                                                                Jan-18

                                                                                                                                                                                                                  May-18
                                                May-15
                                                         Jul-15
                                                                  Sep-15
                                                                           Nov-15

                                                                                                      May-16
                                                                                                               Jul-16
                                                                                                                        Sep-16
                                                                                                                                 Nov-16

                                                                                                                                                   Mar-17
                                                                              San Francisco, CA                                           Santa Rosa, CA                                         California
                              Source: Zillow Research
                              Analysis: Bay Area Council Economic Institute

             Homeowners, too, have felt the impacts of the fires. Even homeowners with above
             average insurance plans continue to experience difficulty and delay in the rebuilding
             process. Perhaps more troubling, the sheer severity of the disasters has put a strain on
             insurance companies and customers, who fear their insurance coverage may dry up
             given the delays. Building enough housing units in Sonoma County has become an even
             more urgent necessity in the wake of the fires. Sonoma County has set as its housing
             goal to build 30,000 new units from 2018 to 2023. However, if current trends continue
             without a major increase in building activity, Sonoma County will have only added
             around 10,000 new housing units between 2010 and 2023.

                                       New Private Housing Structures Authorized by Building Permits for
                                         Sonoma County, CA, Units, Annual, Not Seasonally Adjusted
                  35,000

                  30,000

                  25,000

                  20,000

                  15,000
                                                                                                                                                                                                                                         10,668
                  10,000

                   5,000

                        0
                               2010 2011 2012 2013 2014 2015 2016 2017 2018 2019 2020 2021 2022 2023
                                                                                                 Housing Permits                                             Cumulative Permits
                  Source: U.S. Census Bureau, American Community Survey
                  Analysis: Bay Area Council Economic Institute; Note: From 2018-2023, we used the average number of permits from 2010-2017 (762 units annually)

6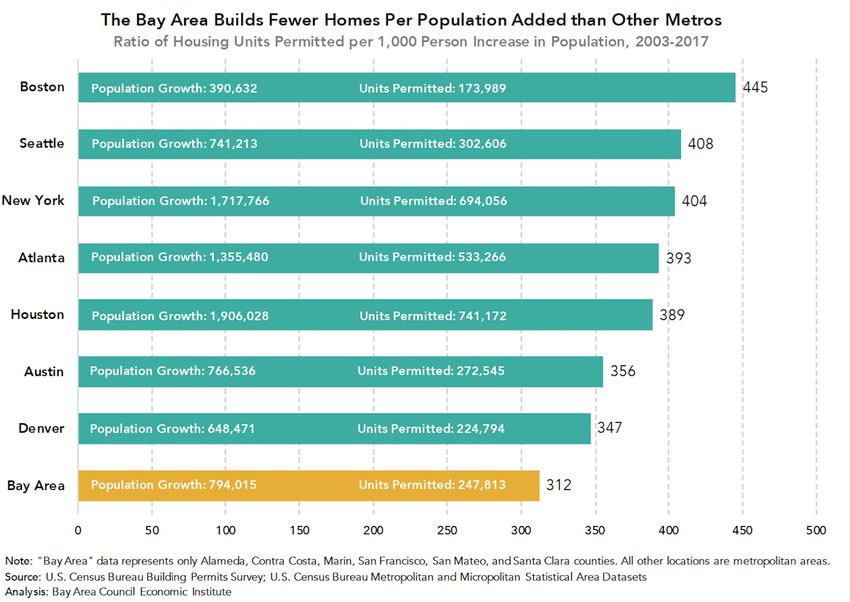
North Bay Fire Recovery
Deep Dive on Affordability
With the preexisting housing crisis exacerbated by burdened by housing costs, with housing cost burden
the fires, housing inaffordability persists to an intense defined as spending more than 30% of household
degree in Sonoma County. While it is a challenge income on housing costs. The overall percentage
for all residents, it affects different geographic areas of Sonoma County residents who are housing cost
and demographic groups in the county differently. It burdened is higher than in any other county in the Bay
threatens Sonoma’s economy as a whole and presents Area––at 41%.
serious equity problems for the region. Many of the Though housing affordability is a challenge for many
county’s workers cannot afford to live there, and the lack in Sonoma, the cost burden is not distributed equally
of affordable housing options pushes existing residents across groups. A significantly higher percentage of black
out and prevents new ones from being able to move in. and Hispanic/Latino households are spending more than
While housing affordability has improved over time for 30% of their income on housing costs than are Asian
homeowners, it has remained relatively stable for renters and white households.
over the past seven years, at around 60% of renters
& * #('
#&
$)
& #
")
)
)
$)
%)
)
)
%)) %))" %))! %)) %)) %)
) %)
%)
% %)
$ %)
%)
%)
" %)
!
(*
&
* (
Not only are black and Hispanic/Latino residents of Sonoma County more likely to be
housing cost burdened, they are also significantly less likely to own a home, making
them much more vulnerable to housing pressures such as reductions in supply and
spikes in price. Around 40% of Black and Hispanic/Latino residents own a home, whereas
the homeownership rates for Asian and white residents are 78% and 68%, respectively.
This sets up black and Hispanic/Latino residents to be disproportionately burdened by
the effects of the fires.
7
Bay Area Council Economic Institute

8
North Bay Fire Recovery

          Further compounding these problems is that homeownership is becoming an ever more
          unattainable goal for residents of Sonoma County. While prices (reflected in today’s
          dollars) across the county have not yet returned to the 2005 peak, they are heading
          in that direction. The median home price in Santa Rosa rose by 61% just from 2012 to
          2017, with the rate of increase only slowing slightly over time. Though Santa Rosa is still
          more affordable than some other parts of the Bay Area, such as San Francisco and the
          South Bay, this has become increasingly less so since 2012. In cities such as Petaluma
          and Sebastopol, the median home price has reached $600,000 to $700,000.

                                                        %
'' '''

'' '''

  '' '''

'' '''

'' '''

"'' '''

#'' '''

'' '''

           '
                  #''" #'' #'' #''                  #'' #'' #'' #'' #' #'# #'" #' #' #'      #'

                                                !     ! $     !&   !


                                                                                                                          9
Bay Area Council Economic Institute
Housing Characteristics and Affordability by qualify for a loan on a home valued at the median price
Geography for the area. Residents of Santa Rosa score higher on
the Housing Affordability Index, as do residents of
While residents throughout Sonoma County struggle Petaluma and others in the east and northeast of the
with housing affordability, the extent to which county. Much of the western part of the county scores
affordability is a challenge varies by census tract. Esri lower on the Housing Affordability Index. Even those
Demographics creates a Housing Affordability Index, areas that score higher on the index are still below a
which measures the ability of a typical household to score of 100, which means that residents do not on
purchase an existing home in an area, based on how average have a high enough household income to
sufficient an area’s average household income is to qualify for a loan for a median-priced home.
2018 Housing Affordability Index in Sonoma County - Zip Code
Esri's 2018 Housing Affordability Index (HAI)
measures the financial ability of a typical
household to purchase an existing home in
an area. Sonoma County ranges from 32-86.
A HAI of 100 represents that on average an
area has sufficient household income to
qualify for a loan on a home valued at the
median home price.
A HAI >100 suggests that homes are easily
affordable by the average area resident.
A HAINorth Bay Fire Recovery
Total Share of Housing Cost Burdened Households in Sonoma County
Total Share of Housing Cost
Burdened Households
27% - 41%
42% - 52%
53% - 64%
64% - 78%
Predominant Race within
each Census Tract
White, Non-Hispanic
Latino or Hispanic
Source: Esri Demographics, American Community Survey
Analysis: Bay Area Council Economic Institute
In many parts of Sonoma County, only about half of residents or fewer own a home.
County residents who live in Santa Rosa are less likely to own a home, as are residents in
parts of the southern and northeastern areas of the county. This makes them especially
vulnerable to market-wide effects of a shock to the housing stock such as the fires, as
supply becomes more restricted and rents may rise quickly. In addition to cost increases,
Sonoma County has also seen a reduction in the building of new homes and housing
units. The October 2017 fires only worsened the situation––with 2.5% of the county’s
housing stock being lost in damage and destruction to the fires. When looking at the
change in housing types over time, California Department of Finance data shows that
Sonoma County (and Santa Rosa in particular) saw a loss of single-family homes between
2011-2018, with 616 fewer single-family homes in Santa Rosa and 2,686 fewer single-
family homes across Sonoma County.
11Bay Area Council Economic Institute
Homeownership Rates for All Households in Sonoma County
Homeownership Rates for all
Households in Sonoma County
10% - 38%
39% - 58%
59% - 73%
74% - 94%
Source: Esri Demographics, American Community Survey
Analysis: Bay Area Council Economic Institute
Impediments to Increasing
Supply neighborhood is to building new housing, the more
costly it is for developers to build new housing
Rebuilding after the North Bay fires and building more (Economic Forensics and Analytics, Inc., 2018).
housing in general to address Sonoma County’s housing
affordability crisis is largely tied to the decision process According to ACS and Zillow Research data, home
of developers, as well as the controversial nature of and rental prices have been on the rise in cities across
building housing in California. Developer costs are Sonoma County since 2003, but median household
highly sensitive to permit costs, home and rental income has fallen between 2003-2016. Much like across
prices, land costs, design costs, environmental impacts, the rest of the Bay Area, this increase in costs is closely
construction costs and a number of other financial tied to the increase in demand for housing across the
and political factors––determining how much, if any region.
at all, should be built. Ultimately, the lower the cost to Understanding the barriers to building in Sonoma
develop, the more developers are incentivized to build. County also requires understanding the attitude of the
The political and social climate of building housing is county and surrounding region toward housing––one
shaped by a region’s perception of new housing as well that in Sonoma County has predominately been focused
as the role that density and diversity play in different on single-family homes. Data that compares the housing
rural and urban neighborhoods. The more controversy mix in 2000 and 2018 emphasizes this trend. The
around the topic of building housing, the less policy distribution of housing between multi-family and single-
change is feasible. Together, the more resistant a family units has hardly changed from 2000 to 2018.
12North Bay Fire Recovery
$
%
!
$!&#''' #'
''
'
'
'
'
'
$!&
&
'
"'
#'
'
'
!
#''' !
#' $!& $!&
#''' #'
13Bay Area Council Economic Institute
This change in Santa Rosa is particularly significant, as its population is the largest in
Sonoma County. Smaller cities, such as Petaluma and Rohnert Park, while not seeing net
losses, did not see significant surpluses in the building of new homes over the 7-year
period. Data on the permitting of new private residential structures across counties tells
a similar story, with fewer permits of new private residential structures in Sonoma, Napa,
Marin, Mendocino, and Lake counties between 2000 and 2017. Compared to Napa,
Marin, Mendocino, and Lake counties, however, Sonoma County has seen an uptick in
building permits since 2015, but the County still has a long way to go in reaching its
goals.
'
& " " "
% "%
"" (%"( *% $)))$)
$ ))
$ )))
))
)))
))
)
$))) $))
$))$ $))# $)) $)) $))! $)) $)) $)) $)
) $)
$)
$ $)
# $)
$)
$)
! $)
14North Bay Fire Recovery
2
The Economy of Sonoma County
The following chapter will present an overview of
State of Sonoma’s Economy Sonoma County’s economy, using several economic
In the aftermath of the fires, Sonoma County lost indicators to understand the economic status of the
several homes, businesses, and lives––all resulting in County prior to and post the 2017 fires. Where possible,
an economic loss for the county and surrounding area. this chapter also makes comparisons between Sonoma
Today, while the rebuilding effort has taken flight, much and the nine-county Bay Area region. Lastly, this chapter
is still needed to recuperate from the events of 2017–– will conclude by analyzing the economic status of
from rebuilding the County’s workforce to supporting Sonoma County residents by race, as well as attempt to
the financial impact the fires have had on households understand what the impact of the fires was according
and individuals. to one’s demographics.
15GDP growth
First, it is important to understand the state of Sonoma County’s economy prior to the
2017 fires and as it compares with the rest of the region. In 2017, the Santa Rosa metro
area’s GDP growth hovered just below that of San Francisco’s. In 2015 and prior, Santa
Rosa’s GDP growth was marginally higher than San Francisco’s. Still, three major metros
(San Francisco, San Jose, and Santa Rosa) across the Bay Area have a noticeably higher
GDP growth than the average for U.S. metros. This signals the strong economic growth
present within these metros across the region.
Dominant industries
Sonoma County’s seven largest industries include Information, Professional and
Business Services, Manufacturing, Leisure and Hospitality, Financial Activities, Trade,
Transportation and Utilities, Educational and Health Services, Government, and
Construction with its three largest industries being Trade, Transportation and Utilities,
Government, and Educational and Health Services.
16North Bay Fire Recovery
Industry Mix in Sonoma County (April 2019)
3%
11%
12%
7%
17%
17%
4% 1%
11%
15%
Other Services Leisure and Hospitality Educational and Health Services
Information Financial Activities Government
Professional and Business Services Trade, Transportation and Utilities Construction
Source: State of California Employment Development Department (2019)
Analysis: Bay Area Council Economic Institute
Compared to the nine-county Bay Area as a whole, Sonoma County has a larger share
of employees in the Trade, Transportation and Utilities industry. Despite being known
for its tourist and agricultural industries, Sonoma does not have a substantially higher
percentage of workers in Manufacturing or Leisure and Hospitality. While the Bay Area’s
industry mix is still very diverse, it does have a significantly larger share of jobs in the
Professional and Business Services industry.
Industry Mix in the Nine-County Bay Area (April 2019)
4% 14%
6%
11%
7%
15%
18%
24%
Leisure and Hospitality Information
Government Professional and Business Services
Trade, Transportation and Utilites Manufacturing
Construction Other Services
Source: State of California Employment Development Department
Analysis: Bay Area Council Economic Institute
17Bay Area Council Economic Institute
Income, wages, and employment
The economic vitality of the Bay Area is reflected in this chart, which shows at least a
$20,000 gap in median incomes in 2017.
////$//
'////$//
(////$//
////$//
////$//
*////$//
+////$//
////$//
/$//
+// +//
+/ / +/ +/ + +/ * +/ +/ +/ ( +/ ' +/
, ),%
% %
&! %) )
))&
% &&
,&
&& %-& , )
) %-&
&,%
&!) ). 0-%
,% , % ) )&)& "+/
#
.0% ,
&)),)
18North Bay Fire Recovery
On average, wages are highest for workers in Santa Clara County––the center of Silicon
Valley. This is particularly the case for workers in the Manufacturing industry. Conversely,
wages are on average the lowest for workers in Napa, Sonoma, and Solano counties.
Wages are especially low for Sonoma County workers in the Leisure and Hospitality
industry––where wages are the lowest overall.
'++++
'+++++
++++
+++++
++++
+
(&($
$ $
%! $&&
$ %%
%($
%!&
&* (&
&
&
&% (%
%% $)% $)%
,
&$ %& $
!
$
%
&
&
$
($( $ &&%&%"'+ #
* ,$ (
%&&(&
19Bay Area Council Economic Institute
Impact of the Fires on Employment
As expected, non-farm employment during the month of the fires (October 2017)
incurred a net loss of over 4,000 employees. Previously to the fires, monthly change was
largely in the positive, but in the months following, employment increases over time
were not as strong––possibly indicating the County’s difficulty in rebounding.
20North Bay Fire Recovery
%%%
!%%%
%%%
%
%%%
!%%%
%%%
&
$
"
"
&"
#
&
$
"
"
&"
#
&
"
"" #
& $
Unlike the data on non-farm employment, farm employment growth was exceptionally
strong, outside of the months following the fires, and again during the winter months in
2018. This might be more correlated with the lack of seasonal adjustment in the data,
rather than the effect of the fires. That being said, the agricultural industry was certainly
affected as several farms and farmers experienced damage.
21Bay Area Council Economic Institute
While individual monthly data on the major industries in Sonoma County do not show
a significant difference in the percentage breakdown over time, the above and below
charts more clearly depict how employment figures changed between the month of the
fires and the six months following. The notable increase in the Construction industry is
most likely tied to the County’s rebuilding effort; the same can be said for the uptick
in Professional and Business Services, as the County required more individuals to be
involved in several aspects of the restoration process.
22North Bay Fire Recovery
When looking a year out, employment change in Sonoma’s top industries show
significant improvements, again most notably in the Professional and Business Services
and Construction industries. Unlike in the six months after the fires, data from a year out
from the fires showcases growth in every major industry aside from Mining and Logging,
Information, and Government.
23Bay Area Council Economic Institute
The annual change in employment in Sonoma County over a four-year period paints a
fuller picture. Construction and real estate represented the largest growth percentages
in employment, while educational services saw the largest decline in employment at a
loss of 2.15% annually.
24North Bay Fire Recovery
Business Dynamics
Another indicator for tracking the economic recovery of Sonoma is through accessing
business license data or understanding the number of registered businesses over time.
The number of registered businesses in Santa Rosa in January 2019 is significantly larger
than during the month of the fires.
25Bay Area Council Economic Institute
Commute Flows of the County to work around the region. This might be
given the diverse array of industries present in Sonoma,
The industry mix and employment data align well allowing for individuals of diverse backgrounds to both
with the data on who works in the County and where live and work there. On the contrary, a little over 10% of
in the Bay Area Sonoma County residents work. An Sonoma County residents work in four counties where
overwhelming majority of Sonoma County residents the average salary is the highest in the Bay Area (Marin,
work in Sonoma, with less than 10% traveling outside San Francisco, San Mateo, and Santa Clara).
Likewise, a majority of individuals who work in Sonoma also live in the County.
26North Bay Fire Recovery
Understanding economic impact through an
equity lens
Understanding the economic impact of the fires on Sonoma County requires considering
the economic effects that natural disasters have on equity. The charts below help set the
stage for demographic comparisons.
Income and wages
,,,,
#,,,,
$,,,,
,,,,
,,,,
',,,,
(,,,,
,,,,
,
(,
, (,
(,
( (,
' (,
(,
(,
$ (,
#
& -" "
% &
")")! )-! )&+ )!*+
(,
#
+-! ) "&&)&
27Bay Area Council Economic Institute
We begin by looking at how income and wages effect individuals differently based on
their demographics. Over a 7-year period, the median income of Asian individuals was
overwhelmingly larger than the white, black, and Hispanic/Latino median. While the
median income for white and black individuals wavered within a $10,000 range, the
median income for Hispanic/Latino individuals has historically been the lowest, despite
seeing an uptick from 2016 to 2017.
28North Bay Fire Recovery
Household income presents a more rounded picture, again, however showcasing that
Asian households predominately have larger household incomes, with over 10% having
a household income over $150,000. Unlike in the median income chart, however, the
household income for black households that make between $80,000 and $100,000 is
larger than that of white households.
Compared to the 2010 data, the 2017 data on household income showed positive
changes, particularly for Hispanic households which overall had larger household
incomes in this year. To some degree, the same can be said for black households––
however no black households had a household income in the highest income bracket in
2017.
29Bay Area Council Economic Institute
Median Hourly Wages by Race
This chart tracks median hourly wages over time, indicating that the Hispanic median
has predominately been lower than the other medians present. Note that this data in
particular does not include an Asian median.
30North Bay Fire Recovery
Other important equity factors
Educational attainment
Wage and income data are strongly reflected by data on educational attainment, which
shows that in 2017, Asians had a higher percentage of Graduate/Professional degrees
than the other demographics. Roughly 24% of Asian individuals obtained a bachelor’s
degree, similar to the percentage of white individuals. Conversely, as the median income
and household income data above reflected, Hispanic individuals on the whole have
significantly fewer years of education than white, black, and Asian individuals; over 70%
of Hispanic individuals had a high school degree or less.
31Bay Area Council Economic Institute
Commute times
Previously, this chapter noted that a majority of residents in Sonoma County work in
Sonoma, and in turn, that many workers in Sonoma County live there as well. Likewise,
previous data in this chapter showed that the County has a fairly diverse set of industries.
The chart below tells us there is not a significant difference in travel time by race for
workers in Sonoma County.
32North Bay Fire Recovery
Industry
On the other hand, there are some significant differences present in the demographic
differences of industry workers in Sonoma County. In 2017, 34% percent of Hispanic
individuals were found working in the Agriculture industry, compared to 3% of Hispanic
individuals who worked in the Financial and Insurance & Real Estate industry. Asian
individuals were spread across relatively equally, where their highest participation was
found in the Educational Services and Health Care & Social Assistance industry at 26%.
White and black individuals were largely found in the Educational Services and Health Care
& Social Assistance industry with 23% and 37%, respectively.
33Bay Area Council Economic Institute
3
The Health of Sonoma County
Introduction Physical Health
The fires had devastating health impacts on the county, Physical health encompasses the wellbeing of an
including the loss of life. Countless others were treated individual from a physical perspective. With modern
for a variety of health reasons including for burns and medicines and treatments, physical health has improved
smoke inhalation. The catastrophic fires will likely have dramatically in recent times. However, many populations
long lasting impacts on the overall health of Sonoma still suffer from poor physical health, which is often a
County, which health departments, city officials and symptom of environmental, socio-economic, and other
residents of Sonoma County will need to monitor over external factors. We will take a deeper look into how
time. Sonoma County is impacted by these physical health
indicators.
The following chapter will take a deeper dive into the
overall health of Sonoma County. Using several health
indicators, this chapter will make comparisons between
Sonoma County and the rest of California where
applicable to assess the overall health of the county.
There will also be comparisons between gender, race
and other available demographic information. Lastly,
this chapter will attempt to understand potential future
health impacts from the fires and set a baseline for
health indicators for future analysis.
34North Bay Fire Recovery
Leading Cause of Death
Age-adjusted rates are used to compare the death County significantly exceeds California. Cancer is the
rates and hospitalizations of different diseases in leading cause of death in Sonoma County with an
Sonoma County and the entire state of California. Age- age-adjusted rate of 140.2 deaths per 100,000 people
adjusted rates standardize the population to make from 2015-2017. The age-adjusted death rates for
fairer comparisons between groups with different age lung cancer, suicide, and drug induced deaths are,
distributions. The age-adjusted rates for cancer, lung 29.3, 12.4, and 14.4 deaths per 100,000 population
cancer, suicide, and drug induced deaths in Sonoma respectively from 2015-2017.
Cause of Death - Physical and Behavioral Health - 2017
2015-2017 Average Age-Adjusted Death Age-Adjusted Death Rate
Disease
Deaths Rate (Sonoma County) (California)
All Cancers 978.3 140.2 137.4
Lung Cancer 204.3 29.3 27.5
Coronary Heart Disease 517.3 72.9 87.4
Chronic Lower Respiratory Disease 208.3 29.7 32.0
Suicide 69.0 12.4 10.4
Drug Induced Death 78.0 14.4 12.7
Source: California Department of Public Health, California Comprehensive Master Death Files, [2015-2017] Compiled, August 2018.
Analysis: Bay Area Council Economic Institute Notes: Rates are per 100,000 population
Asthma / COPD
During the fires, a tremendous amount of smoke and other carcinogens polluted the air
of Sonoma County and the rest of the Bay Area. Air quality is measured on a scale of
0-500, broken into six categories based upon ranges. The higher the level on the AQI,
the greater the level of air pollution and the greater the health concern. The table below
breaks down the different levels of the AQI and their respective impacts.
Air Quality Index
Level of Health Numerical
Level Meaning
Concern Value
1 Good 0-50 Air quality is considered satisfactory, and air pollution poses little
or no risk.
Air quality is acceptable; however, for some pollutants there may
2 Moderate 51-100 be a moderate health concern for a very small number of people
who are unusually sensitive to air pollution.
Unhealthy for Members of sensitive groups may experience health effects. The
3 101-150
Sensitive Groups general public is not likely to be affected.
Everyone may begin to experience health effects; members of
4 Unhealthy 151-200 sensitive groups may experience more serious health effects.
5 Very Unhealthy 201-300 Health alert; everyone may experience more serious health effects
Health warnings of emergency conditions. The entire population is
6 Hazardous 301-500
more likely to be affected
35Bay Area Council Economic Institute
In the wake of the fires, the Environmental Protection Agency’s (EPA) air quality index
(AQI) for the nine-county Bay Area was 160, which is classified as “Unhealthy” – higher
than Beijing’s reading of 122 on that same day. In parts of Santa Rosa, near the epicenter
of the fires, the air quality reached level 5 with an AQI greater than 201, which is
classified as ‘Very Unhealthy’. Constant and prolonged exposure to the poor air quality
can worsen respiratory issues and trigger asthma attacks. There were high readings of
PM2.5, a particulate that penetrates and lodges deep into the lungs, which can have
short-term and long-term adverse health impacts. The long-term effects of the polluted
air will take time to observe completely, but preliminary analysis has shown an increase
in the prevalence and severity of these respiratory issues.
Asthma
Sonoma County California
Prevalence 16.3% 14.8%
Rate of Emergency Department Visits 41.6 46.9
Rate of Hospitalizations 3.8 4.7
Death Rate 5.9 9.6
Source: California Health Interview Survey (CHIS); California Department of Public Health
(2018)
Analysis: Bay Area Council EconomicAsthma
Institute Notes: Deaths are for the years 2014-2016,
Rates are per 100,000 people. Death rates are per 1,000,000 people.
Sonoma County California
Prevalence 16.3% 14.8%
Rate of Emergency Department
Cardiovascular Disease Visits 41.6 46.9
Cardiovascular Disease
Rate of Hospitalizations 3.8 4.7
Cardiovascular disease refers to a set of health conditions that involve narrowed or
Death Rateblood vessels that can
blocked Sonoma
lead toCounty 5.9 or stroke.
a heart attack California 9.6 Males
Additionally, diseases
Females
that affect the heart’s rhythm (arrhythmia), muscle and valves are also considered forms N/A
Deaths 901 62,800 N/A
Source: California Health Interview Survey (CHIS); California Department of Public Health
Death
of
(2018) Rate
cardiovascular 125.8 disease is the leading
disease. Cardiovascular 141.8cause of death
167.8 in the 95.4
United
Analysis: States.
Bay It is also
Area Council the second
Economic leading
Institute cause
Notes: of are
Deaths death in Sonoma
for the County, behind
years 2014-2016,
cancer.
Rates are per 100,000 people. Death rates are per 1,000,000 people.
Source: CDC Wonder API ; UCD codes: [I00-I02,I05-I09,I11,I13,I20-I25,I26-I28,I30-I51]
Analysis: Bay Area Council Economic Institute Notes: Rates are per 100,000 population
Cardiovascular Disease
Sonoma CountyCancer California Males Females
Deaths 901 62,800 N/A N/A
Sonoma County California
Death Rate 125.8 141.8 167.8 95.4
Incidence Rate 427.9 381.6
Death Rate (Male) 152.0 159.5
Source: CDC Wonder API ; UCD codes: [I00-I02,I05-I09,I11,I13,I20-I25,I26-I28,I30-I51]
Death Rate (Female) 132.6 120.2
Analysis: Bay Area Council Economic Institute Notes: Rates are per 100,000 population
Death Rate 145.0 140.0
Source: California Cancer Registry (2016), CDC Wonder API; UCD code: [C00-C97]
Cancer
Analysis: Bay Area Council Economic Institute Notes: Rates are per 100,000 people
36
Sonoma County California
Incidence Rate 427.9 381.6
Death Rate (Male) 152.0 159.5
Death Rate (Female) 132.6 120.2Rate of Hospitalizations 3.8 4.7
Death Rate 5.9 9.6
Source: California Health Interview Survey (CHIS); California Department of Public Health
North Bay Fire Recovery
(2018)
Analysis: Bay Area Council Economic Institute Notes: Deaths are for the years 2014-2016,
Cancer Rates are per 100,000 people. Death rates are per 1,000,000 people.
Cancer of all types is a leading cause of death in biological differences, access to medical care and other
Sonoma County. Approximately 145 deaths per 100,000 complex factors such as air pollution. By the Census
residents can be attributed to cancer in Sonoma County. definition of race, Black or African American individuals
Across the United States, the incidence rate of cancer Cardiovascular Disease
have the highest rate of cancer mortality nationally. In
has remained stable, meanwhile, the overall mortality 2017, white individuals in Sonoma County experienced
Females
rate has been steadily decreasing. In wakeSonoma County the highest
of the fires, California Males
level of cancer mortality with 145 deaths per
Deaths
the long-term impacts such as cancer incidence 901 rates 62,800
100,000 people, N/A than the California
which was higher N/A
Death
will take several Rate
years to truly gauge the severity.125.8 141.8deaths per167.8
average of 143.6 100,000 people.95.4
Asian
or Pacific Islander individuals had the second highest
From a national context, cancer is one of the leading rates of cancer mortality with 93.9 deaths per 100,000
Source:
causes of death. CDC
Most Wondermales
notably, API ; suffer
UCD codes: [I00-I02,I05-I09,I11,I13,I20-I25,I26-I28,I30-I51]
significantly people. Cancer greatly affects people who are 65+
higher mortality ratesBay
Analysis: Area
from Council
cancer thanEconomic
women. Institute
This canNotes: Rates
years are per
of age 100,000
more population
than any other age group.
be attributed to engagement in risky behavior,
Cancer
Sonoma County California
Incidence Rate 427.9 381.6
Death Rate (Male) 152.0 159.5
Death Rate (Female) 132.6 120.2
Death Rate 145.0 140.0
Source: California Cancer Registry (2016), CDC Wonder API; UCD code: [C00-C97]
Analysis: Bay Area Council Economic Institute Notes: Rates are per 100,000 people
Obesity
Obesity is an ongoing epidemic across the United obesity including, lack of exercise, poor diet, stress, and
States, and often results in several other co-morbidities. genetics.Obesity is an underlying risk factor for diabetes
Obesity occurs when the body mass index (BMI) of (Type 2, specifically), heart attack, stroke and some
an individual is greater than 30, and reflects that the cancers. The percentage Californians who are obese is
weight of an individual is significantly higher than what higher than the percentage of Sonoma County residents
is considered a healthy weight given the individual’s who are obese. This indicates that residents in Sonoma
height. There are many factors that contribute to County are generally healthier.
Adult Obesity
Sonoma County California
Prevalence 20.0% 23.0%
Source: Behavioral Risk Factor Surveillance System (BRFSS) 2018
Analysis: Bay Area Council Economic Institute
37
Diabetes in Sonoma County
Sonoma County Males Females
Prevalence 6.0% 6.6% 6.4%Bay Area Council Economic Institute
Diabetes Adult Obesity
Diabetes is a disease caused by the inability of the There are two types of diabetes that affect individuals.
Sonoma County
body to produce or use insulin effectively thus resulting
California
Type 1 diabetes is an auto-immune disease where an
Prevalence 20.0%
in high sugar (glucose) blood levels. Insulin allows the 23.0%body is unable to produce insulin. Thus,
individual’s
blood sugar to enter cells that make up the muscles individuals with type 1 diabetes must take insulin their
andSource:
tissuesBehavioral
to be usedRisk
for energy. This is also the main
Factor Surveillance System (BRFSS)entire
2018 lives to survive. 85+ year olds have exponentially
source of fuel for the brain. Excess glucose can lead to higher rates of mortality from diabetes than any other
Analysis: Bay Area Council Economic Institute
serious health problems such as heart attack, stroke, etc. age group.
Diabetes
Sonoma County Males Females
Prevalence 6.0% 6.6% 6.4%
Incidence Rate 5.2 N/A N/A
Death Rate 61.8 90.9 51.4
Source: CDC Wonder API ; Behavioral Risk Factor Surveillance System (BRFSS)
Analysis: Bay Area Council Economic Institute Notes: Rates are per 100,000 population. Incidence rate is per
1,000 population
Suicide
Sonoma County Males Females
Behavioral
Deaths Health 69
Psychological Distress
N/A N/A
TheDeath There have been tremendous psychological impacts on
Rate
adverse health effects of the fires are not only felt 12.4 19.1 N/A
physically, but psychologically as well. The devastating Sonoma County residents, particularly those who were
impacts have taken a toll on many residents of the directly affected by the fires. These impacts on people’s
in aCDC
Source:
County Wonder
variety APIthat
of ways 2017
haveUCD codes: X60-X84,
short-term and Y87.0.
lives, or risk factors, can be physical injury, damage
to property, loss of property or place of employment,
Analysis:
long-term Bay Area
impacts. Council
Mental Economic
health Institute
includes Notes: Rates are per 100,000 population
emotional,
behavioral and social well-being. This ranges from and loss of a relative or friend. While most stress
grieving for family and friends who lost their lives, symptoms are temporary, some have longer lasting
facing the realities of the loss of their residence and symptoms that adversely affect a person’s livelihood.
belongings, increased anxiety of another fire and Post-Traumatic Stress Syndrome (PTSD) is commonly
resulting coping complications such as substance present in individuals after a disaster such as a wildfire.
abuse. Behavioral health is a critical factor in the overall PTSD has several risk factors and symptoms that are
recovery and health of the County. unique to each individual’s trauma. PTSD symptoms
include feeling helpless or hopeless, loss of appetite,
excessive smoking, drinking, drug use and prescription
medications, difficulty readjusting to work or school and
several other signs of emotional distress.
38Incidence Rate 5.2 N/A N/A
Death Rate 61.8 90.9 51.4
Source: CDC Wonder API ; Behavioral Risk Factor Surveillance System (BRFSS) North Bay Fire Recovery
Analysis: Bay Area Council Economic Institute Notes: Rates are per 100,000 population. Incidence rate is per
1,000 population
Suicide
Suicide
Sonoma County Males Females
Deaths 69 N/A N/A
Death Rate 12.4 19.1 N/A
Source: CDC Wonder API 2017 UCD codes: X60-X84, Y87.0.
Analysis: Bay Area Council Economic Institute Notes: Rates are per 100,000 population
Suicide is an ever-present issue in the United States, and Nationally, men are more significantly likely to commit
is now the tenth leading of cause of death in the nation. suicide than females. This may be attributed to a
In 2017, over 47,000 Americans took their own lives. variety of factors beyond gender differences including
There were 69 deaths by suicide in Sonoma County in psychological and cultural differences. This finding is
2017. The death rate by suicide greatly exceeds the ever-present in Sonoma County as the death rate by
average death rate in California with a rate of 12.4 suicide for males is drastically higher than the death
deaths per 100,000 in Sonoma County and 10.5 deaths rates for females. The suicide mortality rates for males
per 100,000 in California. in Sonoma County is 19.1, whereas the suicide mortality
rate for females in Sonoma County is too low to be
accounted for.
Excessive Drinking / Impaired Driving
Excessive Drinking
Sonoma County California
% of adults reporting binge or heavy drinking 19% 18%
DUI Incidents 2,612 266,388
Alcohol Impaired Traffic Deaths (%) 37% 30%
Source: Behavioral Risk Factor Surveillance System (BRFSS) 2018
Analysis: Bay Area Council Economic Institute
In wake of the fires, many individuals have turned deaths than California. Thirty-seven percent of all traffic
to alcohol and other substances to cope with theOpioids related deaths were due to alcohol impairment. Sonoma
devastating impacts from the fire. In 2017, 19% of County has focused on addressing this issue with the
adults in Sonoma County reported binge or heavy Alcohol & Other Drug Prevention Strategic Plan (2015-
drinking, which is slightly higher than the percentage
Sonoma County California
2020) to improve health outcomes related to substance
Prescriptions
of Californians. However, Sonoma County suffered abuse. 346,619 19,808,224
from Rate of percentage
a higher Emergency of Department Visits
alcohol impaired traffic 45.4 21.4
Rate of Hospitalizations 5.7 8.3
Death Rate 6.7 5.5
39
Source: California Health Interview Survey (CHIS); California Department of Public Health (2018)
Analysis: Bay Area Council Economic InstituteAlcohol Impaired Traffic Deaths (%) 37% 30%
Council Behavioral
Bay Area Source: Risk Factor Surveillance System (BRFSS) 2018
Economic Institute
Analysis: Bay Area Council Economic Institute
Opiates and Other-Drug Use
Opioids
Sonoma County California
Prescriptions 346,619 19,808,224
Rate of Emergency Department Visits 45.4 21.4
Rate of Hospitalizations 5.7 8.3
Death Rate 6.7 5.5
Source: California Health Interview Survey (CHIS); California Department of Public Health (2018)
Analysis: Bay Area Council Economic Institute
There is currently an opioid epidemic in the United which is a cause for concern. Especially in wake of the
States. This epidemic affects all ages, genders, races/ fires, which may have exacerbated this problem as
ethnicities across all income levels. The death rates from individuals turn to opioids to cope with the devastating
opioids has steadily been increasing in recent years. As impacts from the fires. The death rates have fluctuated
of 2018, there were 346,619 prescriptions for opioid since 2006, but there has been a steady increase from
medications in Sonoma County. There were 41 deaths 2016 to 2018. In 2018 the death rate from opioids
attributed to opioid use of any kind in 2017. The death spiked from 6.0 to 6.7 deaths per 100,000 people,
rate from opioids exceeds the death rate of Californians, though any link to the fires is unknown.
Overdose Death Rates - Per 100k Residents - Sonoma County
12
10 9.6 9.7
8.9
8
6.8 6.7
6.5
6.0
6 5.7
5.4
5.1
4.8
4.5
4
2.3
2
0
2006 2007 2008 2009 2010 2011 2012 2013 2014 2015 2016 2017 2018
Source: CDPH Vital Statistics Multiple Cause of Death and California Comprehensive Death Files, Annual Not Seasonally Adjusted
Analysis: Bay Area Council Economic Institute
40North Bay Fire Recovery
Access to Healthcare healthcare serves a primary factor in raising health
awareness, preventing and managing disease, reducing
A key indicator of the health of the county is the premature death rates, and maintaining overall health.
access to healthcare. Access to healthcare impacts the Having access to healthcare allows individuals to enter
overall physical health, mental health and quality of the health care system and find local providers to meet
life of residents. The access to quality, comprehensive their healthcare needs.
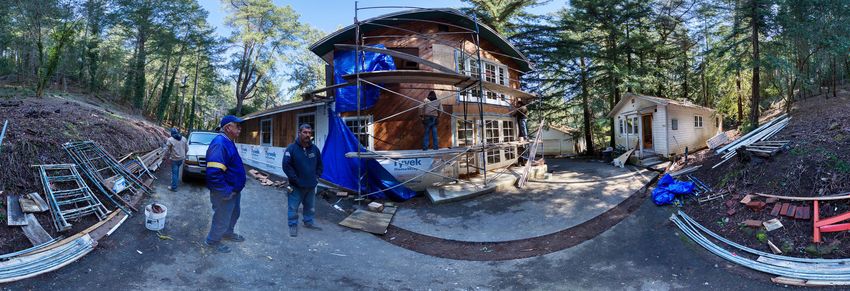
According to the American Community Survey, 93% of Sonoma County’s population had
health insurance coverage of any kind in 2017. By race, Asian and White populations
had the highest levels of health insurance coverage. Black or African Americans, Latinos
and other ethnicities experienced lower levels of health insurance coverage in Sonoma
County.
Primary Care Physicians Primary Care Physicians
Ratio of population to primary care physicians
Sonoma County has significantly greater access to
990:1
primary care physicians than Californians as a whole.
This is a positive reflection for the overall health of
Sonoma County.
in Sonoma County
1,270:1 in California
41Bay Area Council Economic Institute
Mental Health Providers
Mental Health Providers
Sonoma County has significantly greater access to Ratio of population to mental health providers
mental healthcare providers than Californians as a
230:1
whole. This is crucial as adverse psychological effects
from the fires have and will continue to have long-
lasting impacts on the mental health of all affected
individuals in the county.
in Sonoma County
310:1 in California
Crime in Sonoma County
The last set of indicators to measure the community safety and health of Sonoma County
is crime—more specifically, interpersonal violence, which includes child neglect and
domestic violence, and neighborhood crime rates. These indicators have short-term and
long-term implications for the health of Sonoma County.
496(*#*'78*6
** &;743#
&,69)*6You can also read