On the use of direct-coupling analysis with a reduced alphabet of amino acids combined with super-secondary structure motifs for protein fold ...
←
→
Page content transcription
If your browser does not render page correctly, please read the page content below
Published online 22 April 2021                                                      NAR Genomics and Bioinformatics, 2021, Vol. 3, No. 2 1
                                                                                                              doi: 10.1093/nargab/lqab027

On the use of direct-coupling analysis with a reduced
alphabet of amino acids combined with
super-secondary structure motifs for protein fold
prediction
Bernat Anton1 , Mireia Besalú2 , Oriol Fornes 1,3 , Jaume Bonet1,4 , Alexis Molina5 ,
Ruben Molina-Fernandez1 , Gemma De las Cuevas6 , Narcis Fernandez-Fuentes7,8,* and

                                                                                                                                                                  Downloaded from https://academic.oup.com/nargab/article/3/2/lqab027/6246168 by guest on 08 October 2021
Baldo Oliva 1,*
1
  Structural Bioinformatics Lab (GRIB-IMIM), Department of Experimental and Health Science, University Pompeu
Fabra, Barcelona 08005, Catalonia, Spain, 2 Departament de Genètica, Microbiologia i Estadı́stica, Universitat de
Barcelona, Barcelona 08028, Catalonia, Spain, 3 Centre for Molecular Medicine and Therapeutics, Department of
Medical Genetics, BC Children’s Hospital Research Institute, University of British Columbia, Canada, 4 Laboratory of
Protein Design and Immunoengineering, School of Engineering, Ecole Polytechnique Federale de Lausanne,
Lausanne 1015, Vaud, Switzerland, 5 Electronic and Atomic Protein Modeling, Life Sciences, Barcelona
Supercomputing Center, Barcelona 08034, Catalonia, Spain, 6 Institut für Theoritische Physik, School of
Mathematics, Computer Science and Physics, Universität Innsbruck. A-6020 Innsbruck, Austria, 7 Institute of
Biological, Environmental and Rural Sciences, Aberystwyth University, SY233EB Aberystwyth, United Kingdom and
8
  Department of Biosciences, U Science Tech, Universitat de Vic-Universitat Central de Catalunya, Vic 08500,
Catalonia, Spain

Received September 23, 2020; Revised February 27, 2021; Editorial Decision March 22, 2021; Accepted March 26, 2021

ABSTRACT                                                                          structure modelling, achieving near native conforma-
                                                                                  tions when the number of super-secondary motifs
Direct-coupling analysis (DCA) for studying the
                                                                                  covers >30–50% of the sequence. Interestingly, al-
coevolution of residues in proteins has been
                                                                                  though different contacts are predicted with different
widely used to predict the three-dimensional struc-
                                                                                  alphabets, they produce similar structures.
ture of a protein from its sequence. We present
RADI/raDIMod, a variation of the original DCA al-
gorithm that groups chemically equivalent residues                                INTRODUCTION
combined with super-secondary structure motifs to
                                                                                  Protein structure is conserved through evolution, as pro-
model protein structures. Interestingly, the simplifi-                            tein function is structure dependent (1). The reason for such
cation produced by grouping amino acids into only                                 conservation is due to energetically favorable interactions
two groups (polar and non-polar) is still representa-                             between specific protein residues, which implies that there
tive of the physicochemical nature that characterizes                             must be a certain degree of coevolution between the residues
the protein structure and it is in line with the role of                          responsible for both the function and fold of all the mem-
hydrophobic forces in protein-folding funneling. As                               bers of a protein family (2). In the last decade, several au-
a result of a compressed alphabet, the number of                                  thors developed the mean field approximation for direct-
sequences required for the multiple sequence align-                               coupling analysis (DCA), either by solving an inverse co-
ment is reduced. The number of long-range contacts                                variance matrix (3) or by using a pseudo-likelihood-based
predicted is limited; therefore, our approach requires                            approach (4,5) to compute direct information (DI) values
                                                                                  (6) and detect correlated positions of the sequence (for a
the use of neighboring sequence-positions. We use
                                                                                  review see (7)). The implementation of an L2-regularized
the prediction of secondary structure and motifs of                               pseudo-likelihood to compute the DI between amino acid
super-secondary structures to predict local contacts.                             positions of protein sequences has also implied a large re-
We use RADI and raDIMod, a fragment-based protein                                 duction of the computational time (8). These correlations

* To
   whom correspondence should be addressed. Fax: +34 933160550; Email: baldo.oliva@upf.edu
Correspondence may also be addressed to Narcis Fernandez-Fuentes. Email: narcis@bioinsilico.org

C The Author(s) 2021. Published by Oxford University Press on behalf of NAR Genomics and Bioinformatics.
This is an Open Access article distributed under the terms of the Creative Commons Attribution-NonCommercial License
(http://creativecommons.org/licenses/by-nc/4.0/), which permits non-commercial re-use, distribution, and reproduction in any medium, provided the original work
is properly cited. For commercial re-use, please contact journals.permissions@oup.com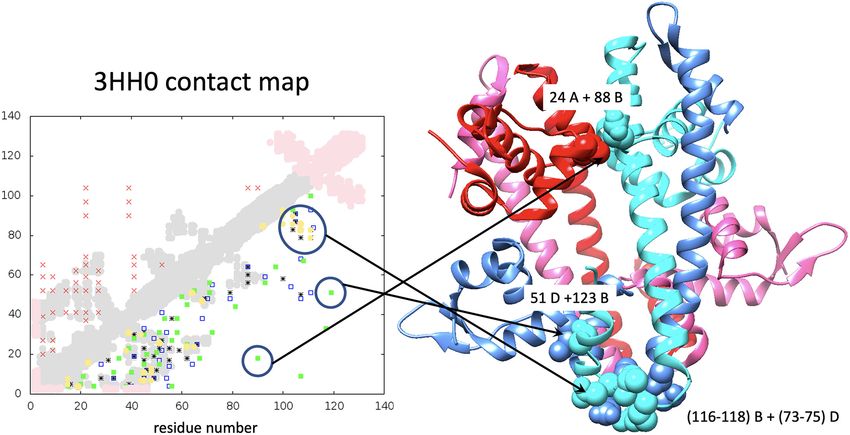
2 NAR Genomics and Bioinformatics, 2021, Vol. 3, No. 2

are reflected by co-evolution and are potentially due to the       Reduced alphabet
spatial proximity of the residues, thereby helping to infer the
                                                                   RADI simplifies the computation of DI values by trans-
contact map of a protein family (9). This has been used to
                                                                   forming the entire alphabet of q = 21 symbols (i.e. the 20
improve protein models (10,11), predict the structure of pro-
                                                                   different amino acids plus the gap) into a reduced alpha-
teins (12,13) or predict the structure of homo-dimers (14).
                                                                   bet. For instance, using an alphabet of q = 21 (henceforth
The theory underlying DCA is based on the Potts model
                                                                   named RA0) in RADI is equivalent to using the original
(15) and recent studies have shown that the number of Potts
                                                                   DCA algorithm. We create three reduced alphabets (hence-
states can be compressed without affecting the quality of re-
                                                                   forth named RA1, RA2, and RA3) by grouping amino acids
construction (16). Furthermore, the compression of the al-
                                                                   based on different physicochemical properties (Table 1). We
phabet has been used to include the three-body interaction
                                                                   also define the number of effective sequences as the num-
terms on the calculation of DCA, reducing not only the time
                                                                   ber of sufficiently different sequences (i.e.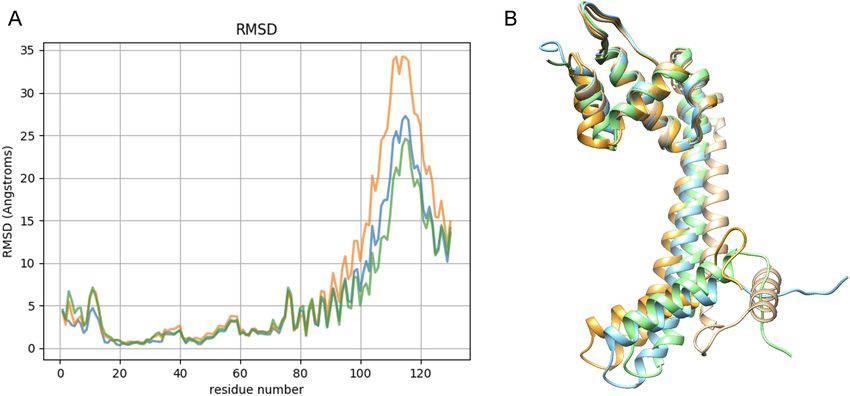
NAR Genomics and Bioinformatics, 2021, Vol. 3, No. 2 3
Table 1. Classification of amino acids into groups for the three reduced alphabets RA1, RA2 and RA3. The second column shows the number of q symbols
of the corresponding reduced alphabet
Type Q Amino acid groups
RA1 9 Positively charged: {Arg, His, Lys}. Negatively charged: {Asp, Glu}. Polars: {Ser, Thr, Asn, Gln}. Aliphatics: {Ala,
Ile, Leu, Met, Val}. Aromatics: {Phe, Trp, Tyr}. Single groups: {Cys}, {Gly}, {Pro} and the gap
RA2 5 Polar: {Arg, His, Lys, Asp, Glu, Ser, Thr, Asn, Gln, Cys}. Non-polar: {Ala, Ile, Leu, Met, Val, Phe, Trp, Tyr}. Single
groups: {Gly}, {Pro} and the gap
RA3 3 Polar: {Arg, His, Lys, Asp, Glu, Ser, Thr, Asn, Gln, Cys, Gly}. Non-polar: {Ala, Ile, Leu, Met, Val, Phe, Trp, Tyr,
Pro}. Single groups: gap
of the secondary structures. Interestingly, specific residues Comparison of top DI and MI pairs with respect the contact
are often preserved in certain positions of the sMotifs in a map
Downloaded from https://academic.oup.com/nargab/article/3/2/lqab027/6246168 by guest on 08 October 2021
class/cluster (often in the loop or in its regions at the stems
We compare both RADI and the original DCA algorithm
with regular secondary structure). These sequence-profiles
on the same set of 509 different proteins from (3), hereafter
are used to detect and align the target sequence with the
defined as benchmark. The benchmark contains 78 different
sMotif structural templates.
protein families from 50 different folds in SCOP (30). Pro-
The sequence of the proteins is used to compute the DI
tein sequences and three-dimensional structures are down-
and select for each alphabet the top 40 pairs of residues with
loaded from the RCSB Protein Data Bank (PDB) (31). As
the higher correlation. The structures of sMotifs aligned
an example, Figure 1A shows the contact map for molyb-
to the target sequence are used as templates for homol-
date binding protein (PDB code 1ATG), compared with the
ogy modelling with MODELLER (27). We add distance re-
top 40 DI (and MI) values using the original DCA algo-
straints between the pairs of amino acids selected, constrain
rithm (i.e. RA0) and the reduced alphabets RA1 and RA3.
the secondary structure predicted with SABLE and gen-
For the whole benchmark (see details in Supplementary
erate 10000 structural models that are subsequently clus-
Data), we compare the distribution of the number of true
tered and scored. The protocol to run MODELLER is as
positive contacts (Figure 1B). The average of true positives
follows: (i) we use as templates the structures of the pre-
across the 509 proteins varies between 29 (for RA3) and 35
dicted sMotifs; (ii) apply constrains at 8Å using a Gaus-
(for RA0) and, although all distributions are significantly
sian potential on the C-C atoms of the selected residue-
different, alphabets with RA0 and RA1 classifications are
pairs with highest correlation; and (iii) we force the type
only slightly better than RA2 and RA3. Furthermore, the
of secondary structure as mapped by the prediction of sec-
average number of similar top pairs of classifications RA1,
ondary structure. Finally, we rank the models with DOPE
RA2 and RA3 with respect to RA0 varies between 19 and
(28) and cluster them by similar structure, evaluate the qual-
29, with >20 equivalent pairs between RA1 and RA0 for
ity of the models with Prosa2003 (29) and select the best
most proteins of the benchmark (Figure 1C).
scored structures. The scripts to automate the search of
In Figure 2 we compare the success of contact predictions
sMotif templates and construct the inputs for fragment-
using MI with alphabets RA0, RA1, RA2 and RA3 (Figure
based modelling with MODELLER are accessible in https:
2A) and the number of residue-residue pairs among the top
//github.com/structuralbioinformatics/raDIMod.
40 MI values using RA1, RA2 and RA3 equivalent to the
pairs among the top 40 MI results when using RA0 (Fig-
ure 2B). We conclude that the number of correct contact
Hardware predictions using MI is similar for all alphabets (the aver-
To enable the benchmarking, RADI has been tested on the age is around 30 correct pairs) but lower than the number
queues of a cluster with the same CPU: 2 AMD Opteron obtained with DI and RA0, while the distributions of equiv-
4226 hexacore of 2.9 Ghz CPU with 64 GB RAM. The same alent pairs between the entire alphabet RA0 and any of the
CPU has been used for the comparison with CCMPred. alphabets RA1, RA2, RA3 are similar to those obtained
with DI. Interestingly, the success of MI contact predictions
with RA2 and RA3 is higher than using DI for the same
RESULTS alphabet. However, the distribution of pairs ranked at the
top of MI along the sequence of each protein are clustered
The modification of the alphabet results in different ma- in in local regions, i.e. short range restraints, which is not
trices of DI values. Nevertheless, we show that regardless as helpful as long-range restraints for structural modelling
of the alphabet, the top 40 pairs similarly hit equivalent purposes (see supplementary contact maps provided in the
residueñresidue contacts with all three alphabets, while re- GitHub repository and models in the supplementary files of
ducing the number of symbols (q) reduces the execution the manuscript).
time and reduces the number of sequences of the MSA (af-
ter reducing the alphabet many sequences become redun-
Protein structure model building
dant and are removed from the alignment). We selected a
limit of 40 top pairs as in the work of Morcos et al. (9), One important applications of the calculation of co-
although for the comparison with CCMPred (8) often no evolving residues is using the highly correlated pairs to de-
>30 pairs are automatically selected (i.e. the maximum by fine contact constraints and thereby model the structure of
default). a protein. As a proof of concept, we use the 40 top pairs of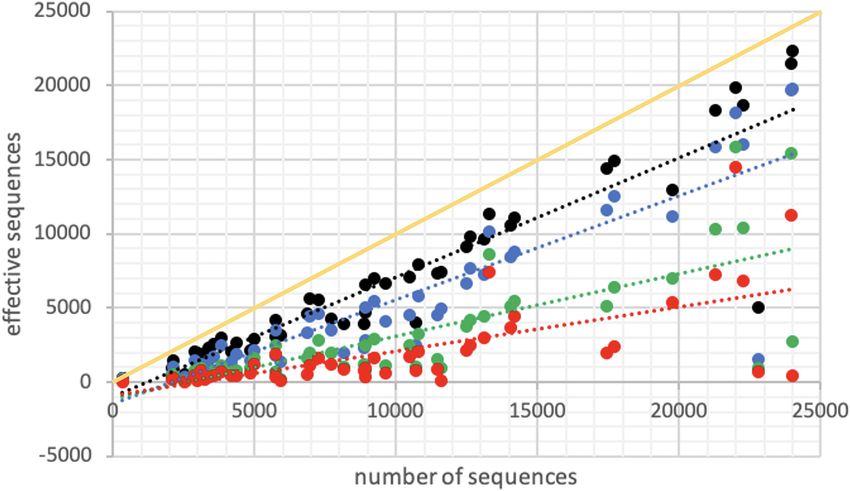
4 NAR Genomics and Bioinformatics, 2021, Vol. 3, No. 2
Downloaded from https://academic.oup.com/nargab/article/3/2/lqab027/6246168 by guest on 08 October 2021
Figure 1. (A) Example of residue-residue contact predictions for Molybdate binding protein (PDB code: 1ATG). Real contacts are shown in grey (or pink
if not sufficiently covered by the MSA). Red crosses show the top 40 pairs sorted by MI values using RA0. Under the diagonal are shown the top 40 pairs
sorted by DI values using different amino acid alphabets: RA0 (black stars); RA1 (unfilled blue squares); and RA3 (green squares). (B) Boxplots of the
distribution of the number of true positive contacts within pairs of positions with top 40 DI values. The boxplots show the distributions obtained by RADI
with alphabets RA0, RA1, RA2 and RA3. (C) Boxplots of distribution of the number of residue-residue pairs in the top 40 DI values (for RA1, RA2 and
RA3) equivalent to ones among the top 40 DI values with RA0.
Figure 2. (A) Boxplot of the distribution of the number of true positive contacts within pairs of positions with the 40 top MI values. (B) Boxplots of the
distribution of the number of residue–residue pairs in the 40 top MI values (for RA1, RA2 and RA3) equivalent to ones among the top 40 DI values with
RA0.
residues with higher DI values using alphabets RA0, RA1, of around 5Å for the three models. The RMSD of C␣ atoms
RA2, RA3 to model the structures of Molybdate binding is also below 5Å in a core region of the three models.
protein (with PDB code: 1ATG). We use a total of 26 tem- Encouraged by the positive outcome, we apply the same
plate sMotifs covering 68% of the total sequence (see de- approach on a much larger set composed of proteins from
tails in Supplementary Material). The structural superpo- 50 different folds of the benchmark and analyzed the qual-
sition of the models of Molybdate binding protein and the ity of the models (see details in Supplementary Table S1
crystallographic structure show the quality of the models, and the set of models in the Supplementary Material). The
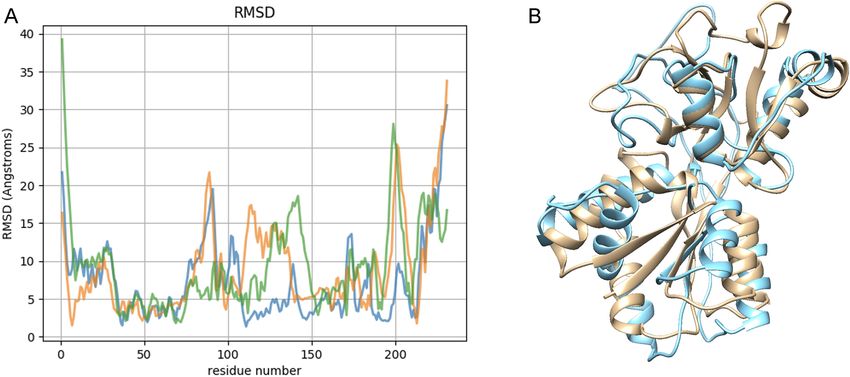
which can be quantified per residue by the RMSD of C␣ RMSD of 10 selected models from the benchmark (5 best
atoms (see Figure 3). We note that all models are signif- and 5 worst out of 50 examples) obtained with restraints
icantly good and similar to the crystallographic structure derived by RA0, RA1 or RA3 alphabets are shown in Ta-
(TM-score around 0.5), although they are generated with ble 2. We also indicate the number of sMotif-templates, the
different distance restrictions obtained using either RA0, percentage of the target sequence covered by them and the
RA1 or RA3 alphabets (see Supplementary Table S1 in Sup- Z-score calculated with ProSa2003.
plementary Material). The total RMSD with TM-align (32) As expected, Table 2 shows that the best results are ob-
also quantifies the structural similarity, proving deviations tained with a large coverage of the sequence by sMotifs.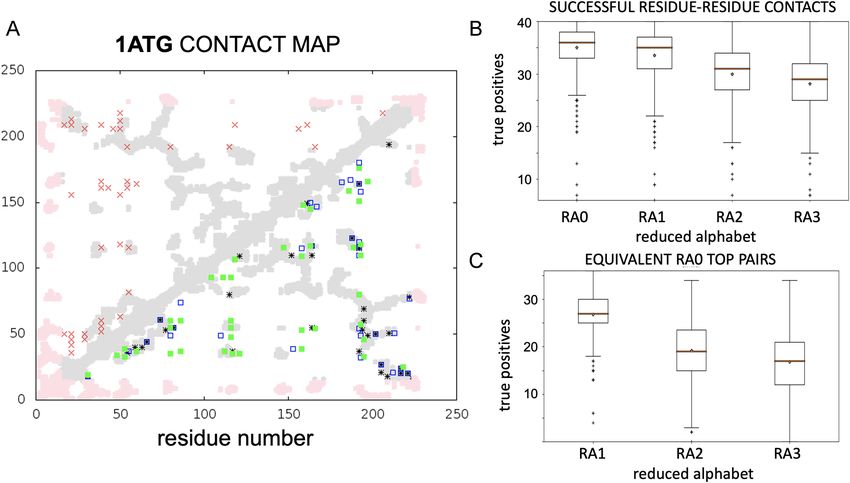
NAR Genomics and Bioinformatics, 2021, Vol. 3, No. 2 5

                                                                                                                                                          Downloaded from https://academic.oup.com/nargab/article/3/2/lqab027/6246168 by guest on 08 October 2021
Figure 3. (A) RMSD of C␣ atoms between the modelled structures of Molybdate binding protein on the crystal structure using distance restraints obtained
with alphabets RA0 (blue), RA1 (orange) and RA3 (green). (B) Superimposition of the modelled structures of Molybdate binding protein obtained with
different alphabets RA0 (blue) on the crystal structure (sand color).

Table 2. Comparison of selected models with the crystallographic structures: five best (in green background) and five worst (in red background) models
out of 50 different folds from the benchmark (the remaining set is shown in Supplementary Table S1). Columns 2–7 show the ProSa2003 Z-score of each
model, the RMSD and the TM-score between the model and the crystallographic structure, calculated with TM-align (32). Models are built with spatial
restraints derived from the 40 top DI values using RA0 and RA3 alphabets. The last three columns show the length (L) and percentage (C) of the target
sequence covered by templates from the classification of sMotifs and the total number of sMotifs used (M)

                                RA0                                                  RA3
PDB          TM RMSD          TM Scr        Prosa Z-scr        TM RMSD              TM Scr          Prosa Z-scr           L            C          M
1N9L              1.4            0.9           -6.3                1.7                0.9               -5.8             109          0.95        61
1H98              1.6            0.8           -7.0                1.8                0.8               -6.5             77           0.88        15
1FR3              2.1            0.8           -4.4                2.1                0.7               -5.0             67           0.70         5
1LSS              2.6            0.8           -7.6                2.3                0.9               -7.8             132          0.96        25
1C02              3.0            0.7           -6.0                3.6                0.4               -4.0             166          0.53         4
1G60              5.8            0.2           -1.6                5.6                0.2               -0.3             238          0.37         8
1FEP              7.8            0.2           -1.6                8.4                0.2               -2.4             669          0.52        45
1B7E              7.1            0.2            0.9                7.0                0.3               -1.1             372          0.45        12
1A0P              5.2            0.2            2.4                7.3                0.2                0.0             271          0.16         4
1QKS              6.9            0.2           -2.3                7.5                0.2               -2.5             559          0.05         3

There is a small but significant correlation between the qual-                RA3 and RA1 were of similar quality to those obtained
ity of the models and the coverage of the sequence by sMo-                    with RA0. TM-scores of the structures modelled using the
tifs. This is expected because it follows from the classical                  entire alphabet, RA0, ranged mostly between 0.2 and 0.9,
approach of homology modelling based on templates, even                       while models with alphabets RA3 or RA1 were in the same
if they are only applied to local fragments. Nevertheless,                    range. As expected, good quality models obtained with al-
this correlation is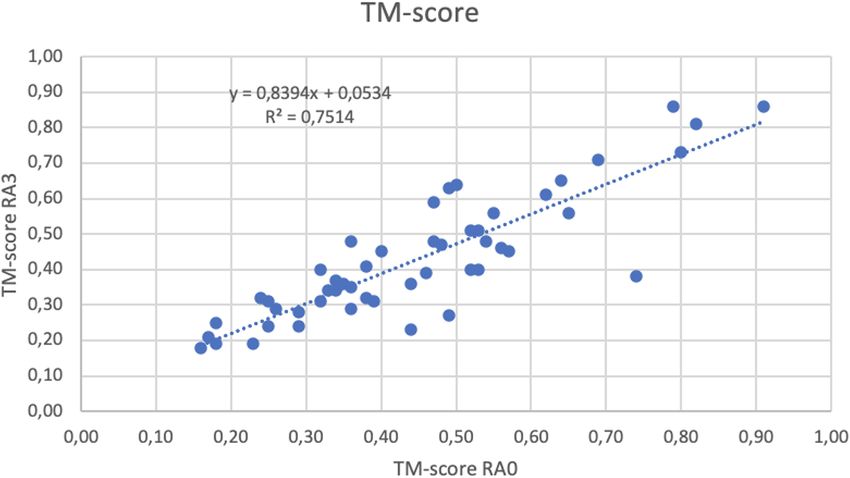
6 NAR Genomics and Bioinformatics, 2021, Vol. 3, No. 2

                                                                                                                                                         Downloaded from https://academic.oup.com/nargab/article/3/2/lqab027/6246168 by guest on 08 October 2021
Figure 4. Correlation between TM-scores of models obtained using restraints derived with alphabets RA0 (horizontal axis) and RA3 (vertical axis). The
R factor and parameters of a fitting line are shown in the upper left corner.

model obtained with alphabet RA0 have lower scores. The
fitting line shown in Figure 4 has slope close to 1 (approx-
imately 0.84), proving that the quality of the models, using
restrains obtained with either RA0 or RA3 alphabets is very
similar. Similar correlation is obtained in the comparison
of Z-scores calculated with Prosa2003 (see Supplementary
Figure S2). Nevertheless, although some models obtained
with restraints using alphabet RA3 have better quality than
using the whole alphabet (RA0), this is within the range of
variability expected by the method. The distribution of the
differences of TM scores (TM) between models obtained
with different distance-restraints (i.e. using RA0 and RA3
alphabets) shows a standard deviation of 0.09 around an av-
erage of 0.02 (see Supplementary Figure S3). The distribu-
tion of TM scores of models obtained with restraints using                   Figure 5. Number of effective sequences in the MSA using the entire al-
                                                                             phabet RA0 (in black), or any of the compressed alphabets RA1 (blue),
alphabets RA0 and RA3 are practically the same (both are                     RA2 (green) and RA3 (red) with respect to the original number of similar
non-significantly different in a paired Student’s T test, with               sequences in the MSA. The least-square fitting lines help to compare the
P-value > 0.1, see Supplementary Figure S4). Furthermore,                    reduction on the number of effective sequences produced by the compres-
there is no correlation between the quality of the models                    sion of the alphabet. The yellow line shows the diagonal with exactly the
                                                                             number of sequences in the MSA.
and the number of effective sequences, neither for models
obtained with full (RA0) nor reduced (RA3) alphabets (see
Supplementary Figure S5).
   One of the advantages of reducing the alphabet is that the                plementary Figure S6 and the comparison with CCMPred).
number of effective sequences is reduced, increasing the ap-                 Details of the computational times to calculate DI by RADI
plicability to MSAs with 600 residues and >3000 sequences in the MSA (>1000
sequences for each target studied is also available in Sup-                  effective): CCMPred reduces the computational time from
plementary Table S1. Furthermore, due to the compression                     3.1e4 s (with RADI using alphabet RA0) to 4.5e3 s, like al-
of the alphabet, the time of computation is also reduced,                    phabet RA1 (3.5e3 s), while alphabets RA2 and RA3 reduce
although this is not significant in comparison with other                    the time to 4 s. However, we note that CCMPred is prepared
new and recent approaches (8). The calculation of the pseu-                  to run with several GPU cores, thus surpassing the speed of
doinverse of a matrix is a computationally expensive step of                 RADI.
DCA, whose dimensions depend on the length of the pro-                          We have compared the residue-residue pairs with top DI
tein (L) and the number of symbols (q) in the MSA alpha-                     obtained by RADI and by CCMPred of the modelled folds
bet. Reducing the alphabet from RA0 to RA1 speeds 32-                        of the benchmark (details of the results are provided in the
fold the computation time of our approach for a protein of                   Supplementary Files). The maximum number of pairs se-
L ≈ 900, while the computation time is reduced ∼2500-fold                    lected by CCMPred is 30, and 15 to 20 out of them are
when reducing the alphabet from RA0 to RA3 (see Sup-                         equivalent to those selected by RADI with alphabet RA0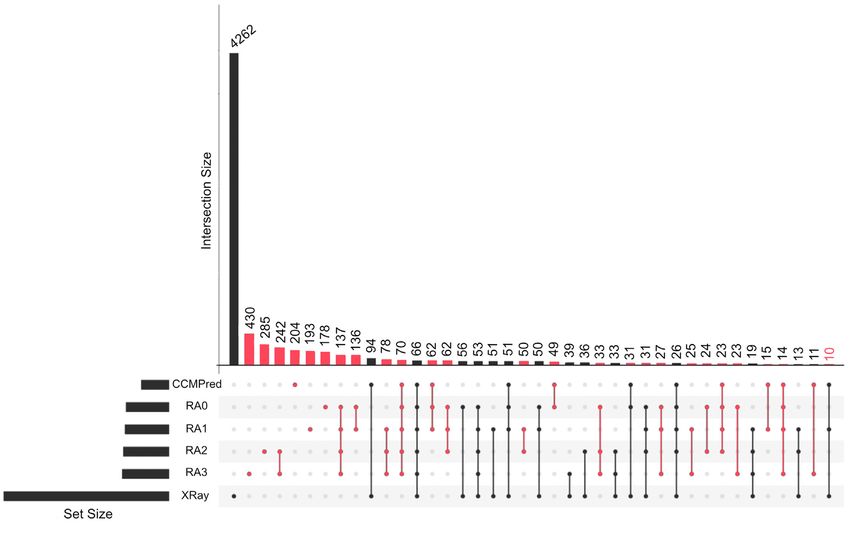
NAR Genomics and Bioinformatics, 2021, Vol. 3, No. 2 7

(see Supplementary Figure S7). The number of equivalent              As shown in the contact map highlighted by circles, there
pairs drops to
8 NAR Genomics and Bioinformatics, 2021, Vol. 3, No. 2

                                                                                                                                                                Downloaded from https://academic.oup.com/nargab/article/3/2/lqab027/6246168 by guest on 08 October 2021
Figure 6. UpSet plot of the intersection of residue-residue pairs of real and predicted contacts obtained with Intervene tool (33). The number of coincident
and non-coincident contacts, either real or predicted by one or more methods, are calculated using interval-squares of 9 × 9 positions of the two-dimensional
contact-map centered around each pair with a real or a predicted contact. The number of 1 × 1 squares predicted by one or more approaches, or obtained
by real contacts, are accumulated for all folds of the benchmark and the final number is normalized by 81 (i.e. the total number of squares around each
position in the 2D map). The UpSet plot shows only individual or combined sets with >14 contacts. Contacts predicted with RADI use the original
alphabet (RA0), or other alphabets (RA1, RA2 and RA3).

Table 3. Coverage and true positive ratio of predictions. The coverage and true-positive ratios of CCMPred and RADI with alphabets RA0, RA1, RA2 and
RA3 are calculated for the proteins of the benchmark used in Table 2 (a total of 50 different folds). The first two rows contain the average and standard
deviation (in parenthesis) of coverage and true-positive ratios. The last two rows contain the ratios of the total of accumulated predictions. Note: Details
per protein are in Supplementary Table S2

                                   CCMPred                      RA0                        RA1                       RA2                       RA3
Average           TPR              0.91 (0.13)               0.84 (0.12)               0.80 (0.13)                0.67 (0.12)               0.61 (0.11)
                  COV            0.006 (0.0057)            0.0072 (0.0068)           0.0068 (0.0067)            0.0058 (0.0059)           0.0055 (0.0060)
Cumulative        TPR                 0.91                      0.84                      0.80                       0.67                      0.61
                  COV                 0.003                     0.004                     0.004                      0.003                     0.003

mum number of sequences of the MSA in our study was 49.                          of the protein sequence. These fragments are identified as
Although certainly the reduction of sequences of the MSA                         regular super-secondary structure motifs (sMotifs) in the
decreases the computational time, it is more important to                        classification of ArchDB14 (22). The coverage of the pro-
notice that it helps to widen the applicability because if the                   tein sequence by sMotifs is important, but not critical. We
variability of sequences allows for alignments with a small                      achieve near native structures with the combination of long-
number of sequences after the reduction, then we can ap-                         distance restraints obtained by the coupling analysis and
ply the approach to many more proteins (i.e. those that ap-                      short/medium-distance restraints from local templates of
peared late in evolution, which are important for human).                        sMotifs, even when the coverage of these templates is
NAR Genomics and Bioinformatics, 2021, Vol. 3, No. 2 9
Downloaded from https://academic.oup.com/nargab/article/3/2/lqab027/6246168 by guest on 08 October 2021
Figure 7. Residue-residue contact predictions for a single domain of the transcription regulator of the MerR family with code 3HH0 in the PDB is shown
in the left: real contacts and 40 top pairs with higher MI and DI values are shown as in legend of Figure 1, adding in yellow circles the top pairs detected
by CCMPred. The quaternary structure of the tetramer complex of 3HH0 is shown in the right: chain A in red, chain B in light blue, D in blue and C in
magenta at the rear. Side-chains of the pair of residues with high DI (encircled in the contact map) are shown in spheres (light blue in chain B, blue in chain
D and red in chain A) and the correspondence is identified by arrows and by the sequence positions of pairs labelled in the ribbon plot of the structure.
The group of contacts between residues 116–118 of chain B and 73–75 of chain D were found by RADI using all alphabets and by CCMPred.
Figure 8. (A) RMSD of C␣ atoms between the modelled structures of the transcription regulator of the MerR family with code 3HH0 in the PDB and
the crystal structure of a single chain. Color labels are as in Figure 4. (B) Superimposition of the modelled structures of 3HH0 obtained with different
alphabets (RA0 blue, RA1 orange and RA3 green) on the crystal structure (sand color).
in ab initio fold prediction (36,37) could also benefit from DATA AVAILABILITY
the use of a simplified alphabet, not only on the speed of
RADI is available at https://github.com/
some of the steps, but by reinforcing or adding new pre-
structuralbioinformatics/RADI and raDIMod at
dictions with the use of multiple sequence alignments pro-
https://github.com/structuralbioinformatics/raDIMod
cessed by self-attention (38).
Note: The program and results for the se-
quences of the benchmark are available at https: SUPPLEMENTARY DATA
//github.com/structuralbioinformatics/RADI. For the Supplementary Data are available at NARGAB Online.
construction of structural models, it is necessary to
align the sequence of the query target with struc-
tural fragments (sMotifs). The script is available at ACKNOWLEDGEMENTS
https://github.com/structuralbioinformatics/archdbmap. We acknowledge funding from grants of the Spanish
For the construction of the models, we use the program Ministry of Economy (MINECO) [BIO2017-85329-
MODELLER. The scripts to combine the fragment-based R(FEDER,UE)]; [BIO2017-83591-R(FEDER,UE)];
modeling and distance restraints from RADI are available [RYC-2015-17519]; and also support from ‘Unidad de Ex-
at https://github.com/structuralbioinformatics/raDIMod. celencia Marı́a de Maeztu’, funded by the Spanish Ministry10 NAR Genomics and Bioinformatics, 2021, Vol. 3, No. 2
of Economy [ref: MDM-2014-0370] Units of Excellence in 17. Schmidt,M. and Hamacher,K. (2017) Three-body interactions
R&D (CEX2018-000792-M). We acknowledge the Council improve contact prediction within direct-coupling analysis. Phys. Rev.
E, 96, 052405.
for the Catalan Republic. The Research Programme on 18. Schmidt,M. and Hamacher,K. (2018) hoDCA: higher order
Biomedical Informatics (GRIB) is a member of the Spanish direct-coupling analysis. BMC Bioinformatics, 19, 546.
National Bioinformatics Institute (INB), PRB2-ISCIII and 19. Fernandez-Fuentes,N. and Fiser,A. (2013) A modular perspective of
is supported by grant PT13/0001/0023, of the PE I+D+i protein structures: application to fragment based loop modeling.
2013–2016, funded by ISCIII and FEDER. Methods Mol. Biol., 932, 141–158.
20. Vallat,B., Madrid-Aliste,C. and Fiser,A. (2015) Modularity of
protein folds as a tool for template-free modeling of structures. PLoS
FUNDING Comput. Biol., 11, e1004419.
21. Menon,V., Vallat,B.K., Dybas,J.M. and Fiser,A. (2013) Modeling
Spanish Ministry of Economy MINECO [BIO2014-57518- proteins using a super-secondary structure library and NMR
R, BIO2017-83591-R (FEDER, UE), BIO2017-85329-R chemical shift information. Structure, 21, 891–899.
(FEDER, UE)]; Generalitat de Catalunya [SGR17-1020]. 22. Bonet,J., Planas-Iglesias,J., Garcia-Garcia,J., Marin-Lopez,M.A.,
Downloaded from https://academic.oup.com/nargab/article/3/2/lqab027/6246168 by guest on 08 October 2021
Fernandez-Fuentes,N. and Oliva,B. (2014) ArchDB 2014: structural
Conflict of interest statement. None declared. classification of loops in proteins. Nucleic Acids Res., 42, D315–D319.
23. Steinegger,M. and Soding,J. (2017) MMseqs2 enables sensitive
REFERENCES protein sequence searching for the analysis of massive data sets. Nat.
Biotechnol., 35, 1026–1028.
1. Lewis,T.E., Sillitoe,I., Andreeva,A., Blundell,T.L., Buchan,D.W., 24. Deorowicz,S., Debudaj-Grabysz,A. and Gudys,A. (2016) FAMSA:
Chothia,C., Cozzetto,D., Dana,J.M., Filippis,I., Gough,J. et al. Fast and accurate multiple sequence alignment of huge protein
(2015) Genome3D: exploiting structure to help users understand families. Sci. Rep., 6, 33964.
their sequences. Nucleic Acids Res., 43, D382–D386. 25. Dunn,S.D., Wahl,L.M. and Gloor,G.B. (2008) Mutual information
2. Schaarschmidt,J., Monastyrskyy,B., Kryshtafovych,A. and without the influence of phylogeny or entropy dramatically improves
Bonvin,A. (2018) Assessment of contact predictions in CASP12: residue contact prediction. Bioinformatics, 24, 333–340.
Co-evolution and deep learning coming of age. Proteins, 86, 51–66. 26. Adamczak,R., Porollo,A. and Meller,J. (2005) Combining prediction
3. Marks,D.S., Colwell,L.J., Sheridan,R., Hopf,T.A., Pagnani,A., of secondary structure and solvent accessibility in proteins. Proteins,
Zecchina,R. and Sander,C. (2011) Protein 3D structure computed 59, 467–475.
from evolutionary sequence variation. PLoS One, 6, e28766. 27. Webb,B. and Sali,A. (2017) Protein structure modeling with
4. Buchan,D.W.A. and Jones,D.T. (2018) Improved protein contact MODELLER. Methods Mol. Biol., 1654, 39–54.
predictions with the MetaPSICOV2 server in CASP12. Proteins, 86, 28. Marti-Renom,M.A., Madhusudhan,M.S., Fiser,A., Rost,B. and
78–83. Sali,A. (2002) Reliability of assessment of protein structure prediction
5. Ekeberg,M., Lovkvist,C., Lan,Y., Weigt,M. and Aurell,E. (2013) methods. Structure, 10, 435–440.
Improved contact prediction in proteins: using pseudolikelihoods to 29. Wiederstein,M. and Sippl,M.J. (2007) ProSA-web: interactive web
infer Potts models. Phys. Rev. E Stat. Nonlin. Soft Matter Phys., 87, service for the recognition of errors in three-dimensional structures of
012707. proteins. Nucleic Acids Res., 35, W407–W410.
6. Giraud,B.G., Heumann,J.M. and Lapedes,A.S. (1999) Superadditive 30. Andreeva,A., Howorth,D., Chandonia,J.M., Brenner,S.E.,
correlation. Phys. Rev. E Stat. Phys. Plasmas Fluids Relat. Interdiscip. Hubbard,T.J., Chothia,C. and Murzin,A.G. (2008) Data growth and
Topics, 59, 4983–4991. its impact on the SCOP database: new developments. Nucleic Acids
7. de Juan,D., Pazos,F. and Valencia,A. (2013) Emerging methods in Res., 36, D419–D425.
protein co-evolution. Nat. Rev. Genet., 14, 249–261. 31. Rose,P.W., Prlic,A., Altunkaya,A., Bi,C., Bradley,A.R.,
8. Seemayer,S., Gruber,M. and Soding,J. (2014) CCMpred–fast and Christie,C.H., Costanzo,L.D., Duarte,J.M., Dutta,S., Feng,Z. et al.
precise prediction of protein residue-residue contacts from correlated (2017) The RCSB protein data bank: integrative view of protein, gene
mutations. Bioinformatics, 30, 3128–3130. and 3D structural information. Nucleic Acids Res., 45, D271–D281.
9. Morcos,F., Pagnani,A., Lunt,B., Bertolino,A., Marks,D.S., 32. Zhang,Y. and Skolnick,J. (2005) TM-align: a protein structure
Sander,C., Zecchina,R., Onuchic,J.N., Hwa,T. and Weigt,M. (2011) alignment algorithm based on the TM-score. Nucleic Acids Res., 33,
Direct-coupling analysis of residue coevolution captures native 2302–2309.
contacts across many protein families. Proc. Natl. Acad. Sci. U.S.A., 33. Khan,A. and Mathelier,A. (2017) Intervene: a tool for intersection
108, E1293–E1301. and visualization of multiple gene or genomic region sets. BMC
10. Michel,M., Hayat,S., Skwark,M.J., Sander,C., Marks,D.S. and Bioinform., 18, 287.
Elofsson,A. (2014) PconsFold: improved contact predictions improve 34. Dill,K.A. and MacCallum,J.L. (2012) The protein-folding problem,
protein models. Bioinformatics, 30, i482–488. 50 years on. Science, 338, 1042–1046.
11. Feinauer,C., Skwark,M.J., Pagnani,A. and Aurell,E. (2014) 35. Sali,A., Shakhnovich,E. and Karplus,M. (1994) How does a protein
Improving contact prediction along three dimensions. PLoS Comput. fold? Nature, 369, 248–251.
Biol., 10, e1003847. 36. Senior,A.W., Evans,R., Jumper,J., Kirkpatrick,J., Sifre,L., Green,T.,
12. Hopf,T.A., Colwell,L.J., Sheridan,R., Rost,B., Sander,C. and Qin,C., Zidek,A., Nelson,A.W.R., Bridgland,A. et al. (2020)
Marks,D.S. (2012) Three-dimensional structures of membrane Improved protein structure prediction using potentials from deep
proteins from genomic sequencing. Cell, 149, 1607–1621. learning. Nature, 577, 706–710.
13. Ovchinnikov,S., Kinch,L., Park,H., Liao,Y., Pei,J., Kim,D.E., 37. Billings,W.M., Hedelius,B., Millecam,T., Wingate,D. and Corte,D.D.
Kamisetty,H., Grishin,N.V. and Baker,D. (2015) Large-scale (2019) ProSPr: Democratized Implementation of Alphafold Protein
determination of previously unsolved protein structures using Distance Prediction Network. bioRxiv doi:
evolutionary information. Elife, 4, e09248. https://doi.org/10.1101/830273, 21 November 2019, preprint: not peer
14. dos Santos,R.N., Morcos,F., Jana,B., Andricopulo,A.D. and reviewed.
Onuchic,J.N. (2015) Dimeric interactions and complex formation 38. Rao,R., Liu,J., Verkuil,R., Meier,J., Canny,J.F., Abbeel,P., Sercu,T.
using direct coevolutionary couplings. Sci. Rep., 5, 13652. and Rives,A. (2021) MSA Transformer. bioRxiv doi:
15. Wu,F.Y. (1982) The Potts model. Rev. Mod. Phys., 54, 235–268. https://doi.org/10.1101/2021.02.12.430858, 13 February 2021,
16. Rizzato,F., Coucke,A., de Leonardis,E., Barton,J.P., Tubiana,J., preprint: not peer reviewed.
Monasson,R. and Cocco,S. (2020) Inference of compressed Potts
graphical models. Phys. Rev. E, 101, 012309.You can also read