ORIGINAL ARTICLE How to reach optimal estimates of confidence intervals in microscopic counting of phytoplankton? - Oxford Academic Journals
←
→
Page content transcription
If your browser does not render page correctly, please read the page content below
Journal of
Plankton Research                                                                            academic.oup.com/plankt

                                                                                                                                                        Downloaded from https://academic.oup.com/plankt/advance-article/doi/10.1093/plankt/fbab062/6380872 by guest on 23 November 2021
J. Plankton Res. (2021) 1–7. https://doi.org/10.1093/plankt/fbab062

ORIGINAL ARTICLE
How to reach optimal estimates of
confidence intervals in microscopic
counting of phytoplankton?
KALEVI SALONEN             1, *,   PAULIINA SALMI        2   AND JORMA KESKITALO1
1
 lammi biological station, university of helsinki, pääjärventie 320, fi-16900 lammi, finland and 2 faculty of information technology,
university of jyväskylä, po box 35, jyväskylä fi-40014, finland

*corresponding author: kalevi.salonen@helsinki.fi

Received May 2, 2021; editorial decision August 23, 2021; accepted August 23, 2021

Corresponding editor: Beatrix E. Beisner

Present practices in the microscopic counting of phytoplankton to estimate the reliability of results rely on the
assumption of a random distribution of taxa in sample preparations. In contrast to that and in agreement with the
literature, we show that aggregated distribution is common and can lead to over-optimistic confidence intervals, if
estimated according to the shortcut procedure of Lund et al. based on the number of counted cells. We found a good
linear correlation between the distribution independent confidence intervals for medians and those for parametric
statistics so that 95% confidence intervals can be approximated by using a correction factor of 1.4. Instead, the
recommendation to estimate confidence intervals from the total number of counted cells according to Lund et al.
should be categorically rejected. We further propose the adoption of real-time confidence intervals during microscopic
counting as the criterion to define how long counting should be continued. Then each sample can be counted in its
individual way to reach the necessary reliability independent of highly different samples. Such a dynamic counting
strategy would be the most significant development in the quality control of phytoplankton counting since the early
pioneers established the present counting practices in the late 1950s.

KEYWORDS: confidence intervals; dynamic counting; microscopy; phytoplankton

available online at academic.oup.com/plankt
© The Author(s) 2021. Published by Oxford University Press.
This is an Open Access article distributed under the terms of the Creative Commons Attribution License (http://creativecommons.org/licenses/by/4.0/),
which permits unrestricted reuse, distribution, and reproduction in any medium, provided the original work is properly cited.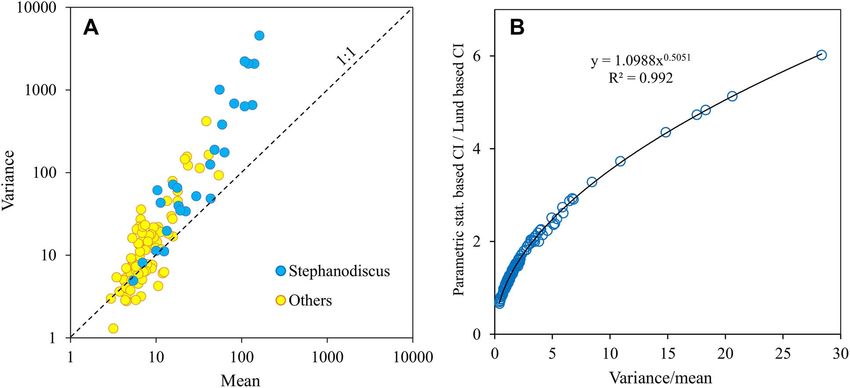
JOURNAL OF PLANKTON RESEARCH          VOLUME 00          NUMBER 00      PAGES 1–7    2021

INTRODUCTION                                                         of settled phytoplankton. Nevertheless, when confidence
                                                                     intervals are shown in the literature, they are generally
Microscopic counting of phytoplankton is one of the
                                                                     (Edgar and Laird, 1993) derived from the total number of
basic determinations used in the assessment of the ecolog-
                                                                     counts according to the shortcut procedure of Lund et al.
ical status of aquatic environments. Generally, a settling
                                                                     (1958). Even more often, no confidence intervals are given
chamber technique (Utermöhl, 1958) is applied accord-
                                                                     at all (Edgar and Laird, 1993). Thus, despite convincing
ing to standardized approaches (e.g. EN 15204, 2006).
                                                                     evidence that the distribution of phytoplankton cells

                                                                                                                                    Downloaded from https://academic.oup.com/plankt/advance-article/doi/10.1093/plankt/fbab062/6380872 by guest on 23 November 2021
Significant effort has been made to ascertain the com-
                                                                     on the settling chamber is often aggregated, it has not
parability of the results by various measures of quality
                                                                     been addressed in microscopic counting since the early
assurance (e.g. Rott et al., 2007). Although there is a need
                                                                     pioneers established the present counting practices more
for universal counting approaches, it is illusory to believe
                                                                     than 60 years ago.
that all problems (Rott, 1981; Thackeray et al., 2013) can
                                                                        The purpose of this study was to have a deeper insight
be solved by adherence to any single standard. Despite
                                                                     into the distribution of phytoplankton cells on counting
their merits, standardized approaches may even have
                                                                     chambers to find an objective basis to reach reliable
engendered a false feeling of adequate quality control of
                                                                     confidence limits of microscopic counts with minimum
counting results. For example, quality assurance is only
                                                                     work effort. We hypothesized that irrespective of the phy-
halfway towards good phytoplankton results and does not
                                                                     toplankton distribution on the settling chamber, a satisfac-
guarantee their comparability (Duarte et al., 1990). Qual-
                                                                     tory approach can be found to calculate the confidence
ity assurance increases the likelihood of achieving good
                                                                     intervals of the results to advance the interpretation of
results, but only quality control can document whether
                                                                     the results.
they are realized.
    Many factors like sampling, preservation, subsampling,
settling and counting contribute to the total variation of
the results but have surprisingly rarely been taken into             MATERIALS AND METHODS
account. Chemical, biological and physical (e.g. Blukacz
                                                                     Sample preparation
et al., 2009) factors can lead to patchy vertical and tempo-
ral distributions in water bodies so that sampling generally         Lake water samples were preserved with Lugol’s iodine
contributes to the bulk of the variation in the results. Simi-       (0.5–1 mL in 100 mL of water). Before settling (Uter-
larly, the variation across lakes has been largely neglected.        möhl, 1958), samples were acclimated to the prevailing
Microscopic counting is typically the next most important            laboratory temperature for 1 day and then the bottles
source of variation (Kirchman et al., 1982). In particular,          were gently mixed by turning them up and down for ca
the rarity of confidence interval estimations weakens the             2 min. The 25 mm diameter settling chambers were kept
usefulness of phytoplankton count data.                              on a table protected from direct sunlight and airflow for
    Lund et al. (1958) emphasized the crucial importance of          at least 8 h (10 mL chambers) or 24 h (25 mL and 50 mL
the confidence intervals of microscopic counts. At a time             chambers).
when no personal computers or even calculators were
available, they suggested a shortcut procedure to estimate
confidence intervals based on the assumption that the                 Counting of samples
spatial distribution of specimens on a settling chamber              Settled phytoplankton samples were counted by two
is random (Poisson distributed). However, various factors            researchers. One counted winter samples from one lake
can lead to an aggregated (variance > mean) distribution             and the other counted summer samples from different
of phytoplankton on the settling chamber. Variation in               lakes. Both used an inverted light microscope with phase-
temperature during settling is one of the most critical              contrast optics (Wild M40, Switzerland and Olympus
aspects, because it can produce density gradient currents            IX50, Japan) with 300×, 400× or 600× magnification
in the settling chamber so that lateral or radial differences        depending on the size and abundance of taxa. Unicellular
in cell density may develop (Sandgren and Robinson,                  phytoplankton species were counted from replicate
1984).                                                               microscopic fields selected pseudorandomly, whereby
    Count data of ecological studies regularly violate               fields for counting were located by blindly moving
the equidispersion constraint imposed by the Poisson                 the microscope stage to a new position. In practice,
distribution (Lynch et al., 2014). Accordingly, empirical            any area close to the margin of the settling chamber
observations (Nauwerck, 1963; Rott, 1981; Sandgren and               was avoided. A proprietary computer program (open
Robinson, 1984) and simulations (Edgar and Laird, 1993)              version in preparation) was used to register the results
have demonstrated a common lack of spatial randomness                of individual fields of view.

                                                                 2
K. SALONEN ET AL. CONFIDENCE INTERVALS IN MICROSCOPIC COUNTING OF PHYTOPLANKTON
The results of this study were taken from routine RESULTS
countings where phytoplankton biomass was the primary
The results of phytoplankton (11 taxa) counted on settling
object. We only used counts of solitary taxa with the total
chambers (n = 113) showed a rather high range of the
number of counted specimens per sample >50, and the
coefficient of variation (mean CV 43%, range 16%–90%)
number of counted fields at least 10 (up to 30, mean
between replicate microscope fields. The median counts
14). Although the number of cells counted for individual
were on average 4.3% lower (CV 219%) than the mean
species often remained rather small, our results probably
Downloaded from https://academic.oup.com/plankt/advance-article/doi/10.1093/plankt/fbab062/6380872 by guest on 23 November 2021
counts (range 3–161) but the difference was not significant
represent well the reality of routine countings.
(Mann–Whitney U test, P = 0.52).
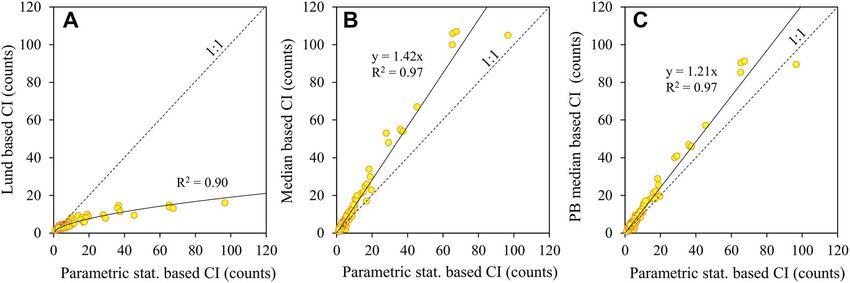
Different approaches to calculate confidence limits of
Statistical analyses averages produced markedly different results. The rela-
tive confidence limits of means calculated according to
The relative 95% parametric confidence intervals (PCIs) the parametric statistics (Fig. 1) were often several times
of the results as a percentage of the mean were calculated wider than those calculated according to the shortcut
according to: procedure of Lund et al. (1958) independently of the
total number of counted cells. According to the Lund
√ approach confidence limits, roughly 10% of the mean,
t0.025∗ s2
PCI = 200 ∗ √ (1) were obtained when about 400 cells were counted, but in
mean ∗ n reality the values were often 2–3 times wider. A compari-
son between the results of these two methods shows that
where t0.025 is the 97.5% percentile of the t-distribution the discrepancy increased non-linearly with increasing
with n − 1 degrees of freedom, s2 is sample variance and n confidence interval (Fig. 2A). The respective relationship
is the number of replicates. Because variance and mean for the median was linear and departed from the 1:1 ref-
are equal in the Poisson distribution, Lund et al. (1958) erence line with a 40% steeper slope (Fig. 2B). BP median
substituted the sample variance of equation (1) by the similarly showed wider confidence intervals compared to
sample mean and derived a shortcut equation to calculate the parametric statistics but with only ∼20% difference
a confidence interval (LCI) as a percentage of the mean: (Fig. 2C).
The variance-to-mean ratio of the counts was often
>1, indicating an aggregated distribution of the cells
200
LCI = 2 ∗ √ (2) (Fig. 3A). The highest aggregation was due to a small
N (diameter ca 5 μm) Stephanodiscus cf. parvus diatom, which
was very abundant in an ice-covered lake. However, the
where N = total number of counted specimens and the regressions between the logarithms of variance and mean
t-value was set equal to 2, which is a practical approxima- for Stephanodiscus and the other taxa were not far from each
tion, if the number of counted fields is >30. other (
JOURNAL OF PLANKTON RESEARCH                  VOLUME 00          NUMBER 00      PAGES 1–7     2021

                                                                                    In agreement with the simulations of Edgar and Laird
                                                                                 (1993) and earlier field observations, in our samples, the
                                                                                 shortcut approach of Lund et al. (1958) often yielded
                                                                                 unrealistically low confidence intervals. At a time when
                                                                                 no calculators were available, the shortcut approach was
                                                                                 no doubt useful to indicate how much work should be
                                                                                 allocated for counting and the same is still true. How-

                                                                                                                                                 Downloaded from https://academic.oup.com/plankt/advance-article/doi/10.1093/plankt/fbab062/6380872 by guest on 23 November 2021
                                                                                 ever, in the computer age, the Lund approach should be
                                                                                 consigned to history as an indicator of the confidence
                                                                                 intervals of the results. Instead, counting programs capa-
                                                                                 ble of providing reliable confidence limits in real-time
                                                                                 should be preferred. Then it is possible to have a good
Fig. 1. Comparison between Lund based (LCI/2, curve) and paramet-                idea about the reliability of the results in so early a phase
ric statistics based (PCI/2, dots) 95% confidence limits in relation to the       that counting effort can be allocated to reach the desired
number of counted cells. Black dots—Stephanodiscus samples.                      level of certainty or to focus on the most critical taxa
                                                                                 of the sample concerning the uncertainty of the results.
have been counted by the same or several persons. Vuorio                         It is noticeable that dynamic counting does not increase
et al. (2007) reported CVs for 20 fields of two samples                           work but can make it more efficient. It is also more
counted by the same person. In both cases of Rhodomonas                          motivating, as results can be seen immediately and their
counting, CV was 13% and in those of Fragilaria counts                           processing can start already during counting. There are a
14% and 19%. Respective results of counts through the                            few phytoplankton counting programs in the market, but
diameter of the settling chamber were 10% and 15% as                             their scope is limited to serve as a simple calculator rather
well as 5% and 23%. Although the number of counted                               than to support the quality of the results. Thus, at the
cells was not reported, these results seem to represent the                      moment the limiting factor is the availability of suitable
lowest range of variation in our study.                                          programs.
   When our results are compared with published                                     In the simulations of Edgar and Laird (1993), the range
intercalibration results where parallel subsamples have                          of the variance-to-mean ratio was modest (0.6–2.2) and
been counted by several microscopists (Willén 1976), the                         parametric statistics based confidence limits produced a
CVs of our results were on average almost two times                              reasonable agreement with an expected error rate of 0.05.
higher (23% vs. 45%; n = 90 vs. 113) in samples with                             In our results, the range of the variance-to-mean ratio was
at least 50 counted cells. However, Hobro and Willén                             an order of magnitude higher (0.3–28.2) and the results
(1977) who reported results of subsamples counted in                             revealed on average much wider confidence intervals for
three laboratories (in each case 10 parallel subsamples)                         the median compared with parametric statistics based
found higher average CVs of 45% (range10%–57%),                                  ones. Thus, straightforward use of parametric statistics
51% (range 14%–90%) and 12% (range 4%–13%),                                      can lead to a too optimistic interpretation of the results.
respectively, which rather closely corresponds our results.                      The confidence limits for the median are robust but asym-
Because the variation of the counts between counting                             metrical to the median value and computationally more
fields is inherently higher than the variation between                            complicated (BP median is more convenient). Fortunately,
the mean counts of replicate fields, our results seem                             the linear relationship between the CIs of the mean and
to be in line with the intercalibrations. As our samples                         the median allows the use of a simple empirical correction
originated from many different lakes with different taxa,                        factor of 1.4 to probably reach the most realistic estimates.
our counting results are likely representative of routine                        In comparison with the confidence limits based on the
phytoplankton counting in general.                                               Lund approach, the correction dramatically improves the
   Variance-to-mean ratios generally higher than unity                           evaluation of the results of samples with high aggregation
verified that the aggregated distribution of phytoplankton                        of cells. Consequently, our findings verified the hypoth-
on counting chambers is the rule rather than the excep-                          esis that distribution independent confidence intervals
tion (Fig. 3A). The observed extremely high variance-to-                         for microscopic counts can be derived from parametric
mean ratios of Stephanodiscus diatoms may be explained                           statistics.
by delicate polysaccharide fibrils of diatoms (Svetličić
et al., 2013), which in our samples were faintly visible
under a phase-contrast microscope. The preservation of                           Implications for phytoplankton counting
the samples may have facilitated the adherence of cells                          Few words may be necessary to comment on what is the
together by the fibrils.                                                          most representative average value of microscopic counts.

                                                                             4
K. SALONEN ET AL.        CONFIDENCE INTERVALS IN MICROSCOPIC COUNTING OF PHYTOPLANKTON

                                                                                                                                                  Downloaded from https://academic.oup.com/plankt/advance-article/doi/10.1093/plankt/fbab062/6380872 by guest on 23 November 2021
Fig. 2. Comparison of Lund et al. (1958) (A), median (B) and BP median (C) based 95% confidence intervals (CI) of phytoplankton counts with
parametric statistics based confidence intervals. The 1:1 line shows where the confidence intervals of both approaches yield equal results. Each
point represents an individual sample.

Fig. 3. Relationship between variance and mean of cell counts of phytoplankton (A) and dependence of parametric/Lund statistics based estimates
of confidence intervals from variance-to-mean ratio (B).

Because the median minimizes the effect of a significant                   increase work, we suggest that in phytoplankton counting
number of outliers in the data, it is sometimes favoured                  both the arithmetic mean and median values should be
as a robust average value. In our samples, with spuriously                provided to assist the interpretation of results. Because of
high counts in microscopic fields as well as in samples                    the higher stability of the median, such a practice might
with empty fields, the median was typically smaller than                   sometimes strengthen the conclusions.
the mean, but the difference was in practice negligible.                     Despite decades of extensive availability of computers,
Similarly, Rott (1981) has found that the elimination of                  their power has generally only been used for the same
outliers does not markedly affect phytoplankton count-                    routine calculations as 60 years ago. As emphasized by
ing results. Further, if we exclude clear mistakes, such                  the high variance-to-mean ratio of Stephanodiscus diatoms
as typing errors, “outliers” in phytoplankton counts are                  in this study, not too much weight should be given to
generally not real errors and hence their omission biases                 the results of occasional intercalibrations, which have
the mean results. Consequently, outliers should not be                    no general validity for individual phytoplankton samples.
rejected without strong a priori reason. On the other                     Instead, it should be mandatory to have an idea about the
hand, because the calculation of the median does not                      quality of the results based on the statistics of observed

                                                                      5
JOURNAL OF PLANKTON RESEARCH VOLUME 00 NUMBER 00 PAGES 1–7 2021
results rather than on any assumptions. In this way, the counting cannot be recommended, although it has often
results could be most realistically interpreted. Here it been erroneously assumed to compensate for differences
should also be noted that the counting of samples is only in the distribution of phytoplankton over the settling
one source of variation. chamber. Counting of truly random fields is theoretically
In the present European phytoplankton counting stan- an ideal solution, but without a computer-run motorized
dard (EN 15204, 2006), confidence intervals calculated stage it remains by far too impractical. Instead, simple
from individual counts in microscopic fields are recom- counting of evenly distributed stripes, which compensates
Downloaded from https://academic.oup.com/plankt/advance-article/doi/10.1093/plankt/fbab062/6380872 by guest on 23 November 2021
mended in parallel with the shortcut approach of Lund for both laterally and radially non-random distributions
et al. (1958). However, in practice the recommendation of phytoplankton cells, can be recommended. Interlaced
remains largely unrealized, because the necessary cal- replicate sets of stripes might be used to estimate confi-
culations are tedious. Thus, there is an urgent need for dence intervals. A new counterpart for random counting
phytoplankton counting programs, such as that used in might also be provided by Archimedean spirals marked
our study, which provide confidence intervals in real-time. at equal distances along their lengths on the bottom glass
Phytoplankton counting instructions often advise ver- of the settling chamber. When all fields are counted at
ification that specimens are randomly distributed and even distances from each other through the whole spiral
suggest the preparation of a new sample, if this is not the counting would represent the whole chamber area
fulfilled. However, visual inspection of distribution is sub- in correct proportion. Compared with stripe counting,
jective and is of value only for the most striking deviations this method is more flexible to cope with a range of
from randomness in quite dense phytoplankton samples. abundances, because the number of points to be counted
Second, a strictly stable settling temperature to exclude in the spiral can be varied.
convective water circulation and its effect on the distri-
bution of cells in the settling chamber may be difficult
to achieve particularly in summer, when there is often
CONCLUSIONS
no compensation for diurnally fluctuating indoor temper-
ature. Hence, convection can affect the distribution of Present phytoplankton counting practices cannot opti-
cells (Berthold and Resagk 2012). Third, as demonstrated mally cope with various qualities of samples or different
by the Stephanodiscus diatom, sometimes the reason for goals of counting. Because an aggregated distribution of
the aggregated distribution is an inherent feature of the specimens is common, and often technically unavoidable,
sample rather than the settling conditions. Maybe the only the deterioration of the quality of the results should
efficient way to minimize an aggregated distribution of be compensated for by a proper counting procedure.
cells is a careful acclimation of samples to the temperature Our results suggest that confidence intervals derived from
of the settling environment and to prevent vibrations as parametric statistics can provide distribution independent
well as temperature fluctuation. and reliable information on the quality of the results when
In addition to the estimation of the uncertainty of corrected by the empirical factor of 1.4.
the results, the distribution of phytoplankton in a settling In addition to how long the counting of each sample
chamber has important ramifications for how samples or taxon should be continued to reach wanted confidence
should be counted. The finding of Sandgren and Robin- intervals of abundance, dynamic counting has impor-
son (1984) that cell abundances near the margin of the set- tant ramifications for the estimation of phytoplankton
tling chamber can be higher than around the centre poses biomass. It provides an unprecedented possibility to allo-
a significant challenge in microscopic counting. Com- cate work effort so that the vast size and abundance range
monly used so-called pseudorandom selection of fields for of taxa can be taken into account. When necessary, any
counting tends to lead to the under-representation of the taxon can be counted in its specific way. This is in striking
marginal zone of the settling chamber and consequent contrast with the paradigm that in routine counting a
systematic underestimation of cell count. Four alternative fixed number of views or cells is assumed to produce
approaches might be used: stratified counting of the cen- the most comparable results. Because of highly different
tral and marginal areas of the settling chamber, diameter samples, it is not always the case. With an appropriate
counting, true random selection of fields and stripe count- counting program, complicated calculations are auto-
ing. Stratified counting partly compensates for a radially matic and there is no problem applying whatever mixture
uneven distribution of cells, but because the proportion of of counting strategies within one sample without increas-
the chamber area non-linearly increases with the distance ing the work effort. We have successfully applied dynamic
from the centre, the problem is only alleviated, not con- counting for counting bacterioplankton and phytoplank-
trolled. For the same reason, the widely applied diameter ton (Salmi et al., 2014) to adjust the quality of the results
6K. SALONEN ET AL. CONFIDENCE INTERVALS IN MICROSCOPIC COUNTING OF PHYTOPLANKTON
to the level necessary for the goal of the study during the Edgar, R. K. and Laird, K. (1993) Computer simulation of error
ongoing microscopy sessions, i.e. at the only time when it rates of Poisson-based interval estimates of plankton abundance.
is still possible. Hydrobiologia, 264, 65–77.
Dynamic counting of phytoplankton allows the micro- EN 15204 (2006) European standard. In Water Quality – Guidance Stan-
dard for the Routine Analysis of Phytoplankton Abundance and Composition
scopist to decide objectively how to balance work effort Using Inverted Microscopy (Utermöhl technique), European Committee for
between the quality of the results and available resources. Standardization, Brussels, Belgium, pp. 40.
Thus, it can provide a universal and objective platform
Downloaded from https://academic.oup.com/plankt/advance-article/doi/10.1093/plankt/fbab062/6380872 by guest on 23 November 2021
Hobro, R. and Willén, E. (1977) Phytoplankton countings. Intercali-
suitable for any samples and targets. Future standardiza- bration results and recommendations for routine work. Int. Rev. ges.
tion no longer needs to recommend how many counts (or Hydrobiol., 62, 805–811.
counted fields, etc.) are needed but rather what confidence Kirchman, D., Sigda, J., Kapuscinski, R. and Mitchell, R. (1982) Sta-
intervals should be reached. We believe that dynamic tistical analysis of the direct count method for enumerating bacteria.
counting will be one of the greatest advances in micro- Appl. Environ. Microbiol., 44, 376–382.
scopic phytoplankton counting since the early pioneers Lund, J. W. G., Kipling, C. and Le Cren, C. E. (1958) The inverted
established the present settling chamber practices. Its microscope method of estimating algal numbers and the statistical
basis of estimations by counting. Hydrobiologia, 11, 143–170.
introduction would be quite straightforward, because the
Lynch, H. J., Thorson, J. and Shelton, A. O. (2014) Dealing with under-
creation of appropriate computer programs is not diffi- and over-dispersed count data in life history, spatial, and community
cult. ecology. Ecology, 95, 3173–3180.
Nauwerck, A. (1963) Die Beziehungen zwischen Zooplankton und Phy-
toplankton im See Erken. Symbolae Botanicae Upsalienses, 17, 126–163.
ACKNOWLEDGEMENTS Rott, E. (1981) Some results from phytoplankton counting intercalibra-
tions. Schweiz. Z. Hydrol., 43, 34–62.
We thank Cathryn Primrose-Mathisen for checking the English
language of the submitted version. Rott, E., Salmaso, N. and Hoehn, E. (2007) Quality control of
Utermöhl-based phytoplankton counting and biovolume estimates -
an easy task or a Gordian knot? Hydrobiologia, 578, 141–146.
Salmi, P., Lehmijoki, A. and Salonen, K. (2014) Development of
FUNDING picoplankton during natural and enhanced mixing under late-winter
Lake Vesijärvi Foundation.
ice. J. Plankton Res., 36, 1501–1511.
Sandgren, C. D. and Robinson, J. V. (1984) A stratified sampling
approach to compensating for non- random sedimentation of phy-
REFERENCES toplankton cells in inverted microscope setting chambers. Br. Phycol.
Bonett, D. G. and Price, R. M. (2002) Statistical inference for a linear J., 19, 67–72.
function of medians: confidence intervals, hypothesis testing and Svetličić, V., Žutić, V., Pletikapić, G. and Radić, T. M. (2013) Marine
sample size requirements. Psychol. Methods, 7, 370–383. polysaccharide networks and diatoms at the nanometric scale. Int. J.
Berthold, S. and Resagk, C. (2012) Investigation of thermal convection Mol. Sci., 14, 20064–20078.
in water columns using particle image velocimetry. Exp. Fluids, 52, Thackeray, S. J., Nõges, P., Dunbar, M. J., Dudley, B. J., Skjelbred,
1465–1474. B., Morabito, B., Carvalho, L., Phillips, G. et al. (2013) Quantifying
Blukacz, E. A., Shuter, B. J. and Sprules, W. G. (2009) Towards under- uncertainties in biologically-based water quality assessment: a pan-
standing the relationship between wind conditions and plankton European analysis of lake phytoplankton community metrics. Ecol.
patchiness. Limnol. Oceanogr., 54, 1530–1540. Indic., 29, 34–47.
Campbell, M. J. and Gardner, M. J. (2000) Medians and their differ- Utermöhl, H. (1958) Zur Vervollkommnung der quantitativen
ences. In Altman, D. G., Machin, D., Bryant, T. N. and Gardner, M. J. Phytoplankton-Methodik. Mitt. Int. Ver. Theor. Angew. Limnol., 9, 1–38.
(eds.), Statistics with Confidence, Confidence Intervals and Statistical Guidelines, Vuorio, K., Lepistö, L. and Holopainen, A.-L. (2007) Intercalibra-
3rd edn, BMJ Books, London, UK., pp. 36–44. tions of freshwater phytoplankton analyses. Boreal Environ. Res., 12,
Duarte, C. M., Marrasé, C., Vaqué, D. and Estrada, M. (1990) Counting 561–569.
error and the quantitative analysis of phytoplankton communities. J. Willén, E. (1976) A simplified method of phytoplankton counting. Br.
Plankton Res., 12, 295–304. Phycol. J., 11, 265–278.
7You can also read