Pan-Genome of Novel Pantoea stewartii subsp. indologenes Reveals Genes Involved in Onion Pathogenicity and Evidence of Lateral Gene Transfer
←
→
Page content transcription
If your browser does not render page correctly, please read the page content below

microorganisms

Article
Pan-Genome of Novel Pantoea stewartii subsp. indologenes
Reveals Genes Involved in Onion Pathogenicity and Evidence
of Lateral Gene Transfer
Gaurav Agarwal *, Ronald D. Gitaitis and Bhabesh Dutta *

                                          Department of Plant Pathology, Coastal Plain Experiment Station, University of Georgia, Tifton, GA 31793, USA;
                                          dronion@uga.edu
                                          * Correspondence: gaurav.agarwal@uga.edu (G.A.); bhabesh@uga.edu (B.D.)

                                          Abstract: Pantoea stewartii subsp. indologenes (Psi) is a causative agent of leafspot on foxtail millet and
                                          pearl millet; however, novel strains were recently identified that are pathogenic on onions. Our recent
                                          host range evaluation study identified two pathovars; P. stewartii subsp. indologenes pv. cepacicola
                                          pv. nov. and P. stewartii subsp. indologenes pv. setariae pv. nov. that are pathogenic on onions and
                                          millets or on millets only, respectively. In the current study, we developed a pan-genome using
                                          the whole genome sequencing of newly identified/classified Psi strains from both pathovars [pv.
                                          cepacicola (n = 4) and pv. setariae (n = 13)]. The full spectrum of the pan-genome contained 7030 genes.
                                          Among these, 3546 (present in genomes of all 17 strains) were the core genes that were a subset of
                                          3682 soft-core genes (present in ≥16 strains). The accessory genome included 1308 shell genes and
                                          2040 cloud genes (present in ≤2 strains). The pan-genome showed a clear linear progression with

                                   >6000 genes, suggesting that the pan-genome of Psi is open. Comparative phylogenetic analysis
                                          showed differences in phylogenetic clustering of Pantoea spp. using PAVs/wgMLST approach in
Citation: Agarwal, G.; Gitaitis, R.D.;
                                          comparison with core genome SNPs-based phylogeny. Further, we conducted a horizontal gene
Dutta, B. Pan-Genome of Novel
Pantoea stewartii subsp. indologenes
                                          transfer (HGT) study using Psi strains from both pathovars along with strains from other Pantoea
Reveals Genes Involved in Onion           species, namely, P. stewartii subsp. stewartii LMG 2715T , P. ananatis LMG 2665T , P. agglomerans LMG
Pathogenicity and Evidence of Lateral     L15, and P. allii LMG 24248T . A total of 317 HGT events among four Pantoea species were identified
Gene Transfer. Microorganisms 2021, 9,    with most gene transfer events occurring between Psi pv. cepacicola and Psi pv. setariae. Pan-GWAS
1761. https://doi.org/10.3390/            analysis predicted a total of 154 genes, including seven gene-clusters, which were associated with
microorganisms9081761                     the pathogenicity phenotype (necrosis on seedling) on onions. One of the gene-clusters contained
                                          11 genes with known functions and was found to be chromosomally located.
Academic Editor: William Nasser

                                          Keywords: pangenome; horizontal gene transfer (HGT); core genome; accessory genome
Received: 15 July 2021
Accepted: 12 August 2021
Published: 18 August 2021

                                          1. Introduction
Publisher’s Note: MDPI stays neutral
with regard to jurisdictional claims in
                                                 The Pantoea complex is constituted by four species, namely, P. ananatis, P. stewartii, P.
published maps and institutional affil-
                                          allii and P. agglomerans that cause center rot of onions [1–4]. Three out of the four species in
iations.                                  the Pantoea species complex (P. ananatis, P. agglomerans and P. stewartii subsp. indologenes)
                                          are responsible for more than 80% of the reported cases of disease in onions [5]. Earlier,
                                          Mergaert et al. [6] reclassified Eriwinia stewartii as P. stewartii and proposed two subspecies
                                          namely, P. stewartii subsp. stewartii (Pss) and P. stewartii subsp. indologenes (Psi). Recently,
                                          we phenotypically and genotypically characterized seventeen Psi strains that are either
Copyright: © 2021 by the authors.
Licensee MDPI, Basel, Switzerland.
                                          pathogenic on both onions and millets or on millets only [7]. Based on a host-range
This article is an open access article
                                          evaluation, we proposed two new pathovars of Psi, namely, Psi pv. cepacicola pv. nov. and
distributed under the terms and
                                          Psi pv. setariae pv. nov. [7]. The pathovar Psi pv. cepacicola causes symptoms on the Allium
conditions of the Creative Commons        species (leek, onion, chive and Japanese bunching onion) and also on foxtail millet, pearl
Attribution (CC BY) license (https://     millet, and oat. However, Psi pv. setariae pv. nov. can only infect the members of Poaceae
creativecommons.org/licenses/by/          (foxtail millet, pearl millet, and oat) [7].
4.0/).

Microorganisms 2021, 9, 1761. https://doi.org/10.3390/microorganisms9081761                          https://www.mdpi.com/journal/microorganisms
Microorganisms 2021, 9, 1761                                                                                            2 of 19

                                     There has been a huge turnaround in terms of generating genomic resources mainly
                               driven by reduction in costs associated with next generation sequencing (NGS). As a result,
                               several studies have been conducted to comprehensively explore features specific to each
                               genome. The most widely explored genomic variants used in genome-wide studies are
                               single nucleotide polymorphisms (SNPs) that are utilized in both prokaryotes [8] and
                               eukaryotes [9–14]. Another widely used technique to explore variations in prokaryotic
                               genomes is the use of presence and absence variants (PAVs). These PAVs capture an often
                               evolving “accessory genome” of an organism. Another part of the genome(s), which is
                               conserved is regarded as a “core genome”. Together, the core and the accessory genomes
                               constitute a pan-genome of a species or sometimes across species for a given genus (also
                               regarded as super pan-genome) [15]. Hence, the core genome refers to key genes that
                               commonly exist in every member of a specific genome set, and the accessory genome
                               represents dispensable genes, which only exist in some of the genomes [16]. In prokaryotes,
                               a pan-genome can be open or closed depending on the similarity of the gene content.
                               Genomes with highly similar gene content make a closed pan-genome and genomes with
                               diverse gene content makes a pangenome open [17]. A pan-genome of a species is depen-
                               dent on the number of genomes involved in the dataset, the ability to integrate exogenous
                               DNA into its genome via horizontal gene transfer (HGT), and its ecological niche [18]. The
                               gain or loss of genes in bacteria are often mediated by HGT events and are among the
                               key processes in bacterial evolution [19]. HGT can result in the replacement of genetic
                               segments with donor homologues, often within species via. homologous recombination, or
                               via. the acquisition of new genetic material.
                                     In our earlier pan-genome study, we used 81 strains of P. ananatis (including both
                               pathogenic and non-pathogenic strains of onion) and performed pan-GWAS (pan-genome
                               wide association study) to predict genes involved in onion pathogenicity [8]. Our pan-
                               GWAS study was able to predict genes and gene clusters potentially involved in onion
                               pathogenicity and predicted several HGT events that occurred between onion-pathogenic
                               vs. onion-non-pathogenic strains. In addition, phylogeny based on PAVs was also able
                               to differentiate onion-pathogenic vs. non-pathogenic strains. In the current study, we
                               utilized the genome of Psi strains from both pathovars [pv. cepacicola (n = 4) and pv. setariae
                               (n = 13)] and developed a pan-genome with a conserved core and a flexible accessory
                               genome. Further, we performed a pan-GWAS study to identify genes in Psi pv. cepacicola
                               that are associated with onion pathogenicity and also predicted several HGT events that
                               occurred between Psi and other Pantoea spp. (P. stewartii subsp. stewartii LMG 2715T , P.
                               ananatis LMG 2665T , P. agglomerans LMG L15, P. allii LMG 24248T ). We further utilized
                               SNPs and PAVs of the core-genome to assess the phylogeny of both Psi pathovars.

                               2. Methods
                               2.1. Bacterial Strains, Identification, and Culture Preparation
                                    Seventeen Psi strains from both pathovars [pv. cepacicola (n = 4) and pv. setariae
                               (n = 13)] (Table 1) were used in this study that were phenotypically characterized in
                               our earlier study [7]. Out of the 17 strains, two strains, Psi pv. setariae LMG 2632T
                               (NZ_JPKO00000000.1) and Psi pv. setariae PNA 03-3 (GCA_003201175.1), were previ-
                               ously sequenced. Genome assemblies of the rest of the 15 Psi strains have been submit-
                               ted to NCBI under the Bioproject ID PRJNA670043 (genome submission: SUB8606059).
                               Whole-genome sequences of four types of strains of Pantoea spp. (P. stewartii subsp. in-
                               dologenes pv. setariae LMG 2632T (NZ_JPKO00000000.1); P. stewartii subsp. stewartii LMG
                               2715T (GCA_008801695.1); P. ananatis LMG 2665T (NZ_JMJJ00000000); P. allii LMG 24248T
                               (NZ_NTMH00000000)) and WGS of P. agglomerans L15 (NZ_CP034148) were used. Genomic
                               features of all 21 strains used in this study are listed in Table 1.
Microorganisms 2021, 9, 1761                                                                                                                3 of 19

     Table 1. Genome architecture details of Pantoea stewartii subsp. indologenes (pv. cepacicola and pv. setariae) and other Pantoea
     species used in this study.

                                                   Biosample               Genome                Size
  Strain Name             Pantoea spp.                                                                Contigs        CDSs      Genes      tRNAs
                                                   Accession               Accession            (Mbp)
 L15 $                    P. agglomerans        SAMN07109613           GCA_003860325.1           4.85         4       4456      4538       81
 LMG 24248 T$                   P. allii        SAMN07625522         NZ_NTMH00000000             5.24        57       4855      4925       69
 LMG 2632 T$                Psi setariae        SAMN02905159         NZ_JPKO00000000.1           4.68        35       4455      4521       65
 LMG 2665 T$                 P. ananatis        SAMN02740635           NZ_JMJJ00000000           4.93        17       4560      4632       71
 LMG 2715 T$           P. stewartii stewartii   SAMN12697580           GCA_008801695.1           4.52         1       4603      4677       73
 NCPPB 1562 *               Psi setariae        SAMN16866628         JADWWO000000000             4.87        96       4524      4602       77
 NCPPB 1877 *               Psi setariae        SAMN16866626         JADWWM000000000             4.77        83       4410      4487       76
 NCPPB 2275 *               Psi setariae        SAMN16866625         JADWWL000000000             4.77        79       4406      4481       74
 NCPPB 2281 *               Psi setariae        SAMN16866629         JADWWP000000000             4.70       103       4323      4399       75
 NCPPB 2282 *               Psi setariae        SAMN16866627         JADWWN000000000             4.87       101       4529      4608       78
 PANS_07_10 *               Psi setariae        SAMN16866621         JADWWH000000000             4.95       102       4603      4678       74
 PANS_07_12 *               Psi setariae        SAMN16866622          JADWWI000000000            4.95        86       4602      4674       71
 PANS_07_14 *               Psi setariae        SAMN16866623          JADWWJ000000000            4.78        90       4429      4404       74
 PANS_07_4 *                Psi setariae        SAMN16866619         JADWWF000000000             5.05       125       4686      4760       73
 PANS_07_6 *                Psi setariae        SAMN16866620         JADWWG000000000             5.10       117       4744      4816       71
 PANS_99_15 *               Psi setariae        SAMN16866624         JADWWK000000000             4.81        97       4425      4498       72
 PNA_15_2 *                 Psi setariae        SAMN16866618         JADWWE000000000             4.66        92       4266      4341       74
 PNA_03_3 *                Psi cepacicola       SAMN08776223           GCA_003201175.1           4.93        22       4571      4641       69
 PNA_14_11 *               Psi cepacicola       SAMN16866616         JADWWC000000000             4.68        77       4317      4390       72
 PNA_14_12 T *             Psi cepacicola       SAMN16866617         JADWWD000000000             4.68        73       4307      4380       72
 PNA_14_9 *                Psi cepacicola       SAMN16866615         JADWWB000000000             4.69        92       4325      4400       74
             $   Sequences were downloaded from the NCBI. T Denotes type strains. * Sequences utilized from Koirala et al., 2021 study.

                                       2.2. Identification of Presence and Absence Variations (PAVs) and Core Genome Phylogeny
                                             The gbk (genebank format) files of the draft-assembled and annotated genomes of
                                       Psi strains [7] using gethomologues [20] were used for pan-genome analyses. These gbk
                                       files were used to acquire the syntenic sequence clusters by get_homologues.pl using
                                       the OrthoMCL (OMCL) algorithm. The syntenic clusters generated were used to de-
                                       velop a pan-genome matrix showing the presence and absence variants (PAVs) using com-
                                       pare_clusters.pl. The matrix was also used to classify genes into the core, soft-core, shell and
                                       cloud genes using the parse_pangenome_matrix.pl (auxiliary script of get_homologues.pl).
                                       Core genes are defined as those present in all 17 Psi genomes whereas accessory genes are
                                       present in a subset of the 17 genomes. The accessory gene cluster was further divided into
                                       cloud and shell gene clusters. Soft-core genes occurred in 95% of the genomes. Cloud genes
                                       were present in ≤2 genomes and shell genes were comprised of the remaining genes [20].
                                       Distribution of cluster sizes as a function of the number of genomes these clusters contained
                                       was displayed using R with parse_pangenome_matrix.pl. Gower’s distance matrix was
                                       generated using the tab delimited pan-genome PAV file as the input and then executing
                                       shell script hcluster_pangenome_matrix.sh (auxiliary script of get_homologues) with R
                                       function hclust. A core genome phylogeny was produced using Parsnp of Harvest suite [21],
                                       which makes an alignment from localized co-linear blocks. The alignment was run using -r!,
                                       -c and -x options where, -r! was used to select a random reference genome from the list of
                                       genomes used in analysis, -c was used to include all 17 genomes forcibly in the core genome
                                       analysis, and -x flag was used to enable filtering of SNPs located in PhiPack [22]-identified
                                       regions of recombination. All polymorphic columns in the multiple alignment were flagged
                                       to identify: (1) repetitive sequence; (2) small LCB size; (3) poor alignment quality; (4) poor
                                       base quality; and (5) possible recombination. After running all filters, columns with filtered
                                       SNPs were displayed in the image. The final set of core-genome SNPs was used as an
                                       input to FastTree2 [23] for reconstruction of the whole-genome phylogeny. Since Harvest is
                                       developed to conduct intraspecific core-genome alignment studies, we used it only on the
                                       17 Psi strains and did not include other four species/subspecies of the Pantoea complex.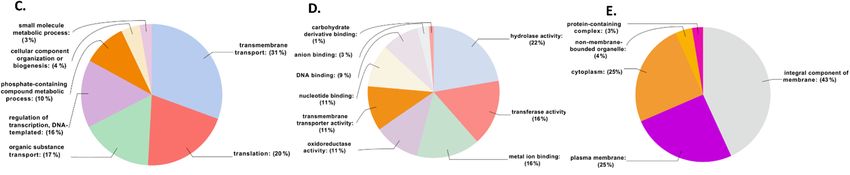
Microorganisms 2021, 9, 1761                                                                                            4 of 19

                               Gingr [21], a dynamic visual platform of Harvest, was used for visualizing the phylogenetic
                               tree.

                               2.3. Horizontal Gene Transfer (HGT) and Phylogenetic Analysis of Genomes of Pantoea Complex
                                     A phylogenetic tree was built for all input genomes using the protein sequences of
                               universal single copy genes (SCGs). To carry out HGT analysis, we included genomes of
                               four additional strains representing the four Pantoea species of the Pantoea complex, namely,
                               P. stewartii subsp. stewartii LMG 2715T , P. ananatis LMG 2665T , P. allii LMG 24248T and P.
                               agglomerans L15. Predicted protein sequences of all 21 genomes (17 Psi and four Pantoea spp.
                               stated above; Table 1) were used to search for the HMM (PFAM and TIGRFAM) [24,25]
                               profiles of these SCG proteins using HMMER [26]. Protein sequences for each HMM
                               profile were aligned using HMMER and were concatenated into a single-multiple-sequence
                               alignment using the GTDB tool kit [27]. Further, we utilized multiple-sequence alignment
                               file to build a phylogenetic tree. The tree file was visualized in iTOL [28]. Customized
                               groupings (A, B, C, and D) were made based on the tree. These customized groups of
                               genomes were used as input to study HGT events among the Pantoea spp. mentioned
                               above. MetaCHIP [29] was used to identify horizontal gene transfer (HGT) among the
                               customized assigned groups. MetaCHIP identified putative donor and recipient transfer
                               events within the 21 Pantoea strains (17 Psi and four Pantoea spp. stated above; Table 1)
                               based on combined similarity and phylogenetic incongruency.
                                     SNPs from the core genome and PAVs of Psi strains (n = 17) and other Pantoea spp.
                               including P. stewartii subsp. stewartii LMG 2715T , P. ananatis LMG 2665T , P. allii LMG
                               24248T and P. agglomerans L15 were identified, and a phylogenetic tree was constructed.
                               Pan-seq pipeline [30] was used to identify the core SNPs, and PAVs from the accessory
                               genomes. The output phylip files were used to construct phylogenetic trees based on SNPs
                               and PAVs. The PHYLIP files were imported into RaxML software [31] and PHYLIP trees
                               were constructed by using the “neighbor-joining” method with a bootstrap setting of 1000.
                               Further, a whole genome multi locus sequence typing (wgMLST) tree was also constructed.
                               To carry out this analysis, assembled contigs files of each of the 21 Pantoea spp. strains were
                               uploaded to PGAdb builder and a pan-genome allele database was constructed with 1000
                               iterations [32].

                               2.4. Pan-Genome-Wide Association Analysis and Annotations
                                    We utilized phenotypic data from Koirala et al. (2021) [7] where both Psi pv. cepacicola
                               and Psi pv. setariae strains were phenotyped based on their ability to cause symptoms on
                               onion seedlings. Only four of the Psi pv. cepacicola strains (PNA 03-3, PNA 14-9, PNA
                               14-11 and PNA 14-12) strains were able to cause foliar symptoms. Scoary [33] was used
                               to calculate associations among genes in the pan-genome and the pathogenic phenotype
                               on onion seedlings (a qualitative assessment; pathogenic vs. non-pathogenic association).
                               The output of this program comprised of a list of genes sorted by strength of association
                               with these traits. Genes with a naïve p-value ≤0.005 and corrected p-value (Benjamini-
                               Hochberg) of association < 0.25 were considered significant. The core, soft-core, shell, and
                               cloud genes were retrieved from the P. stewartii pan-genome and subjected to blastX against
                               the NR database. The blast output files generated in.xml format were used as input to
                               blast2GO. First, GO mapping was performed to retrieve the GO terms associated with blast
                               to form a pool of GO terms. Then GO annotation was carried out where the GO terms
                               from the pool of GO terms were assigned to query sequences. All sequences with GO
                               annotations were also annotated for enzyme code. GO term associations were classified
                               and plotted as biological process (BP), molecular function (MF), and cellular component
                               (CC). The FatiGO [34] package integrated into Blast2GO was used for statistical assessment
                               of annotation differences as following: core vs accessory, soft-core vs core, shell vs core,
                               and cloud vs core genes. This package uses the Fisher’s Exact Test and corrects for multiple
                               testing. Adjusted p-values of each GO term were reported based on the corrected p-value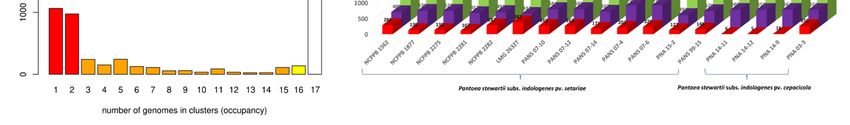
Microorganisms 2021, 9, x FOR PEER REVIEW 5 of 19
and plotted as biological process (BP), molecular function (MF), and cellular component
Microorganisms 2021, 9, 1761 (CC). The FatiGO [34] package integrated into Blast2GO was used for statistical assess-
5 of 19
ment of annotation differences as following: core vs accessory, soft-core vs core, shell vs
core, and cloud vs core genes. This package uses the Fisher’s Exact Test and corrects for
multiple testing. Adjusted p-values of each GO term were reported based on the corrected
by False by
p-value Discovery Rate (FDR)
False Discovery Ratecontrol. Genes involved
(FDR) control. in horizontal
Genes involved gene transfer
in horizontal (HGT)
gene transfer
were annotated using Blast2GO pipeline [35].
(HGT) were annotated using Blast2GO pipeline [35].
3.3.Results
Results
3.1. The P. stewartii subsp. indologenes Pan-Genome Architecture and Phylogeny
3.1. The P. stewartii subsp. Indologenes Pan-Genome Architecture and Phylogeny
Genome assembly is a pre-requisite to study the pan-genome of a given species.
Genome assembly is a pre-requisite to study the pan-genome of a given species. As-
Assembly sizes of the seventeen strains of Psi ranged from 4.6 (PNA 15-2) to 5.1 Mbp
sembly sizes of the seventeen strains of Psi ranged from 4.6 (PNA 15-2) to 5.1 Mbp (PANS
(PANS 07-6) with the number of contigs ranging from 22 (PNA 03-3) to 125 (PANS 07-4)
07-6) with the number of contigs ranging from 22 (PNA 03-3) to 125 (PANS 07-4) and the
and the number of genes ranging from 4341 (PNA 15-2) to 4816 (PANS 07-6) (Table 1).
number of genes ranging from 4341 (PNA 15-2) to 4816 (PANS 07-6) (Table 1). The full
The full spectrum of the pan-genome of Psi contained 7030 genes. Among these, 3546
spectrum of the pan-genome of Psi contained 7030 genes. Among these, 3546 genes (pre-
genes (present in all 17 strains) were part of the core genes and were a part of a subset of
sent in all 17 strains) were part of the core genes and were a part of a subset of 3682 soft-
3682 soft-core genes (present in ≥16 strains). The accessory genome included 1308 shell
core genes (present in ≥16 strains). The accessory genome included 1308 shell genes and
genes and 2040 cloud genes (present in ≤2 strains) (Figure 1A). The genome of each strain
2040 cloud genes (present in ≤2 strains) (Figure 1A). The genome of each strain contributed
contributed a conserved set of 3546 core genes and a variable number of accessory genes.
a conserved set of 3546 core genes and a variable number of accessory genes. Overall, soft-
Overall, soft-core genes contributed by each genome ranged from 3580 to 3682 genes,
core genes contributed by each genome ranged from 3580 to 3682 genes, including a con-
including a conserved set of 3546 genes. Shell genes ranged from 394 to 703 genes and the
served set of 3546 genes. Shell genes ranged from 394 to 703 genes and the cloud genes
cloud genes ranged from a minimum of five genes contributed by Psi pv. cepacicola PNA
ranged from a minimum of five genes contributed by Psi pv. cepacicola PNA 14-12 to a
14-12 to a maximum of 382 genes contributed by Psi pv. setariae TLMG 2632T (Figure 1B).
maximum of 382 genes contributed by Psi pv. setariae LMG 2632 (Figure 1B). Details of
Details of the number of core and accessory genes contributed by each strain are listed in
the number of core and accessory genes contributed by each strain are listed in (Table S1).
(Table S1).
Figure
Figure1. 1.Pan-genome
Pan-genomeanalysis ofof
analysis Pantoea
1717 stewartii
Pantoea subsp.
stewartii indologenes
subsp. genomes.
indologenes genomes. (A) Distribution
(A) Distributionofof
gene (cluster)
gene sizes
(cluster) as
sizes
a function of the
as a function ofnumber of genomes;
the number (B) Genes
of genomes; contributed
(B) Genes by each
contributed genome
by each thatthat
genome contributed to the
contributed pan-genome.
to the pan-genome.
The
Thepan-genome
pan-genomearchitecture
architecture of
of the 17 Psi
the 17 genomes, which
Psi genomes, which included
includedboth
bothpathovars,
pathovars,
revealed
revealedan anopen
openpan-genome
pan-genome (Figure
(Figure 2).
2). Exponential decay models
Exponential decay models [16,36]
[16,36] that
thatfitted
fittedthe
the
core gene clusters predicted a theoretical core genome of 3598 and 3524 genes
core gene clusters predicted a theoretical core genome of 3598 and 3524 genes (Figure 2A).(Figure 2A).
Further,
Further,totoconfirm
confirmthe
theopenness/closeness
openness/closeness of of the
the pan-genome,
pan-genome, the the theoretical
theoretical estimation
estimation
ofofthe pan-genome size was carried out using Tettelin’s exponential model
the pan-genome size was carried out using Tettelin’s exponential model fitted to fitted to the
the
OMCL accessory gene clusters. The pan-genome showed a clear linear progression
OMCL accessory gene clusters. The pan-genome showed a clear linear progression with with
>6000 genes, with ~43 new genes added on an average to the pan-genome as each new Psi
genome was added (Figure 2B). This indicated an open Psi pan-genome.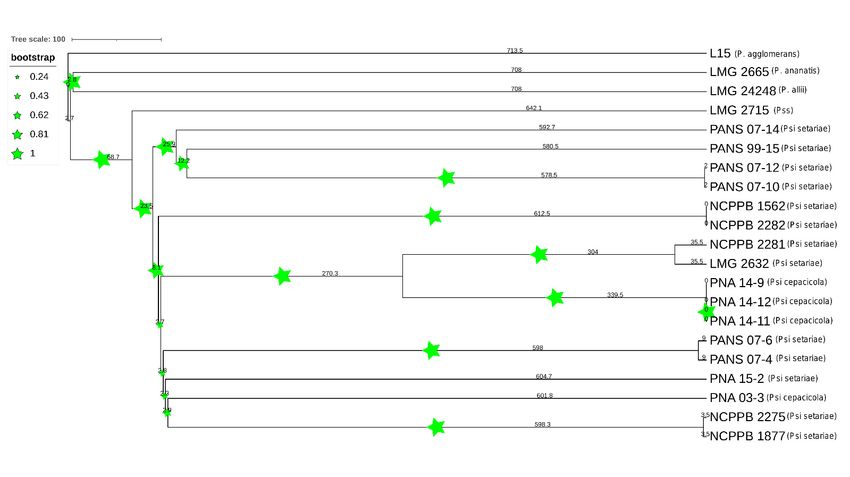
Microorganisms 2021, 9, x FOR PEER REVIEW                                                                                    6 of 19

Microorganisms 2021, 9, 1761                                                                                     6 ofPsi
                                 >6000 genes, with ~43 new genes added on an average to the pan-genome as each new   19
                                 genome was added (Figure 2B). This indicated an open Psi pan-genome.

     Figure 2. Theoretical estimation of the core and pan-genome sizes based on the exponential decay model. (A) Estimation of
      Figure 2. Theoretical estimation of the core and pan-genome sizes based on the exponential decay model. (A) Estimation
     core genome size based on the Willenbrock model fit to OMCL clusters and (B) Estimation of pan-genome size based on the
      of core genome size based on the Willenbrock model fit to OMCL clusters and (B) Estimation of pan-genome size based
     Tettelin model fit
      on the Tettelin   to OMCL
                      model  fit to clusters.
                                    OMCL clusters.

                                     Dendrograms were plotted based on the core and accessory genes identified in the Psi
                                      Dendrograms were plotted based on the core and accessory genes identified in the
                                pan-genome. The four components of the developed pan-genome of Psi, namely, core, soft
                                Psi pan-genome. The four components of the developed pan-genome of Psi, namely, core,
                                core, shell, and cloud genes, were used to assess the phylogeny of 17 Psi strains. All four
                                soft core, shell, and cloud genes, were used to assess the phylogeny of 17 Psi strains. All
                                components of the pan-genome used individually clustered the Psi pv. cepacicola strains
                                four components of the pan-genome used individually clustered the Psi pv. cepacicola
                                separately from the Psi pv. setariae strains. However, only one Psi pv. cepacicola (PNA
                                strains separately from the Psi pv. setariae strains. However, only one Psi pv. cepacicola
                                03-3) was distantly clustered with Psi pv. setariae strains when soft-core, shell, and cloud
                                (PNA 03-3) was distantly clustered with Psi pv. setariae strains when soft-core, shell, and
                                genes were used. The Psi pv. cepacicola strain PNA 03-3 clustered close to other three Psi
                                cloud genes were used. The Psi pv. cepacicola strain PNA 03-3 clustered close to other three
                                pv. cepacicola strains (PNA 14-12, PNA 14-11, PNA 14-9) only when core genes were used
                                Psi pv. cepacicola strains (PNA 14-12, PNA 14-11, PNA 14-9) only when core genes were
                                (Figure 3A–D).
                                used (Figure 3A–D).
                                3.2. Core Genome Genes Differentiated the Onion-Pathogenic P. stewartii subsp. indologenes pv.
                                cepacicola Strains from the Onion-Non-Pathogenic P. stewartii subsp. indologenes pv. setariae
                                Strains
                                     Among the seventeen newly discovered Psi strains, four Psi pv. cepacicola strains were
                                pathogenic on Allium spp. (onion, leek, chive, and bunching onion) and Poacea (oat, rye,
                                foxtail millet) species [7]. The remaining strains belonged to Psi pv. setariae, and were
                                pathogenic only on Poacea species (oat, rye, foxtail millet). Clustering based on the ANI
                                matrix of pan-genome resulted in phylogenic trees based on core, soft-core, shell, and
                                cloud genes (Figure 3). Core genes ANI matrix resulted in eleven clusters with three of the
                                four Psi pv. cepacicola strains clustered together and the fourth strain (PNA 03-3) placed
                                separately (Figure 3A). Soft-core ANI resulted in ten clusters (Figure 3B). Shell and cloud
                                genes (accessory genome) ANI resulted in two and eleven clusters, respectively. Two shell
                                gene clusters contained 16 out of the 17 Psi strains in one cluster and one strain (LMG
                                2632T ) in a separate clade (Figure 3C). Three out of the four Psi pv. cepacicola strains (PNA
                                14-9, PNA 14-11, and PNA 14-12) consistently clustered together with core or accessory
                                genes-based ANI.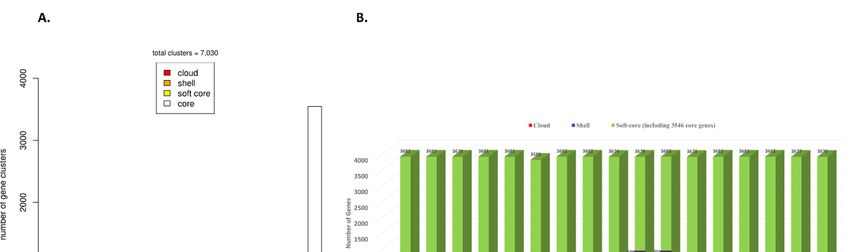
Microorganisms2021,
Microorganisms 2021,9,9,1761
x FOR PEER REVIEW 77of
of19
19
Figure3.3. Dendrogram
Figure Dendrogramof of17
17strains
strainsof ofPantoea
Pantoea stewartii subsp. indologenes
stewartii subsp. indologenes based
based on
on the
the core
core and
and accessory
accessory genes.
genes. (A)
(A) Den-
Den-
drogram
drogram based
based on on core
core genes,
genes, i.e.,
i.e., genes
genes present
present inin all
all17
17strains
strainsused
usedin
inthe
thestudy;
study;(B)
(B)Dendrogram
Dendrogram based
based on
onsoft-core
soft-core
genes,i.e.,
genes, i.e.,genes
genespresent
presentininatatleast
least95%
95%ofofthe
the strains;
strains; (C)(C) Dendrogram
Dendrogram based
based on on shell
shell genes;
genes; andand
(D)(D) Dendrogram
Dendrogram based
based on
on cloud
cloud genes,
genes, i.e., i.e., the genes
the genes specific
specific to each
to each strain
strain or shared
or shared by aby a maximum
maximum of two
of two strains.
strains.
3.2. Core Genome Genes Differentiated the Onion-Pathogenic P. stewartii subsp. indologenes pv.
3.3. Horizontal
cepacicola Gene
Strains Transfer
from (HGT) and Annotation
the Onion-Non-Pathogenic P. of Genes Involved
stewartii in HGT pv. setariae
subsp. indologenes
Five Pantoea species including 17 Psi strains (4 Psi pv. cepacicola and 13 Psi pv. setariae
Strains
strains) and one of P. ananatis T ), P. allii (LMG 24248T ), P. agglomerans
Among thestrain each newly
seventeen (LMGPsi
discovered 2665
strains, four Psi pv. cepacicola strains were
T ) were used for HGT analysis. Phyloge-
(L15), and P. stewartii subsp. stewartii (LMG 2715
pathogenic on Allium spp. (onion, leek, chive, and bunching onion) and Poacea (oat, rye,
netic classification
foxtail based
millet) species [7].onThe
the remaining
conserved SCG resulted
strains belonged in four groups
to Psi (a–d) (Figure
pv. setariae, 4A).
and were
Strains classified within these four groups were used to study the HGT
pathogenic only on Poacea species (oat, rye, foxtail millet). Clustering based on the ANI as explained in
the Section 2. A total of 317 HGT events including 314 donor and 299 recipient genes
matrix of pan-genome resulted in phylogenic trees based on core, soft-core, shell, and
among the five Pantoea species/pathovars were identified (Figure 4B, Table S2). Most of
cloud genes (Figure 3). Core genes ANI matrix resulted in eleven clusters with three of
the gene transfers (n = 95) occurred from PNA 03-3 (Psi pv. cepacicola) to PANS 07-4 (Psi
the four Psi pv. cepacicola strains clustered together and the fourth strain (PNA 03-3) placed
pv. setariae), followed by 76 HGTs from NCPPB 2275 (Psi pv. setariae) to PANS 07-4 (Psi
separately (Figure 3A). Soft-core ANI resulted in ten clusters (Figure 3B). Shell and cloud
pv. setariae), 32 from NCPPB2281 (Psi pv. setariae) to PANS 07-4 (Psi pv. setariae), and 27
genes (accessory genome) ANI resulted in two and eleven clusters, respectively. Two shell
from NCPPB 2275 to PNA 07-10 (Psi pv. setariae). The strain NCPPB 2275 (Psi pv. setariae)
gene clusters contained 16 out of the 17 Psi strains in one cluster and one strain (LMG
transferred (donated) a maximum number of 112 genes, followed by PNA 03-3 (Psi pv.
2632T) in a separate clade (Figure 3C). Three out of the four Psi pv.cepacicola strains (PNA
cepacicola; n = 100) and NCPPB 2281 (Psi pv. setariae; n = 35), and others donated less than
14-9, PNA 14-11, and PNA 14-12) consistently clustered together with core or accessory
20 genes. Similarly, among the recipient strains, PANS 07-4 (Psi pv. setariae) received a
genes-based ANI.
maximum of 211 genes followed by PANS 07-10 (Psi pv. setariae; n = 40) and the remaining
strains received less than 20 genes (Figure 4B, Table S2). There were two compulsive donor
strains (Psi pv. setariae NCPPB 2275 and Psi pv. setariae NCPPB 2281) that did not feature as
07-4 (Psi pv. setariae), 32 from NCPPB2281 (Psi pv. setariae) to PANS 07-4 (Psi pv. setariae),
and 27 from NCPPB 2275 to PNA 07-10 (Psi pv. setariae). The strain NCPPB 2275 (Psi pv.
setariae) transferred (donated) a maximum number of 112 genes, followed by PNA 03-3
(Psi pv. cepacicola; n = 100) and NCPPB 2281 (Psi pv. setariae; n = 35), and others donated
less than 20 genes. Similarly, among the recipient strains, PANS 07-4 (Psi pv. setariae) re-
Microorganisms 2021, 9, 1761 8 of 19
ceived a maximum of 211 genes followed by PANS 07-10 (Psi pv. setariae; n = 40) and the
remaining strains received less than 20 genes (Figure 4B, Table S2). There were two com-
pulsive donor strains (Psi pv. setariae NCPPB 2275 and Psi pv. setariae NCPPB 2281) that
did not feature
recipients. as recipients.
Similarly, Similarly,
two recipient two(Psi
strains recipient strains
pv. setariae LMG(Psi2632
pv. setariae
T and PsiLMGpv. 2632
T
setariae
and Psi pv. setariae NCPPB 1562) did not feature as donors
NCPPB 1562) did not feature as donors (Figure 4B, Table S2). (Figure 4B, Table S2).
Figure Phylogeny-based
4. 4.
Figure Phylogeny-basedhorizontal
horizontalgene
genetransfer
transfer(HGT)
(HGT) among
among 1717 strains
strains of Pantoeastewartii
of Pantoea stewartiisubsp. indologenes
subsp.indologenes strains
strains
and four
and other
four species
other thePantoea
speciesofofthe complex, namely, P. ananatis,
Pantoeacomplex, P. stewartii
ananatis, P. stewartiisubsp. stewartii,
subsp.stewartii, P.P.agglomerans,
agglomerans,andand P. allii.
P. allii.
(A)(A) Phylogenetic
Phylogenetic treeofofPantoea
tree Pantoeaspp.
spp. (n
(n =
= 21)
21) strains
strainsbased
basedononmultiple-sequence
multiple-sequence alignment.
alignment.Phylogenetic
Phylogenetic tree tree
resulted in
resulted
four clusters
in four clusters (a–d). Size
(a–d). Size of
of circles
circlesrepresent
representthe thebootstrap
bootstrapvalues
valuesininthat
thatorder;
order;(B)
(B)Predicted
Predicted gene
geneflow
flowwithin
withinthethe
four
four
phylogenetic
phylogenetic clustersofofPantoea
clusters Pantoeaspp.
spp.Bands
Bandsconnect
connect donors
donors and
and recipients,
recipients,with
withthethewidth
widthofofthe
theband
bandcorrelating
correlating to to
thethe
number of HGTs and the color corresponding to the donors. Numbers on the circumference of circos plot represent the
number of HGTs and the color corresponding to the donors. Numbers on the circumference of circos plot represent the
number of genes that underwent horizontal gene transfers. The four arcs (a–d) of circos represent the four phylogenetic
number of genes that underwent horizontal gene transfers. The four arcs (a–d) of circos represent the four phylogenetic
clusters of Pantoea spp. strains; (C–E) Graphical annotations of sequences involved in HGT as per the assigned GO terms:
(C) shows the function of genes assigned to biological processes, (D) shows the function of genes assigned to molecular
functions, and (E) represents the function of genes assigned to cellular components.
3.4. Annotations of Genes Involved in Horizontal Gene Transfer (HGT)
Further, the donor and recipient proteins coded by genes involved in HGT were
annotated. A non-redundant set of 607 genes coding for proteins involved in HGT showed
blast hits. A total of 499 out of 607 genes that showed blast hits were mapped and annotated
(Table S3). Each of the 499 genes involved in HGT were assigned GO IDs from a minimum
of one to a maximum of eight. Eight genes were assigned to a maximum of eight GO IDs
followed by 23 genes assigned to seven, 26 genes to six, 57 genes to five, 86 genes to four, 107
to three, 80 genes to two, and the remaining 112 genes to one GO ID (Table S4). Among all
the HGTs, ABC transporter permease featured in a maximum of eight HGT events followed
by GNAT family N-acetyltransferase in seven, cytochrome ubiquinol oxidase subunit I in
six, and outer membrane lipoprotein chaperone in five HGT events (Table S3). Based on
the assigned GO IDs, HGT genes were classified into biological process (BP), molecular
function (MF), and cellular component (CC). Under BP, the maximum number of genes
involved in HGT were involved in transmembrane transport (31%), followed by genes
involved in translation (20%), and only 3% were involved in small molecule metabolicMicroorganisms 2021, 9, 1761 9 of 19
processes (Figure 4C). Under MF, 22% were categorized with hydrolase activity, followed by
16% that were categorized as transferase activity and metal binding. The smallest number
of HGTs were categorized as carbohydrate-derivative binding (Figure 4D). In CC, most
of the genes were categorized under integral component of membrane (43%) followed by
25% each under plasma membrane and cytoplasm and the minimum number as a protein-
containing complex (3%) (Figure 4E). Further, we investigated various pathways that
these donor and recipient genes were involved. A total of 66 biochemical pathways were
identified using the KEGG database where HGT genes were involved. Purine fatty acid
Microorganisms 2021, 9, x FOR PEER REVIEW
biosynthesis, pyrimidine, nicotinate, and nicotinamide metabolic pathways featured10most
of 19
of the HGT genes. Purine metabolism showed 11 genes, fatty acid biosynthesis showed
six, and pyrimidine and nicotinamide metabolism showed five genes each. Remaining
metabolic pathways involved three, two, or one gene(s) (Figure 5, Table S5).
Figure 5. Annotated genes involved in horizontal gene transfer (HGT) with functions assigned under biochemical, metabolic,
and physiological pathways operational in Pantoea stewartii subsp. indologenes.
Figure 5. Annotated genes involved in horizontal gene transfer (HGT) with functions assigned under biochemical, meta-
3.5. Comparative
bolic, and physiological pathways operationalPAVs, Corestewartii
in Pantoea SNPs and Whole
subsp. Genome Multi Locus Sequence Typing (wgMLST)
indologenes.
Based Phylogeny
A comparative
3.5. Comparative PAVs,phylogenetic
Core SNPs and analysis
Whole was conducted
Genome using
Multi Locus PAVs and
Sequence core genome
Typing
SNPs. Phylogenomic
(wgMLST) Based Phylogeny analysis using PAVs and SNPs showed both P. ananatis (LMG 2665T )
T
and P. allii (LMG 24248 ) were outliers. However, P. agglomerans (L15) grouped together
A comparative phylogenetic analysis was conducted using PAVs and core genome
with the same Psi pv. setariae strains using both PAVs and SNPs (Figure 6). The strain TP.
SNPs. Phylogenomic analysis using PAVs and SNPs showed both P. ananatis (LMG 2665 )
stewartii subsp. stewartii (LMG 2715T ) clustered together with PANS 07-4 (Psi pv. setariae)
and P. allii (LMG 24248T) were outliers. However, P. agglomerans (L15) grouped together
and PANS 07-6 (Psi pv. setariae) when plotted using PAVs. However, core SNPs were used
with the same Psi pv. setariae strains using both PAVs and SNPs (Figure 6). The strain P.
and clustered with Psi pv. cepacicola, although they did not share the same node. Three
stewartii subsp. stewartii (LMG 2715T) clustered together with PANS 07-4 (Psi pv. setariae)
of the four Psi pv. cepacicola strains (PNA 14-12, PNA 14-11, and PNA 14-9) clustered
and PANS 07-6 (Psi pv. setariae) when plotted using PAVs. However, core SNPs were used
together when both with PAVs and core SNPs were used. The fourth Psi pv. cepacicola
and clustered with Psi pv. cepacicola, although they did not share the same node. Three
strain (PNA 03-3) clustered with Psi pv. setariae strains when PAVs were used. However,
of the four Psi pv. cepacicola strains (PNA 14-12, PNA 14-11, and PNA 14-9) clustered to-
when core SNPs were used, PNA 03-3 formed a separate clade between LMG 2632T (Psi
gether when both with PAVsT and core SNPs were used. The fourth Psi pv. cepacicola strain
pv. setariae) and LMG 2665 (P. ananatis). Overall, with both PAVs and SNPs the Psi pv.
(PNA 03-3)
cepacicola andclustered with Psistrains
Psi pv. setariae pv. setariae strains
clustered when
in two PAVs groups,
separate were used. However,
except for PNA when
03-3
core SNPs were used, PNA 03-3 formed a separate clade between LMG
(Figure 6). PAVs along with SNPs were identified using pan-seq to conduct comparative 2632 T (Psi pv.
setariae) and LMG
phylogenetic 2665As
analysis.
T (P. ananatis). Overall, with both PAVs and SNPs the Psi pv. ce-
seen with SNPs and PAVs, wgMLST clustered Psi pv. cepacicola
pacicola and Psi pv.
strains together setariae
except strains
for the clustered
strain in two
PNA 03-3, whichseparate groups,
clustered except
with Psi for PNA
pv. setariae 03-3
strains
(Figure 6). PAVs along with SNPs were identified using pan-seq to conduct comparative
(Figure 7). Strains of four other species of Pantoea used in this study (P. agglomerans, P.
phylogenetic analysis. As seen with SNPs and PAVs, wgMLST clustered Psi pv. cepacicola
strains together except for the strain PNA 03-3, which clustered with Psi pv. setariae strains
(Figure 7). Strains of four other species of Pantoea used in this study (P. agglomerans, P.
ananatis, P. allii, P. stewartii subsp. stewartii) branched separately from Psi strains used.
Like the PAV-based phylogenetic tree, the wgMLST tree showed P. stewartii subsp. stew-Microorganisms 2021, 9, 1761 10 of 19
ananatis, P. allii, P. stewartii subsp. stewartii) branched separately from Psi strains used. Like
the PAV-based phylogenetic tree, the wgMLST tree showed P. stewartii subsp. stewartii
(LMG 2715T ) to be the closest to Psi pv. setariae out of the four Pantoea spp. compared
(Figures 6 and 7). However, wgMLST-based phylogeny branched out four Pantoea species
Microorganisms 2021, 9, x FOR PEERfrom Psi strains, which was not observed in PAV or SNP-based phylogeny. Further,
REVIEW to
11 of 19
rule out the possibility that recombination events within the 17 Psi strains could interfere
with core-genome-SNP-based phylogeny, we conducted a phylogenetic study of Psi strains
where recombination sites were excluded (Figure S1). The results showed that the Psi
Psi pv. cepacicola strain (PNA 03-3) clustered away from the remaining three Psi pv. ce-
pv. cepacicola strain (PNA 03-3) clustered away from the remaining three Psi pv. cepacicola
pacicola strains, as was observed with PAVs-, SNPs- and wgMLST-based phylogeny.
strains, as was observed with PAVs-, SNPs- and wgMLST-based phylogeny.
Figure 6. Comparative phylogeny of onion-pathogenic and onion-non-pathogenic strains of Pantoea stewartii subsp.
Figure 6. Comparative phylogeny of onion-pathogenic and onion-non-pathogenic strains of Pantoea stewartii subsp. indol-
indologenes based
ogenes based on core
on core genome
genome SNPsSNPs
and and presence
presence and absence
and absence variations
variations (PAVs).
(PAVs). (A) Phylogenetic
(A) Phylogenetic tree constructed
tree constructed using
using
PAVsPAVs
usingusing RAxML;
RAxML; (B) Phylogenetic
(B) Phylogenetic tree constructed
tree constructed usingusing
core core
SNPsSNPs
usingusing RAxML.
RAxML. Numerical
Numerical valuesvalues in decimal
in decimal rep-
represent the
resent the branch
branch length.
length. Longer
Longer branch
branch length
length indicates
indicates higher
higher genetic
genetic divergence.
divergence.
3.6. Pan-Genome-Wide Association Study
An association study was conducted using the qualitative phenotyping data (pathogenic-
ity on onion seedling) and the core and accessory genes. The goal was to identify genes
responsible for pathogenicity of Psi strains in onion. Scoary predicted a total of 154 genes
associated with the phenotype (Table S6). Among the 154 genes, we found seven clusters
of genes associated with the phenotype. There were three gene clusters with 5, 12, and 11
genes that were highly significant based on p-values (p-value ≤ 0.005). Two out of the three
clusters contained only non-annotated hypothetical protein coding genes. However, one
cluster contained 11 protein coding genes (Table 2). These 11 genes coded for Pyridoxal
5’-phosphate synthase, AMP-binding protein, MFS transporter, phosphoglycerate kinase,
FAD-NAD(P)-binding protein, phosphoenolpyruvate phosphomutase, NAD(P)-binding
domain-containing protein, N-acetyl-gamma-glutamyl-phosphate reductase, alcohol dehy-
drogenase catalytic domain-containing protein, iron containing alcohol dehydrogenase,
and a LysE-family-translocator. A Blast search against the PNA 97-1R genome assembly
(GCA_002952035.2) identified all genes except the last gene (LysE-family translocator) in
the cluster. Interestingly, the first 10 genes in the cluster are chromosomally localized, but
the last gene is localized in the large plasmid (Table S7).
Figure 7. Phylogenetic tree based on whole genome multi-locus sequence typing (WgMLST). Dendrogram for 21 Pantoea
spp. strains was constructed using assembled genome contigs. Size of stars represents the boot strap values and numbers
represent the branch length. PSS is Pantoea stewartii subsp. stewartii.Figure 6. Comparative phylogeny of onion-pathogenic and onion-non-pathogenic strains of Pantoea stewartii subsp. indol-
ogenes based on core genome SNPs and presence and absence variations (PAVs). (A) Phylogenetic tree constructed using
PAVs using RAxML; (B) Phylogenetic tree constructed using core SNPs using RAxML. Numerical values in decimal rep-
Microorganisms 2021,
resent the 9, 1761
branch length. Longer branch length indicates higher genetic divergence. 11 of 19
Figure 7. Phylogenetic tree based on whole genome multi-locus sequence typing (WgMLST). Dendrogram for 21 Pantoea
spp. strains was constructed using assembled genome contigs. Size of stars represents the boot strap values and numbers
Figure 7. Phylogenetic tree based on whole genome multi-locus sequence typing (WgMLST). Dendrogram for 21 Pantoea
represent the branch length. PSS is Pantoea stewartii subsp. stewartii.
spp. strains was constructed using assembled genome contigs. Size of stars represents the boot strap values and numbers
represent the branch length. PSS is Pantoea stewartii subsp. stewartii.
Table 2. List of genes with annotated function in the cluster identified in Pantoea stewartii subsp. indologenes by Pan-GWAS
analysis.
Gene ID Function * Sensitivity Specificity Naive_p
58220_pdxH_2 Pyridoxal 5’-phosphate synthase 75 100 0.0059
58221_dltA AMP-binding protein 75 100 0.0059
58222_ydeE MFS transporter 75 100 0.0059
58223_pgk-tpi Phosphoglycerate kinase 75 100 0.0059
58225_spuC FAD/NAD(P)-binding protein 75 100 0.0059
58226_pepM Phosphoenolpyruvate mutase 100 100 0.0004
NAD(P)-binding domain-containing
58227_Hydroxypyruvate_reductase 75 100 0.0059
protein
N-acetyl-gamma-glutamyl-phosphate
58228_argC_1 75 100 0.0059
reductase
Alcohol dehydrogenase catalytic
58229_lgoD_1 75 100 0.0059
domain-containing protein
58230_Iron_containing_alcohol Iron containing alcohol
75 100 0.0059
dehydrogenase dehydrogenase
58231_rhtC_1 LysE-family-translocator 75 100 0.0059
* Gene annotation was conducted using a blast search against NR database on NCBI.
3.7. Annotation of Pantoea stewartii subsp. indologenes Pan-Genome
The core and accessory genomes were annotated as genes involved in BP, MF, and
CC (Figure S2). Under BP: response to stimulus, metabolic process, and cellular process
were common in core, soft-core, shell and cloud genes. Regulation of biological process
was specific to soft-core genes and shell genes lacked biological regulation and regulation
of biological process functions. Under MF, catalytic and binding activities were common in
all the core and accessory genes. However, genes coding for molecular function regula-
tors were specific to the soft-core component of the pan-genome and shell genes lacked
transporter activity. The genes in the CC category were assigned to the cellular anatomicalMicroorganisms 2021, 9, 1761 12 of 19
entity and intracellular component (Figure S2). Further, we performed statistical assess-
ment of annotation differences between core and accessory genes. When the core genome
was compared with the accessory genome, catalytic activity, cellular process, metabolic
(cellular) process, binding and nitrogen compound metabolic processes were the top six
highly represented GO terms. When the soft-core was compared with the core, organic
cyclic/heterocyclic compound binding, intrinsic/integral membrane component, small
molecule binding, and localization were highly represented GO terms. When shell genes
were compared with core-genes, they showed nucleic acid binding, heterocyclic/organic
cyclic compound binding, DNA binding, and macromolecule (cellular) metabolic process
as highly represented GO terms. Similarly, cloud genes compared with core-genes showed
the same highly represented GO terms. However, cloud vs. core was different from shell
vs. cloud in terms of intracellular (membrane) bounded organelle, extracellular space, and
multicellular-organismal process GO terms specific to the cloud genome. Cytoskeleton
organization and symbiotic process were specific to shell only (Figure S3).
4. Discussion
Pantoea stewartii subsp. indologenes causes a leafspot of foxtail millet and pearl millet,
a rot of pineapple, and one strain has also been isolated from the cluster bean (Cyamopsis
tetragonolobus) [6]. Recently, P. stewartii subsp. indologenes strains (Psi pv. cepacicola) were
identified that caused symptoms similar to the center rot of onions [2]. These bacterial
species/pathovar are not as prevalent as P. ananatis in Georgia or elsewhere but are known
to cause center rot disease in onions. Genome analysis provides insights about the genes
involved in pathogenicity and probable virulence mechanism(s). Moreover, it is important
to know the architecture of pan-genome, phylogeny, and evolutionary association of P.
stewartii subsp. indologenes strains with other Pantoea spp. and similarity or uniqueness in
the onion-virulence repertoire. We therefore conducted a pan-genome study of seventeen
newly identified Psi strains from both pathovars [pv. cepacicola (n = 4) and pv. setariae (n
= 13)] and developed a core and a pan-genome followed by annotation of the core and
accessory genes. Further, we carried out a pan-GWAS study and identified gene(s) associ-
ated with pathogenicity in onions. Phylogenetic and HGT studies were also conducted to
understand the role that SNPs, PAVs, and HGTs have on the phylogeny of these strains.
4.1. Pantoea stewartii subsp. indologenes Pan-Genome and Horizontal Gene Transfer
In the current study, we identified 3546 core genes, 5 to 382 cloud genes, and 394 to 703
shell genes. A similar study using 81 P. ananatis strains identified 3153 core genes and cloud
genes ranging from 1000 to 6808 [8]. We observed a stark difference in the number of cloud
genes when compared with our earlier study on P. ananatis. A slightly higher number of
core genes and a lesser number of cloud genes identified in the current study are expected
to change in the future with an increase in the number of Psi genomes being added to
the pan-genome. Fewer accessory genes were observed as compared with our previous
study [8]. Fewer accessory genes in this study can be a result of HGT events because gene
exchanges due to HGT can lead to extensive gene repertoire differences among closely
related species or within species [37]. This may partly explain why a smaller number
of cloud genes were identified in three Psi pv. cepacicola strains (PNA 14-11, PNA 14-12,
and PNA 14-9) as compared with the rest of the Psi strains used in this study. Perhaps
as more Psi pv. cepacicola genomes are included, the number of core genes may decrease
and accessory genes may increase, as indicated in other bacterial pan-genomes (Escherichia
coli) [38].
A dynamic pan-genome is also dependent on the frequent HGT events it encounters
during evolution. We therefore studied HGT within Psi strains and among the four species
of the Pantoea complex (P. ananatis, P. agglomerans, P. stewartii subsp. stewartii, and P. allii).
The maximum number of HGT events occurred from PNA 03-3 (Psi pv. cepacicola) to PANS
07-4 (Psi pv. setariae), which may explain the phylogenetic clustering of PNA 03-3 with
PANS 07-6 and PANS 07-4 using the shell and cloud genes. This in contrast to three Psi pv.Microorganisms 2021, 9, 1761 13 of 19
cepacicola strains, namely, PNA 14-11, PNA 14-12, and 14-9 that contained 6, 5, and 18 cloud
genes, respectively; Psi pv. cepacicola strain PNA 03-3 contained 259 cloud genes, which is
similar to the number of cloud genes exhibited by Psi pv. setariae strains (range: 107 to 382).
It seems that HGT events deeply impacted the gene loss in the abovementioned three Psi
pv. cepacicola strains.
4.2. An Open Pan-Genome of Pantoea stewartii subsp. indologenes
The pan-genome approach is important for exploring the genomic repertoires of a
phylogenetic lineage of microbes [39]. The pan-genome of Psi showed a linear progression
with >6000 genes, with ~43 new genes adding on average to the pan-genome with each new
Psi genome sequenced, suggesting that it was open and attributed to frequent evolutionary
changes mediated by gene(s) gain and loss resulting due to HGT events. The open feature
of Psi was consistent with P. ananatis and Geobacillus spp. datasets [8,17,40], as opposed to
other species, such as Bifidobacterium breve and Staphylococcus lugdunensis, which depicted a
closed trend [41,42].
4.3. Phylogenetic Study of Pantoea stewartii subsp. indologenes and Other Pantoea spp. Complex
A comparative phylogenetic approach was undertaken to evaluate the phylogeny of
both Psi pathovars compared to other Pantoea spp. We used PAVs, SNPs, and wgMLST
approaches to understand the differences in the phylogeny of Psi strains along with four
Pantoea spp. based on the underlying genomic variants. The core genome with conserved
genes instead of accessory genome with PAVs may convey a true measure of phylogeny.
We therefore inferred our phylogenetic analysis based on core genome analysis. We found
ANI based on core genes clustered Psi pv. cepacicola strains closely. However, soft-core
genes ANI clustered one Psi pv. cepacicola strain (PNA 03-3) distantly from the other three
strains. Similar, observations were made when shell and cloud genes were used to conduct
the phylogenetic analysis. This suggests that onion-pathogenic Psi pv. cepacicola strains
and onion-non-pathogenic Psi pv. setariae strains could be distinguished using core genes,
which was not the case with accessory genes. Clustering based on the core and accessory
genome ANI showed a slight difference, indicating the evolutionary and pathogenicity
relationship was better depicted with core genes than the accessory genes. However, the
number of input genomes may have a role to play and core genes-based phylogeny could
probably change if the number of strains/genomes is further increased. It could also be
possible that the core genome is impacted by HGT or homologous recombination and, as a
result, the phylogenetic relationship based on core genes is obscured or distorted [43].
SNPs are vertically inherited and are one of the dominant forms of evolutionary change
that have become an indispensable tool for phylogenetic analyses [44–46]. Hence, core
genes were used to classify onion pathogenic Psi pv. cepacicola vs. onion non-pathogenic
Psi pv. setariae strains. This was performed by identifying SNPs from the core genome and
performing a phylogenetic analysis. Core SNPs clustered Psi pv. cepacicola strains together
except for one strain, PNA 03-3.
Genomic regions that may have been involved in past recombination events should be
excluded from phylogenetic analyses to produce more accurate phylogeny [47]. Therefore,
we conducted another core-genome-SNPs-based phylogeny wherein the recombination
events were excluded; however, despite the removal, we found similar results that we
observed using SNPs- and PAVs-based phylogeny. We expected that excluding the recom-
bination sites would result in clustering of PNA 03-3 (Psi pv. cepacicola) with the other three
Psi pv. cepacicola strains (PNA 14-11, PNA 14-12 and PNA 14-9); however, that was not the
case. This may in part indicate that the strain PNA 03-3 is evolutionarily distinct from the
other Psi pv. cepacicola strains (PNA 14-11, PNA 14-12, and PNA 14-9).
Our earlier study showed that Psi pv. cepacicola PNA 03-3 was highly aggressive
on leek, foxtail millet, and pearl millet, whereas it was moderately aggressive on onion,
chive, Japanese bunching onion, and oat. Other Psi pv. cepacicola strains (PNA 14-9, PNA
14-11, PNA 14-12) were moderately-to-highly aggressive on onion, foxtail millet, and pearlMicroorganisms 2021, 9, 1761 14 of 19
millet but were moderate-to-less aggressive on leek, chive, Japanese bunching onion, and
oat [7]. We believe that this difference in aggressiveness is represented by core SNPs.
Additionally, Psi pv. cepacicola PNA 03-3 is more closely related to P. ananatis (LMG 2665T ),
which is reflected in the core SNPs-based phylogeny. The WgMLST, an extended concept
of MLST, is complementary to PAVs-based phylogenetic analysis [8]. As expected, we
observed a similar pattern of phylogenetic classification of strains both with PAVs- and
wgMLST-based phylogeny. Particularly, Psi pv. cepacicola PNA 03-3 was clustered closely
with Psi pv. setariae strains (NCPPB 2275 and NCPPB 1877) in both PAVs- and wgMLST-
based phylogenetic analysis. These observations reiterated potential phylogenetic and
evolutionary differences between the Psi pv. cepacicola strains, particularly with PNA 03-3
vs. PNA 14-11, PNA 14-12, and PNA 14-9.
4.4. Gene Cluster Identified from Pan-GWAS Analysis
The PAVs identified using Psi strains (n = 17) and the phenotyping data, when sub-
jected to pan-GWAS, identified a gene cluster associated with pathogenicity in the Allium
species. The phenotyping data were utilized from our earlier study [7]. Pan-GWAS identi-
fied several genes that were associated with the pathogenicity on onion seedlings. Out of
all the genes identified (n = 154), a cluster of 11 well-annotated genes was identified and
found to be strongly associated with pathogenicity in onion seedlings. Ten genes out of
the eleven associated genes were found to be present in three out of the four pathogenic
Psi pv. cepacicola strains (PNA 14-9, PNA 14-11, and PNA 14-12). However, there was
one gene annotated as phosphoenolpuruvate mutase (pepM) that was present in all four
pathogenic strains. Interestingly, based on further analysis it was found that the pepM gene
in PNA 03-3 belongs to the previously known ‘HiVir’ cluster similar to that reported in
the onion-pathogenic P. ananatis strains. In contrast, pepM gene in other Psi pv. cepacicola
strains (PNA 14-9, PNA 14-11, and PNA 14-12) is a part of a novel cluster distinct from the
‘HiVir’ cluster. Hence, it is important to characterize the role of the pepM gene in Psi on
onion pathogenicity in both clusters.
The novel gene cluster starts with a pyridoxal 5’-phosphate synthase (pdxH_2) gene,
which catalyzes pentose and triose isomerizations, imine formation, amine addition, and
ring formation, all in a single enzymatic system [48,49]. It is involved in ammonia trans-
port [50]. The second gene of the cluster codes for the AMP binding protein. AMP binding
proteins in bacteria are regarded as global activator proteins that are required to regulate
the gene transcription [51]. The third gene (ydeE) in the cluster was an efflux MFS trans-
porter known to export peptides [52]. A Pgk-tpi protein coding gene that is involved in the
sub-pathway, which synthesizes D-glyceraldehyde 3-phosphate from glycerone phosphate
(a part of the pathway glycolysis which is itself part of carbohydrate degradation), was
next in the cluster. Pgk-tpi codes for enzymes phosphoglycerate kinase and triosephosphate
isomerase that form a covalent bifunctional enzyme complex [53]. The next gene in the
gene cluster codes for a FAD/NAD(P)-binding protein. The NAD(P)-binding enzymes
are involved in catalyzing redox or non-redox reactions [54]. Interestingly, the next gene
in the cluster (pepM) codes for phosphoenolpuruvate mutase, which was the first gene of
the HiVir cluster identified in P. ananatis [55]. It was identified as the first pathogenicity
factor associated with the fitness of P. ananatis as well as with symptom development in
infected onion leaves and bulbs [55]. Potentially, the pepM gene (novel gene-cluster) in Psi
pv. cepacicola strains (PNA 14-9, PNA 14-11, and PNA 14-12) may also play a similar role
in onion-pathogenicity. As mentioned above, the role of this gene on onion-pathogenicity
needs to be investigated.
The next gene in the cluster codes for NAD(P)-binding domain-containing protein,
which catalyzes the NADPH-dependent reactions. For example, hydropxypyruvate re-
ductase carries out the reduction of glyoxylate and hydroxypyruvate into glycolate and
glycerate, respectively [56–58]. N-acetyl-gamma-glutamyl-phosphate reductase is coded
by argC1 gene in the cluster. It catalyzes the NADPH-dependent reduction of N-acetyl-
5-glutamyl phosphate to yield N-acetyl-L-glutamate 5-semialdehyde. This enzyme isYou can also read