Paracetamol Is Associated with a Lower Risk of COVID-19 Infection and Decreased ACE2 Protein Expression: A Retrospective Analysis - MDPI
←
→
Page content transcription
If your browser does not render page correctly, please read the page content below
Article
Paracetamol Is Associated with a Lower Risk of COVID-19
Infection and Decreased ACE2 Protein Expression:
A Retrospective Analysis
Nuno Santos Leal † , Yizhou Yu † , Yuwen Chen                         , Giorgio Fedele and Luís Miguel Martins *

                                          MRC Toxicology Unit, Gleeson Building, Tennis Court Road, University of Cambridge, Cambridge CB2 1QR, UK;
                                          njs76@mrc-tox.cam.ac.uk (N.S.L.); yzy21@cam.ac.uk (Y.Y.); yc487@cam.ac.uk (Y.C.);
                                          gf334@mrc-tox.cam.ac.uk (G.F.)
                                          * Correspondence: martins.lmiguel@gmail.com
                                          † These authors contributed equally to this work.

                                          Abstract: Ibuprofen is a common over-the-counter drug taken for pain relief. However, recent studies
                                          have raised concerns about its potential toxic effect with coronavirus disease 2019 (COVID-19), which
                                          is caused by severe acute respiratory syndrome coronavirus 2 (SARS-CoV-2). It has been proposed
                                          that ibuprofen may increase levels of angiotensin-converting enzyme 2 (ACE2), the human receptor
                                          for SARS-CoV-2 infection. Therefore, paracetamol is suggested as an alternative to ibuprofen for
                                          treating COVID-19 symptoms. Nevertheless, the relationship between intake of paracetamol or
                                          ibuprofen and either susceptibility to infection by SARS-CoV-2 or modulation of cellular ACE2 levels
                                          remains unclear. In this study, we combined data from human medical records and cells in culture

                                   to explore the role of the intake of these drugs in COVID-19. Although ibuprofen did not influence
Citation: Leal, N.S.; Yu, Y.; Chen, Y.;
                                          COVID-19 infectivity or ACE2 levels, paracetamol intake was associated with a lower occurrence of
Fedele, G.; Martins, L.M. Paracetamol     COVID-19 in our cohort. We also found that paracetamol led to decreased ACE2 protein levels in
Is Associated with a Lower Risk of        cultured cells. Our work identifies a putative protective effect of paracetamol against SARS-CoV-
COVID-19 Infection and Decreased          2 infection. Future work should explore the molecular mechanisms underlying the relationship
ACE2 Protein Expression: A                between paracetamol and COVID-19.
Retrospective Analysis. COVID 2021,
1, 218–229. https://doi.org/10.3390/      Keywords: paracetamol; acetaminophen; ibuprofen; ACE2; COVID-19; SARS-CoV-2; UK Biobank
covid1010018

Academic Editor:
Konstantinos Poulas                       1. Introduction
                                               Due to their analgesic and antipyretic properties, ibuprofen [(2RS)-1[4-(2-methyl
Received: 7 July 2021
Accepted: 10 August 2021
                                          propyl) phenyl] propionic acid (BP. 2004)] and paracetamol (also known as acetaminophen
Published: 16 August 2021
                                          or N-acetyl-para-aminophenol) are the most frequently used over-the-counter drugs to
                                          relieve pain [1–3]. However, these drugs show different adverse effects. Ibuprofen has
Publisher’s Note: MDPI stays neutral
                                          been shown to affect the gastrointestinal and cardiac systems while paracetamol is often
with regard to jurisdictional claims in
                                          used as an alternative for patients with issues in these systems [3]. Accordingly, these
published maps and institutional affil-   drugs are being used in treatment for coronavirus disease 2019 (COVID-19), a disease
iations.                                  caused by severe acute respiratory syndrome coronavirus 2 (SARS-CoV-2). The virus
                                          can be transmitted via several routes, including respiratory droplets, direct contact with
                                          contaminated surfaces, and faecal–oral transmission [4]. The molecular mechanisms that
                                          allow the entry of SARS-CoV-2 into human cells include binding of the viral spike (S)
Copyright: © 2021 by the authors.
                                          protein to the human receptor angiotensin-converting enzyme 2 (ACE2) and S cleavage
Licensee MDPI, Basel, Switzerland.
                                          by the host transmembrane protease serine 2 (TMPRSS2) [4,5]. ACE2, together with its
This article is an open access article
                                          homologue ACE, regulates the renin–angiotensin–aldosterone system, which is involved
distributed under the terms and           in regulating blood pressure and electrolyte homeostasis. Angiotensinogen is produced
conditions of the Creative Commons        in the liver and cleaved by renin, forming angiotensin I (Ang I). Ang I is then converted
Attribution (CC BY) license (https://     to angiotensin II (Ang II) by ACE, and ACE2 cleaves Ang II to angiotensin (1–7). Ang II
creativecommons.org/licenses/by/          has vasoconstrictive, pro-inflammatory, and pro-oxidative effects, whereas angiotensin
4.0/).                                    1–7 elicit vasodilating, anti-inflammatory, and antioxidant responses [6,7].

COVID 2021, 1, 218–229. https://doi.org/10.3390/covid1010018                                                https://www.mdpi.com/journal/covid
COVID 2021, 1 219
Circa March 2020, French authorities reported the possibility of negative effects of
ibuprofen in COVID-19 patients through the modulation of ACE2 levels [8–10]. The con-
cern was based on findings that patients with hypertension and diabetes mellitus were
at an increased risk of COVID-19, possibly due to treatment with ACE inhibitors and
angiotensin II type I receptor blockers, which leads to increased levels of ACE2 [11]. Addi-
tionally, ibuprofen reportedly increased ACE2 levels in a rat model of type 1 diabetes [9,12].
Therefore, paracetamol has been suggested as an alternative to ibuprofen for treating pain
and high temperature in patients with COVID-19 [8,10].
Although a few studies have shown that ibuprofen intake does not worsen the clinical
outcome of COVID-19 [13], it remains unknown whether ibuprofen and paracetamol
influence SARS-CoV-2 infectivity. Moreover, despite ibuprofen-induced increases in ACE2
in rats [12], no human study has assessed whether ibuprofen or paracetamol affects levels
of ACE2. The aims of this study are, first, to assess if ibuprofen or paracetamol affect
SARS-CoV-2 infectivity, and second, to determine if they modulate ACE2 levels. Using
an analysis of half a million individuals that are part of the UK Biobank cohort, we show
that those recorded as taking paracetamol, but not ibuprofen, had a lower risk of testing
positive for SARS-CoV-2. We also found that treating human Caco-2 cells with paracetamol
decreased ACE2 protein levels.
2. Materials and Methods
2.1. UK Biobank Data Sources
The UK Biobank contains health data from over 500,000 community volunteers based
in England, Scotland, and Wales. Information about the geographical regions, recruitment,
and other characteristics has been previously reported [14]. Briefly, between 2006 and
2010, adults aged between 40 and 69 years were invited to participate, and extensive
demographic, lifestyle, clinical, and radiological information was collected. Baseline
assessments included a comprehensive series of questionnaires, face-to-face interviews,
physical examinations, and blood sampling, with links to electronic medical records.
Clinical data for dementia and other comorbidities were cross validated by an algorithm
from the UK Biobank, which considered UK Biobank baseline assessment data (verbal
interview), linked hospital admissions data, and death register data.
Data regarding medications are recorded as indicated in Resource 100235 of the UK
Biobank. In brief, by using a touchscreen questionnaire under the guidance of a UK Biobank
interviewer, the participants reported whether they regularly took any over-the-counter
or prescription medications. As regularity was defined as more frequently than every
3 months, short-term medication was excluded. We did not include information on the
dosage of each medication since these data were not available.
The method of linking COVID-19 results to UK Biobank participants has been pre-
viously published [15]. Briefly, Public Health England’s Second-Generation Surveillance
System is a centralised microbiology database covering English clinical diagnostics labora-
tories that provides national surveillance of legally notifiable infections, bacterial isolations,
and antimicrobial resistance. Public Health England issues a regular feed of COVID-19 test
results to the UK Biobank using a secure dynamic linkage algorithm.
Ethical approval from the UK Biobank was granted from the North West Multi-
Centre Research Ethics Committee. The current analysis was approved under UK Biobank
application #60124. A detailed list of variables evaluated in the present study is presented
in Table S1. We defined high blood pressure using the criterion of diastolic blood pressure
≥90 mmHg or systolic blood pressure ≥140 mmHg. Individual-level data were collected
from the UK Biobank on 5 February 2021.
2.2. Cell Culture and Drug Treatments
A549 cells were grown in Dulbecco’s modified Eagle medium (DMEM; Thermo Fisher
Scientific, Waltham, MA, USA, 41966) supplemented with 10% foetal bovine serum (FBS;
Merck, Kenilworth, NJ, USA, F9665); Calu-3 cells were grown in DMEM/F-12 mediumCOVID 2021, 1 220
(Thermo Fisher Scientific, Waltham, MA, USA, 11330-032) supplemented with 15% FBS and
Caco-2 cells in RPMI 1640 medium (Thermo Fisher Scientific, Waltham, MA, USA, A10491-
01) supplemented with 20% FBS. All cell media were supplemented with 1% penicillin and
streptomycin (Thermo Fisher Scientific, Waltham, MA, USA, 15070063). The cells were split,
and the media renewed every 2–3 days. The cells were seeded in 6-well plates at a density
of 175,000 (A549 and Caco-2) or 400,000 (Calu-3) cells per well for 24 h and then treated or
lysed. Caco-2 cells were treated with paracetamol (Merck, Kenilworth, NJ, USA, P0300000)
(0.1, 0.5, 1, 2.5, and 5 mM) or ibuprofen (Merck, Kenilworth, NJ, USA, I4883) (0.05 mM,
0.25 mM, 0.5 mM, 1 mM, and 2 mM) for 24 h. Dimethylsulfoxide (DMSO; 0.02%, Merck,
Kenilworth, NJ, USA, 276855) was added as a control for ibuprofen. Drugs were directly
added to the cell media. All cells tested negative for mycoplasma. Cell lines were obtained
from Professor Anne Willis’s group. A549 cells are derived from human epithelial lung
carcinoma cells, Caco-2 cells are derived from human epithelial colorectal adenocarcinoma
cells, and Calu-3 are derived from human epithelial lung adenocarcinoma cells. The Caco-2
cell line was validated by STR genotyping while the other cells were not validated. Drug
concentrations were chosen based on previously published articles reporting changes in
processes in different cell lines and, when possible, specifically in Caco-2 cells, as follows:
paracetamol [16–20] and ibuprofen [21–25].
2.3. Protein Extraction and Western Blotting
Protein extracts from cells treated as described were prepared by lysing cells in RIPA
digestion solution [150 mM NaCl (Fisher Chemical, Waltham, MA, USA, S/3161/53), 1%
Triton X-100 (BDH, Poole, UK, 306324N), 0.5% sodium deoxycholate (Sigma, St. Louis, MI,
USA, D5670), 0.1% SDS (Sigma, St. Louis, MI, USA, 05030), 50 mM Tris pH = 7.5 (Fisher
BioReagents, BP152-1)] with 1× proteinase inhibitors cOmplete Mini, EDTA-free (Roche,
Basel, Switzerland, 11836170001), and benzonase solution (50 mM Tris pH = 8.0, 4 mM
MgSO4 (Scientific Laboratory Supplies, Nottingham, UK, CHE2456) and 1× benzonase
(EMD Millipore, Burlington, MA, USA, 70664)). Protein concentration was measured
using a Pierce™ BCA Protein Assay Kit (Thermo Fisher Scientific, Waltham, MA, USA,
23227). All extracts were mixed with 4 × LDS loading buffer. For sodium dodecyl sulphate–
polyacrylamide gel electrophoresis (SDS-PAGE), equivalent amounts of proteins were re-
solved on a 4–12% Bis-Tris gel (Thermo Fisher Scientific, Waltham, MA, USA, NP0335BOX
and NP0336BOX). Proteins were then transferred to nitrocellulose membranes and the
membranes were blocked in Tris-buffered saline (TBS; 0.15 M NaCl and 10 mM Tris, pH
7.5) with Tween 20 (Sigma, St. Louis, MI, USA, P1379) (TBS-T) containing 5% (w/v) dried
non-fat skim milk (BD, 232100) for 1 h at room temperature and then probed with the pri-
mary antibody before being incubated with the appropriate IRDye-conjugated secondary
antibody donkey anti-mouse (LI-COR, Cambridge, UK, 926-32212, Lot: C91023-09) or don-
key anti-rabbit (LICOR, Cambridge, UK, 926-32213, Lot: C91112-09). Antibody complexes
were visualised using an Odyssey (LI-COR, Cambridge, UK,), and quantifications were
performed using Image Studio Lite version 5.2.5 (LI-COR, Cambridge, UK,), with normali-
sation to the respective loading control (tubulin). Mouse monoclonal anti-α-tubulin (Merck,
Kenilworth, NJ, USA, T6074, RRDI: AB_477582, clone number: B-5-1-2, lot: 034M4837)
and rabbit monoclonal anti-ACE2 (Abcam, ab108252, RRDI: AB_10864415, clone number:
EPR4435(2), lot: GR3344245-2) antibodies were used. Both primary antibodies were used
at 1:1000 dilution and secondary antibodies at 1:20,000 dilution. Antibody validation can
be found on the companies’ websites as well as the references for these validations.
2.4. RNA Extraction and Quantitative Real-Time PCR
After 24 h of drug treatment, cells were washed 1× with phosphate-buffered saline
(PBS), trypsinised and centrifuged for 5 min at 500× g. The trypsin was removed, and
total RNA was extracted using TRIzol (Life Technologies, Carlsbad, CA, USA, 15596018)
and quantified by spectrophotometric analysis using a NanoDrop 2000 Spectrophotometer
(Thermo Fisher Scientific, Waltham, MA, USA,). Quantitative real-time PCR with reverseCOVID 2021, 1 221
transcription (qRT-PCR) was performed using a real-time 7500 Fast Real-Time PCR System
(Applied Biosystems, Waltham, MA, USA) with a SensiFAST SYBR Lo-ROX One-Step Kit
(Bioline, London, UK, BIO-74005). Fold change was calculated using the comparative
CT method [26]. For qRT-PCR, we measured the coefficient of variation (CV) of the
technical replicates and excluded from statistical analysis samples with a CV over 3%.
Gene-specific primers were obtained from Sigma, St. Louis, MI, USA: ACE2—forward,
50 -CGAAGCCGAAGACCTGTTCTA-30 and 50 -CAAGAGCAAACGGTTGAACAC-30 , and
reverse, 50 -GGGCAAGTGTGGACTGTTCC-30 and 50 -CCAGAGCCTCTCATTGTAGTCT-
30 [27]; GAPDH—forward, 50 -CTGACTTCAACAGCGACACC-30 , and reverse, 50 -TAGCCA
AATTCGTTGTCATACC-30 ). GAPDH was used as a housekeeping gene.
2.5. Statistical Analysis
For the UK Biobank analysis (Figure 1), we first employed an exploratory approach to
identify which putative comorbidities influence the risk of testing positive for SARS-CoV-2.
We obtained a list of 18 variables (Table S1) based on 3 publications that explored risk
factors influencing SARS-CoV-2 infection [28–30]. We then applied an iterative variable
selection procedure combining unsupervised stepwise forward and stepwise backward
regression analyses to select the most suitable predictor or combination of predictors in
our models based on the Akaike information criterion. We calculated the proportional
odds and their 95% confidence intervals based on the coefficients of the binomial models
to quantify the effects of paracetamol and ibuprofen intake on the risk of testing positive
for SARS-CoV-2 [31]. The UK Biobank analysis was performed in R version 4.0.0 [32]
and Python version 3.7 in Jupyter Notebook version 5.5 [33]. The analysis source code,
detailed quality checks, and all supplementary material are available on GitHub (https:
//github.com/M1gus/NSAIDs_Ace2) (Accessed on 12 August 2021).
For Figure 2, the Kruskal–Wallis test with correction using Dunn’s multiple compari-
son test was utilised to test for significance, as the data did not follow a normal distribution
based on the Shapiro–Wilk test. For samples treated with drugs (Figures 3 and 4), samples
were normalised to their respective control and found to be normally distributed based
on the Shapiro–Wilk test. We performed a one-sample t-test followed by a correction to
control for the false discovery rate (FDR) using the two-stage step-up method of Benjamin,
Krieger, and Yekutieli at a 5%. Analyses of the mRNA and protein levels were done in
GraphPad Prism 9.0 (GraphPad Software, San Diego, CA, USA). Statistical significance
was defined as a p value or corrected p value ≤ 0.05. ** p < 0.01, * p < 0.05.COVID 2021, 1 222
2021, 1, FOR PEER REVIEW 5
Figure 1. Paracetamol intake is associated with a lower risk of SARS-CoV-2 infection. (A) Workflow of the analysis.
Figure 1. Paracetamol intake is associated with a lower risk of SARS-CoV-2 infection. (A) Workflow
(B) Descriptive statistics
of the of the
analysis. (B) cohort analysed
Descriptive relative
statistics of to
thewhether SARS-CoV-2
cohort analysed infection
relative occurred.
to whether For continuous
SARS-CoV-2 in- variables
such as age,fection
the average age and
occurred. For standard deviation
continuous variablesaresuch
shown; for discrete
as age, variables
the average suchstandard
age and as sex, the corresponding
deviation are number
of UK Biobank participants
shown; andvariables
for discrete their percentage
such asrelative
sex, thetocorresponding
the total cohort are indicated.
number of UK Biobank participants
and their percentage relative to the total cohort are indicated.COVID 2021, 1, FOR PEER REVIEW 6
COVID
2021, 1, FOR PEER2021, 1
REVIEW 6 223
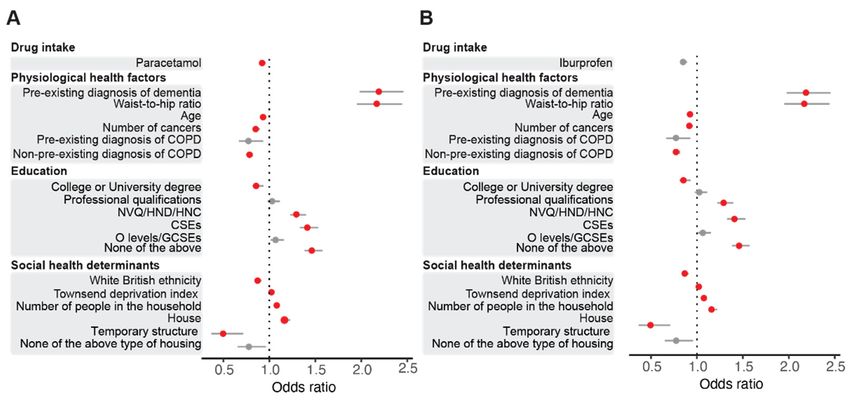
Figure 2. Paracetamol intake is associated with a lower risk of SARS-CoV-2 infection. (A) Relation-
Figure 2. Paracetamol intakeship
is associated
Figure 2. Paracetamol with a lowerwith
intake isparacetamol
between associated risk of
intake SARS-CoV-2
a lower
and risk of infection.
SARS-CoV-2 SARS-CoV-2 (A) infection.
infection. Relationship
The numeric(A)between
Relation-
values ofparacetamol
the odds ratios
intake and ship
SARS-CoV-2
betweeninfection.
paracetamol
are shownTheintake
numeric
in Table andvalues of the odds
SARS-CoV-2
S2. ratios
infection.
(B) Relationship are shown
The
between numeric
ibuprofen invalues
Table S2.
ofand
intake (B)SARS-CoV-2
the Relationship
odds between The
ratios infection.
are shown
ibuprofen intake in Table
and SARS-CoV-2 S2. infection.
numeric (B) Relationship
values ofThe between
thenumeric
odds ratios ibuprofen
values
are shown intake
of the odds and
ratios
in Table SARS-CoV-2
S3.are
Forshown infection.
in Table
both figures, The
S3.odds
the For both figures,
ratios calculated
numeric
the odds ratios valuesfrom
calculated of the
from odds regressions
logistic
logistic ratios are shown
regressions and
and intheir
theirTable S3. For95%
respective
respective both
95% figures, the
confidence
confidence odds ratios
intervals
intervals calculated
of
of the the relationship,
relationship, as well
as well
from
as covariates, arelogistic
providedregressions
as and are
in covariates,
Supplementary their respective
provided
Tables. 95% confidence
in Supplementary
Statistically intervals
Tables.
significant of ≤
the0.05)
relationship,
Statistically
(p value covariatesas
significant (p well
value
are shown≤ 0.05) covari-
in red
as covariates, areates
provided
are in Supplementary
shown in red and Tables. Statistically
non-significant (p value significant
> 0.05) (p valuein
covariates ≤ 0.05)
grey. covari-
and non-significant (p value > 0.05) covariates in grey.
ates are shown in red and non-significant (p value > 0.05) covariates in grey.
C o-2
3
u-
C 9
ac
4
al
C o-2
A5
3
u-
C 9
ac
4
al
A5
ACE2
102 kDa
ACE2 Tubulin
102 kDa 52 kDa
Tubulin 52 kDa
0.0190
800.0190
80
* *
(normalised to tubulin)
ACE2 band intensity
60
(normalised to tubulin)
ACE2 band intensity
60
40
40
0.5172
20 0.5172
20
0
0
A549 Caco-2 Calu-3
A549 Caco-2 Calu-3
Figure 3.
Figure Levels of
3. Levels of ACE2
ACE2 in in A549,
A549, Caco-2,
Caco-2, and and Calu-3
Calu-3 cell lines. Quantification
Quantification of of ACE2
ACE2 protein
protein
Figure 3. Levelslevels
of ACE2 in A549,
levelsnormalised
normalised to Caco-2,
to tubulin and
tubulin in Calu-3
in A549, cell
A549, Caco-2, lines.
Caco-2, and Quantification
and Calu-3
Calu-3 cell
cell lines. of ACE2 protein
lines. Descriptive
Descriptive statistics
statistics (mean
(mean and
and
levels normalised to tubulin
standard
standard in of
error
error A549,
ofthe Caco-2,
themean, and Calu-3
mean,s.e.m.)
s.e.m.)areare cell lines.
shown
shown theDescriptive
to to right
the of statistics
of the
right (mean
individual
the andfor each
values
individual values datadata
for each set.
standard error ofThree
the mean, s.e.m.) independent
are shown to samples
the rightwere
of theused
individual values for each dataisset.
set. Three biologically independent samples were used per cell line. Significance is shown withas-
biologically per cell line. Significance shown with an an
Three biologically independent
terisk andand samples were used
red;red;
non-significant per are
p values cellalso
line.shown
Significance
(the(the is shown withtest
Kruskal–Wallis an with
as- correction us-
asterisk non-significant p values are also shown Kruskal–Wallis test with correction
terisk and red; non-significant p values
ing Dunn’s multiple are also shown
comparison (thedata
test since Kruskal–Wallis
did not follow testnormal
with correction us-
distribution).
using
ing Dunn’s multiple Dunn’s multiple
comparison comparison
test since data did nottest follow
since data did not
normal follow normal distribution).
distribution).COVID 2021, 1, FOR PEER REVIEW 7
COVID 2021, 1 224
A
ACE2
6
Fold change
4
0.9043 1
2 0.0827 0.5413
0.0827
0
Paracetamol (mM) 0 0.1 0.5 1 2.5 5
B
6 0.6258
4 0.6258
Fold change
0.6258 0.6258
0.6258
2
0
Ibuprofen (mM) 0 0.05 0.25 0.5 1 2
Figure 4. Paracetamol and ibuprofen do not influence ACE2 mRNA levels in Caco-2 cells. Quantifica-
Figure 4. ACE2
tion of Paracetamol
mRNAand ibuprofen
levels docells
in Caco-2 not after
influence ACE2with
treatment mRNA(A) levels in Caco-2
paracetamol cells.
or (B) Quantifi-for
ibuprofen
cation
24 h.of ACE2 mRNA
Descriptive levels(mean
statistics in Caco-2 cells after
and s.e.m.) treatment
are shown with
to the (A)ofparacetamol
right or (B)
the individual ibuprofen
values for each
fordata
24 h. Descriptive statistics (mean and s.e.m.) are shown to the right of the individual values
set. Four or five biologically independent samples were used per condition. Non-significant for
each data set. Four or five biologically independent samples were used per condition. Non-signifi-
corrected p values are shown (one-sample t-test with correction using the two-stage step-up method
cant corrected p values are shown (one-sample t-test with correction using the two-stage step-up
of Benjamin, Krieger, and Yekutieli for FDR correction at 5%).
method of Benjamin, Krieger, and Yekutieli for FDR correction at 5%).
3. Results
3. 3.1.
Results
Regular Paracetamol Intake Results in a Lower Risk of SARS-CoV-2 Infection in the UK
Biobank
3.1. RegularCohort
Paracetamol Intake Results in a Lower Risk of SARS-CoV-2 Infection in the UK
BiobankWe Cohort
used data from the UK Biobank cohort to explore the link between paracetamol and
ibuprofen
We used intake
data in SARS-CoV-2
from infection.
the UK Biobank Theto
cohort UK Biobank
explore theislink
a biomedical database and
between paracetamol
research resource containing health records for more than half a million
and ibuprofen intake in SARS-CoV-2 infection. The UK Biobank is a biomedical database UK individuals [34].
From 16 March 2020 to 1 February 2021, 60,446 of 502,505 UK Biobank
and research resource containing health records for more than half a million UK individ- participants were
tested
uals [34].for SARS-CoV-2
From 16 March(Figure
2020 to1A,B); of these,
1 February 14,877
2021, were
60,446 ofpositive.
502,505 UK To identify
Biobankthe factors
partici-
influencing
pants the risk
were tested forofSARS-CoV-2
SARS-CoV-2(Figure
infection, we applied
1A,B); of these,an14,877
iterative unsupervised
were positive. Tomachine
iden-
learning
tify method
the factors based onthe
influencing several variables
risk of identified
SARS-CoV-2 previously
infection, by us and
we applied others [28–30]
an iterative un-
(Table S1). We found that age, obesity (waist-to-hip ratio), sex, a
supervised machine learning method based on several variables identified previouslyprevious history of cancer,
by
usdiagnoses
and others of [28–30]
dementia and chronic
(Table S1). Weobstructive
found thatpulmonary
age, obesity disorder, ethnicity,
(waist-to-hip deprivation
ratio), sex, a
(Townsend
previous deprivation
history of cancer,index), education,
diagnoses the number
of dementia of people
and chronic in thepulmonary
obstructive household,dis- and
order, ethnicity, deprivation (Townsend deprivation index), education, the number ofall
house type had a significant association with a positive test. We therefore accounted for
these in
people significant variables
the household, andinhouse
all subsequent
type had amodels.
significant association with a positive test.
We next modelled whether previous
We therefore accounted for all these significant intake of paracetamol
variables modulates
in all subsequent the risk of
models.
testing positive for SARS-CoV-2 by using binomial regression and found that paracetamol
We next modelled whether previous intake of paracetamol modulates the risk of test-
led to a 6.63% reduction in the risk of infection (odds ratio, OR 0.93; 95% confidence interval
ing positive for SARS-CoV-2 by using binomial regression and found that paracetamol
(CI) 0.91 to 0.96, p value = 0.004) (Figure 2A and Table S2). We applied the same method
led to a 6.63% reduction in the risk of infection (odds ratio, OR 0.93; 95% confidence inter-
to assess whether ibuprofen also affects the risk of SARS-CoV-2 infection. Although we
val (CI) 0.91 to 0.96, p value = 0.004) (Figure 2A and Table S2). We applied the same method
found that previous intake of ibuprofen was associated with a 2.98% decrease in the risk of
to assess whether ibuprofen also affects the risk of SARS-CoV-2 infection. Although we
infection (Figure 2B and Table S3), this association was not significant (OR 0.97; 95% CI
found that previous intake of ibuprofen was associated with a 2.98% decrease in the risk
0.94 to 1.00, p value = 0.29). Taken together, paracetamol, but not ibuprofen, is associated
of infection (Figure 2B and Table S3), this association was not significant (OR 0.97; 95% CI
with a lower risk of SARS-CoV-2 infection.COVID 2021, 1 225
3.2. Paracetamol, but Not Ibuprofen, Decreases ACE2 Protein Levels
As SARS-CoV-2 uses ACE2 on the surface of human cells for infection [5], we examined
whether paracetamol alters the risk of infection by SARS-CoV-2 by modulating ACE2 levels.
Human Calu-3 and Caco-2 cell lines have been shown to be highly susceptible to infection
by SARS-CoV-2 pseudo-virus [5], though the levels of ACE2 in these cell lines have not
been reported. Thus, we began by analysing levels of ACE2 protein in these cells; the lung
adenocarcinoma cell line A549 was used as a control because it has been shown to be more
resistant to infection by SARS-CoV-2 pseudo-virus [5]. Overall, levels of ACE2 in Caco-2
(p value = 0.0190) and Calu-3 (p value = 0.5172, non-significant) cells were higher than
those in A549 cells (Figure 3). Therefore, we decided to use Caco-2 cells for our next set
of experiments.
Next, we treated Caco-2 cells with paracetamol (concentration range between 0.1 and
5 mM) or ibuprofen (concentration range between 0.05 and 2 mM) for 24 h and assessed
levels of ACE2 mRNA and protein by real-time qPCR and Western blotting, respectively.
While levels of ACE2 mRNA were not significantly changed in both paracetamol- and
ibuprofen-treated cells, there was a tendency for decrease in ACE2 mRNA upon treatment
with 0.1 and 2.5 mM of paracetamol (corrected p values for both concentrations = 0.08)
(Figure 4A and Table S4), whereas no differences were observed after treatment with
ibuprofen (Figure 4B and Table S4).
Similarly, protein levels of ACE2 were significantly decreased with 0.1 mM, 0.5 mM,
1 mM, and 2.5 mM of paracetamol treatment (Figure 5A and Table S5), with no signif-
COVID 2021, 1, FOR PEER REVIEW icant differences with 5 mM of paracetamol nor ibuprofen within 9 the tested range of
concentrations (Figure 5B, Table S5).
A
0.0976
5 0 0.1 0.5 1 2.5 [in mM]
5
ACE2
102 kDa
(normalised to tubulin)
4
ACE2 band intensity
Tubulin 52 kDa
3
2
1
** ** ** **
0
Paracetamol (mM) 0 0.1 0.5 1 2.5 5
B
5 0 0.05 0.25 0.5 1 2 [in mM]
ACE2
4 102 kDa
(normalised to tubulin)
ACE2 band intensity
Tubulin 52 kDa
3
1 0.5154
2
0.1208 0.5154 0.1208
1
0
Ibuprofen (mM) 0 0.05 0.25 0.5 1 2
Figure 5. Paracetamol decreases ACE2 protein levels in Caco-2 cells. Quantification of ACE2 protein
levels in Caco-2 cells after treatment with (A) paracetamol or (B) ibuprofen for 24 h. Descriptive
Figure 5. Paracetamol decreases ACE2 protein levels in Caco-2 cells. Quantification of ACE2 protein
statistics
levels (mean
in Caco-2 andtreatment
cells after s.e.m.)with
are (A)
shown to theorright
paracetamol of the for
(B) ibuprofen individual values for each data set. Four
24 h. Descriptive
statistics (mean and s.e.m.) are shown to the right of the individual
biologically independent samples were used per condition. Representative values for each data set. Four cropped immunoblots are
biologically independent samples were used per condition. Representative cropped immunoblots
shown
are shown andandthethe whole
whole immunoblots
immunoblots caninbeFigures
can be found found S1 in
andFigures S1 and
S2. Significance S2. Significance is shown with
is shown
with asterisksand
asterisks and red;
red; non-significant
non-significant corrected p valuespare
corrected also shown
values (one-sample
are also shownt-test with
(one-sample t-test with correction
correction using the two-stage step-up method of Benjamin, Krieger, and Yekutieli for FDR correc-
using
tion at 5%).the two-stage step-up method of Benjamin, Krieger, and Yekutieli for FDR correction at 5%).
4. Discussion
The effect of ibuprofen intake and SARS-CoV-2 infection remains unclear and con-
troversial [9,20,35–37]. Additionally, the association between paracetamol, another com-
monly used over-the-counter pain reliver, and COVID-19 has not been explored. In this
study, we combined data from human medical records and in vitro results to investigate
the relationship between ibuprofen, paracetamol, and SARS-CoV-2 infection as well as theCOVID 2021, 1 226
4. Discussion
The effect of ibuprofen intake and SARS-CoV-2 infection remains unclear and contro-
versial [9,20,35–37]. Additionally, the association between paracetamol, another commonly
used over-the-counter pain reliver, and COVID-19 has not been explored. In this study,
we combined data from human medical records and in vitro results to investigate the
relationship between ibuprofen, paracetamol, and SARS-CoV-2 infection as well as the
possible mechanism. We showed that although ibuprofen does not affect SARS-CoV-2
infection in our models, paracetamol is associated with a 6.63% reduction in infection risk.
Additionally, we found that the protein levels of ACE2 were decreased in human Caco-2
cells cultured with 0.1 mM, 0.5 mM, 1 mM, and 2.5 mM of paracetamol, while mRNA levels
were not significantly changed. Therefore, our data suggest that paracetamol could affect
ACE2 protein levels by mechanisms other than alterations in its translation (e.g., protein
degradation). Since SARS-CoV-2 enters human cells by binding to ACE2 [5], the decreased
levels of ACE2 caused by paracetamol may explain the lower risk of COVID-19 infectivity
observed in our model.
Overall, we observed significant variability in ACE2 mRNA levels in cells treated with
either paracetamol or ibuprofen (Figure 3). Furthermore, it is unclear why we detected
a non-significant decrease in levels of ACE2 in cells treated with 0.1 mM or 2.5 mM
paracetamol but not with other dosing regimens (0.5 mM, 1 mM, or 5 mM). In rat hearts,
levels of ACE2 mRNA exhibit circadian oscillation [38]. Hence, as we did not account for
daily rhythms as a factor in our analysis, it is possible that daily variations in levels of
ACE2 in Caco-2 cells account for the variability we observed.
A bulletin published by the UK Commission on Human Medicines and two other
studies found no clear evidence that acute use of ibuprofen increases the risk of developing
COVID-19 [8,13,39]. Similarly, we did not find evidence that ibuprofen intake alters the
risk of SARS-CoV-2 infection or ACE2 levels. Moreover, the data for the regular intake of
paracetamol or ibuprofen in UK Biobank participants pre-date the COVID-19 pandemic.
Our results suggest that regular uptake of any of these agents possibly modulates ACE2
levels, but experimental validation is required, particularly in animal models. Long-term
exposure to paracetamol has been reported to cause epigenetic changes in genes associated
with neural development [40], and it is thus important to determine whether the long-
term effects of paracetamol on ACE2 have an epigenetic component. Additionally, data
regarding the intake of paracetamol by participants during SARS-CoV-2 infection are not
available, precluding any conclusion regarding whether the protective effect of paracetamol
is due to its intake during viral infection. Although we did not explore the exact molecular
pathway by which paracetamol affects SARS-CoV-2 infection, there are several mechanisms
that could be behind this, including the ability of paracetamol to reduce the activity of
sirtuin 1 [41], a direct activator of ACE2 transcription [42]. Further studies are required to
elucidate the mechanisms by which paracetamol alters ACE2 levels.
Additionally, the epidemiological data set analysed in our study has several limitations.
Due to the retrospective nature of our methodology, case–control clinical studies are
required to elucidate the effect of paracetamol on COVID-19 pathology. Our cohort is
predominantly of white ethnicity, which limits the interpretability of our results for people
of other ethnicities. Due to limited information from the UK Biobank, we cannot explain
the reasons behind the regular uptake of paracetamol or ibuprofen in the participants
analysed in our study. Additionally, the duration and dosage of paracetamol or ibuprofen
are currently unavailable. COVID-19 deaths are connected with failure in the pulmonary
system, such as pneumonia and respiratory failure [43]. However, the Caco-2 cells used in
this study are derived from colorectal adenocarcinoma cells and the effect of paracetamol
or ibuprofen in ACE2 levels might be different in lung/alveolar cells. Finally, we cannot
exclude that the effect of these drugs on ACE2 levels may be altered during infection or in
a diseased individual.COVID 2021, 1 227
5. Conclusions
In this study, we showed that paracetamol is associated with a lower risk of COVID-19
infectivity and a decrease in ACE2 protein levels, while we found no association between
ibuprofen and COVID-19 infection.
Supplementary Materials: The following are available online at https://www.mdpi.com/article/
10.3390/covid1010018/s1, Table S1. Detailed descriptive statistics of the analysed cohort; Table S2:
Paracetamol intake is associated with a decreased risk of COVID-19 infection; Table S3: Ibuprofen
intake does not affect the risk of SARS-CoV-2 infection; Table S4. Individual p values and corrected
FDR-corrected p values of Figure 3; Table S5. Individual p values and FDR-corrected p values of
Figure 4.
Author Contributions: N.S.L., G.F. and L.M.M. conceived of the original idea. Y.Y. developed and
performed the computational modelling. N.S.L. carried out the experimental work with the help
of Y.C. and G.F. N.S.L., Y.Y. and L.M.M. wrote the manuscript with the support of Y.C. and G.F. All
authors provided critical feedback and approved the final version of the manuscript.
Funding: This study was funded by the UK Medical Research Council, intramural project MC_UU_
00025/3 (RG94521).
Institutional Review Board Statement: The study was conducted according to the guidelines of
the Declaration of Helsinki. UK Biobank ethical approval was granted from the North West Multi-
Centre Research Ethics Committee. The current analysis was approved under UK Biobank applica-
tion #60124.
Informed Consent Statement: Informed consent was obtained from all subjects involved in the
study by the UK Biobank.
Data Availability Statement: Access to the UK Biobank data can be applied for via the official UK
Biobank website (https://www.ukbiobank.ac.uk/) (Accessed on 5 February 2021). All other analyses
can be found in our GitHub repository (https://github.com/M1gus/NSAIDs_Ace2) (Accessed on
12 August 2021).
Acknowledgments: We would like to thank A. Willis, G. Garland, and R. Harvey for sharing
the cell lines. This study was funded by the UK Medical Research Council, intramural project
MC_UU_00025/3 (RG94521).
Conflicts of Interest: The authors declare no competing interests nor conflict of interest.
Abbreviations
AA arachidonic acid
ACE angiotensin-converting enzyme
ACE2 angiotensin-converting enzyme 2
Ang I angiotensin I
Ang II angiotensin II
CI confidence interval
COVID-19 coronavirus disease 2019
COX-1 cyclooxygenase-1
COX-2 cyclooxygenase-2
FBS foetal bovine serum
mRNA messenger RNA
NSAIDs non-steroid anti-inflammatory drugs
OR odds ratio
qRT-PCR quantitative real-time PCR with reverse transcription
S spike
SARS-CoV-2 severe acute respiratory syndrome coronavirus 2
s.e.m. standard error of the meanCOVID 2021, 1 228
References
1. Wilcox, C.M.; Cryer, B.; Triadafilopoulos, G. Patterns of Use and Public Perception of Over-the-Counter Pain Relievers: Focus on
Nonsteroidal Antiinflammatory Drugs. J. Rheumatol. 2005, 32, 2218–2224. [PubMed]
2. Bushra, R.; Aslam, N. An Overview of Clinical Pharmacology of Ibuprofen. Oman Med. J. 2010, 25, 155–1661. [CrossRef]
3. Jóźwiak-Bebenista, M.; Nowak, J.Z. Paracetamol: Mechanism of Action, Applications and Safety Concern. Acta Pol. Pharm. 2014,
71, 11–23.
4. Harrison, A.G.; Lin, T.; Wang, P. Mechanisms of SARS-CoV-2 Transmission and Pathogenesis. Trends Immunol. 2020, 41, 1100–1115.
[CrossRef]
5. Hoffmann, M.; Kleine-Weber, H.; Schroeder, S.; Krüger, N.; Herrler, T.; Erichsen, S.; Schiergens, T.S.; Herrler, G.; Wu, N.-H.;
Nitsche, A.; et al. SARS-CoV-2 Cell Entry Depends on ACE2 and TMPRSS2 and Is Blocked by a Clinically Proven Protease
Inhibitor. Cell 2020, 181, 271–280.e8. [CrossRef] [PubMed]
6. Bourgonje, A.R.; Abdulle, A.E.; Timens, W.; Hillebrands, J.-L.; Navis, G.J.; Gordijn, S.J.; Bolling, M.C.; Dijkstra, G.; Voors, A.A.;
Osterhaus, A.D.M.E.; et al. Angiotensin-Converting Enzyme 2 (ACE2), SARS-CoV-2 and the Pathophysiology of Coronavirus
Disease 2019 (COVID-19). J. Pathol. 2020, 251, 228–248. [CrossRef]
7. Sanchis-Gomar, F.; Lavie, C.J.; Perez-Quilis, C.; Henry, B.M.; Lippi, G. Angiotensin-Converting Enzyme 2 and Antihypertensives
(Angiotensin Receptor Blockers and Angiotensin-Converting Enzyme Inhibitors) in Coronavirus Disease 2019. Mayo Clin. Proc.
2020, 95, 1222–1230. [CrossRef] [PubMed]
8. Karcioglu, O.; Bas, B.; Hosseinzadeh, M.; Kolahforoush, A.; Simsik, I.; Yeniocak, S. Commission of Human Medicines More
Advice on the Use of Ibuprofen for COVID-19. Drug Ther. Bull. 2020, 58, 101. [CrossRef]
9. Moore, N.; Carleton, B.; Blin, P.; Bosco-Levy, P.; Droz, C. Does Ibuprofen Worsen COVID-19? Drug Saf. 2020, 43, 611–614.
[CrossRef]
10. Powis, S. Message for All Clinical Staff: Anti-Inflammatory Medications. Available online: https://www.cas.mhra.gov.uk/
ViewandAcknowledgment/ViewAlert.aspx?AlertID=103001 (accessed on 7 March 2021).
11. Fang, L.; Karakiulakis, G.; Roth, M. Are Patients with Hypertension and Diabetes Mellitus at Increased Risk for COVID-19
Infection? Lancet Respir. Med. 2020, 8, e21. [CrossRef]
12. Qiao, W.; Wang, C.; Chen, B.; Zhang, F.; Liu, Y.; Lu, Q.; Guo, H.; Yan, C.; Sun, H.; Hu, G.; et al. Ibuprofen Attenuates Cardiac
Fibrosis in Streptozotocin-Induced Diabetic Rats. Cardiology 2015, 131, 97–106. [CrossRef]
13. Rinott, E.; Kozer, E.; Shapira, Y.; Bar-Haim, A.; Youngster, I. Ibuprofen Use and Clinical Outcomes in COVID-19 Patients. Clin.
Microbiol. Infect. Publ. Eur. Soc. Clin. Microbiol. Infect. Dis. 2020, 26, 1259.e5–1259.e7. [CrossRef] [PubMed]
14. Sudlow, C.; Gallacher, J.; Allen, N.; Beral, V.; Burton, P.; Danesh, J.; Downey, P.; Elliott, P.; Green, J.; Landray, M.; et al. UK Biobank:
An Open Access Resource for Identifying the Causes of a Wide Range of Complex Diseases of Middle and Old Age. PLoS Med.
2015, 12, e1001779. [CrossRef]
15. Armstrong, J.; Rudkin, J.K.; Allen, N.; Crook, D.W.; Wilson, D.J.; Wyllie, D.H.; O’Connell, A.M. Dynamic Linkage of COVID-19
Test Results between Public Health England’s Second Generation Surveillance System and UK Biobank. Microb. Genom. 2020, 6,
mgen000397. [CrossRef] [PubMed]
16. Behrends, V.; Giskeødegård, G.F.; Bravo-Santano, N.; Letek, M.; Keun, H.C. Acetaminophen Cytotoxicity in HepG2 Cells Is
Associated with a Decoupling of Glycolysis from the TCA Cycle, Loss of NADPH Production, and Suppression of Anabolism.
Arch. Toxicol. 2019, 93, 341–353. [CrossRef] [PubMed]
17. Pierce, R.H.; Franklin, C.C.; Campbell, J.S.; Tonge, R.P.; Chen, W.; Fausto, N.; Nelson, S.D.; Bruschi, S.A. Cell Culture Model for
Acetaminophen-Induced Hepatocyte Death in Vivo. Biochem. Pharmacol. 2002, 64, 413–424. [CrossRef]
18. Prieto, P.; Hoffmann, S.; Tirelli, V.; Tancredi, F.; González, I.; Bermejo, M.; de Angelis, I. An Exploratory Study of Two Caco-2 Cell
Models for Oral Absorption: A Report on Their within-Laboratory and between-Laboratory Variability, and Their Predictive
Capacity. Altern. Lab. Anim. ATLA 2010, 38, 367–386. [CrossRef]
19. Siissalo, S.; Laine, L.; Tolonen, A.; Kaukonen, A.M.; Finel, M.; Hirvonen, J. Caco-2 Cell Monolayers as a Tool to Study Simultaneous
Phase II Metabolism and Metabolite Efflux of Indomethacin, Paracetamol and 1-Naphthol. Int. J. Pharm. 2010, 383, 24–29.
[CrossRef]
20. Vad, N.M.; Yount, G.; Moore, D.; Weidanz, J.; Moridani, M.Y. Biochemical Mechanism of Acetaminophen (APAP) Induced Toxicity
in Melanoma Cell Lines. J. Pharm. Sci. 2009, 98, 1409–1425. [CrossRef]
21. Bombardo, M.; Malagola, E.; Chen, R.; Rudnicka, A.; Graf, R.; Sonda, S. Ibuprofen and Diclofenac Treatments Reduce Proliferation
of Pancreatic Acinar Cells upon Inflammatory Injury and Mitogenic Stimulation. Br. J. Pharmacol. 2018, 175, 335–347. [CrossRef]
22. Hao, H.; Wang, G.; Sun, J.; Ding, Z.; Wu, X.; Roberts, M. Unidirectional Inversion of Ibuprofen in Caco-2 Cells: Developing a
Suitable Model for Presystemic Chiral Inversion Study. Biol. Pharm. Bull. 2005, 28, 682–687. [CrossRef] [PubMed]
23. Heikkinen, A.T.; Mönkkönen, J.; Korjamo, T. Kinetics of Cellular Retention during Caco-2 Permeation Experiments: Role of
Lysosomal Sequestration and Impact on Permeability Estimates. J. Pharmacol. Exp. Ther. 2009, 328, 882–892. [CrossRef] [PubMed]
24. Leidgens, V.; Seliger, C.; Jachnik, B.; Welz, T.; Leukel, P.; Vollmann-Zwerenz, A.; Bogdahn, U.; Kreutz, M.; Grauer, O.M.; Hau, P.
Ibuprofen and Diclofenac Restrict Migration and Proliferation of Human Glioma Cells by Distinct Molecular Mechanisms. PLoS
ONE 2015, 10, e0140613. [CrossRef]
25. Liao, C.-H.; Lin, L.-P.; Yu, T.-Y.; Hsu, C.-C.; Pang, J.-H.S.; Tsai, W.-C. Ibuprofen Inhibited Migration of Skeletal Muscle Cells in
Association with Downregulation of P130cas and CrkII Expressions. Skelet. Muscle 2019, 9, 23. [CrossRef] [PubMed]COVID 2021, 1 229
26. Schmittgen, T.D.; Livak, K.J. Analyzing Real-Time PCR Data by the Comparative C(T) Method. Nat. Protoc. 2008, 3, 1101–1108.
[CrossRef] [PubMed]
27. Smith, J.C.; Sausville, E.L.; Girish, V.; Yuan, M.L.; Vasudevan, A.; John, K.M.; Sheltzer, J.M. Cigarette Smoke Exposure and
Inflammatory Signaling Increase the Expression of the SARS-CoV-2 Receptor ACE2 in the Respiratory Tract. Dev. Cell 2020, 53,
514–529.e3. [CrossRef]
28. Travaglio, M.; Yu, Y.; Popovic, R.; Selley, L.; Leal, N.S.; Martins, L.M. Links between Air Pollution and COVID-19 in England.
Environ. Pollut. 2021, 268, 115859. [CrossRef]
29. Yu, Y.; Travaglio, M.; Popovic, R.; Leal, N.S.; Martins, L.M. Alzheimer’s and Parkinson’s Diseases Predict Different COVID-19
Outcomes: A UK Biobank Study. Geriatrics 2021, 6, 10. [CrossRef]
30. Williamson, E.J.; Walker, A.J.; Bhaskaran, K.; Bacon, S.; Bates, C.; Morton, C.E.; Curtis, H.J.; Mehrkar, A.; Evans, D.; Inglesby, P.;
et al. Factors Associated with COVID-19-Related Death Using OpenSAFELY. Nature 2020, 584, 430–436. [CrossRef]
31. Lumley, T.; Diehr, P.; Emerson, S.; Chen, L. The Importance of the Normality Assumption in Large Public Health Data Sets. Annu.
Rev. Public Health 2002, 23, 151–169. [CrossRef] [PubMed]
32. Team, R. Development Core A Language and Environment for Statistical Computing. R Found. Stat. Comput. 2018, 2. Available
online: https://www.R-project.org (accessed on 1 February 2021).
33. Kluyver, T.; Ragan-Kelley, B.; Pérez, F.; Granger, B.; Bussonnier, M.; Frederic, J.; Kelley, K.; Hamrick, J.; Grout, J.; Corlay, S.; et al.
Jupyter Notebooks—A Publishing Format for Reproducible Computational Workflows. In Proceedings of the Positioning and Power
in Academic Publishing: Players, Agents and Agendas—Proceedings of the 20th International Conference on Electronic Publishing; ELPUB:
Amsterdam, The Netherlands, 2016; pp. 87–90.
34. Bycroft, C.; Freeman, C.; Petkova, D.; Band, G.; Elliott, L.T.; Sharp, K.; Motyer, A.; Vukcevic, D.; Delaneau, O.; O’Connell, J.; et al.
The UK Biobank Resource with Deep Phenotyping and Genomic Data. Nature 2018, 562, 203–209. [CrossRef] [PubMed]
35. François, P.; Desrumaux, A.; Cans, C.; Pin, I.; Pavese, P.; Labarère, J. Prevalence and Risk Factors of Suppurative Complications in
Children with Pneumonia. Acta Paediatr. 2010, 99, 861–866. [CrossRef] [PubMed]
36. Krenke, K.; Krawiec, M.; Kraj, G.; Peradzynska, J.; Krauze, A.; Kulus, M. Risk Factors for Local Complications in Children with
Community-Acquired Pneumonia. Clin. Respir. J. 2018, 12, 253–261. [CrossRef]
37. Martins-Filho, P.R.; do Nascimento-Júnior, E.M.; Santos, V.S. No Current Evidence Supporting Risk of Using Ibuprofen in Patients
with COVID-19. Int. J. Clin. Pract. 2020, 74, e13576. [CrossRef]
38. Herichová, I.; Šoltésová, D.; Szántóová, K.; Mravec, B.; Neupauerová, D.; Veselá, A.; Zeman, M. Effect of Angiotensin II on
Rhythmic Per2 Expression in the Suprachiasmatic Nucleus and Heart and Daily Rhythm of Activity in Wistar Rats. Regul. Pept.
2013, 186, 49–56. [CrossRef] [PubMed]
39. Lund, L.C.; Kristensen, K.B.; Reilev, M.; Christensen, S.; Thomsen, R.W.; Christiansen, C.F.; Støvring, H.; Johansen, N.B.; Brun,
N.C.; Hallas, J.; et al. Adverse Outcomes and Mortality in Users of Non-Steroidal Anti-Inflammatory Drugs Who Tested Positive
for SARS-CoV-2: A Danish Nationwide Cohort Study. PLoS Med. 2020, 17, e1003308. [CrossRef] [PubMed]
40. Gervin, K.; Nordeng, H.; Ystrom, E.; Reichborn-Kjennerud, T.; Lyle, R. Long-Term Prenatal Exposure to Paracetamol Is Associated
with DNA Methylation Differences in Children Diagnosed with ADHD. Clin. Epigenetics 2017, 9, 1–9. [CrossRef]
41. Wojnarová, L.; Kutinová Canová, N.; Farghali, H.; Kučera, T. Sirtuin 1 Modulation in Rat Model of Acetaminophen-Induced
Hepatotoxicity. Physiol. Res. 2015, 64, S477–S487. [CrossRef]
42. Clarke, N.E.; Belyaev, N.D.; Lambert, D.W.; Turner, A.J. Epigenetic Regulation of Angiotensin-Converting Enzyme 2 (ACE2) by
SIRT1 under Conditions of Cell Energy Stress. Clin. Sci. 2014, 126, 507–516. [CrossRef]
43. Grippo, F.; Navarra, S.; Orsi, C.; Manno, V.; Grande, E.; Crialesi, R.; Frova, L.; Marchetti, S.; Pappagallo, M.; Simeoni, S.; et al. The
Role of COVID-19 in the Death of SARS-CoV-2–Positive Patients: A Study Based on Death Certificates. J. Clin. Med. 2020, 9, 3459.
[CrossRef] [PubMed]You can also read