Partial Replacement of Maltodextrin by Sweet Potato Flour (Ipomoea Batatas L. Lamarck) in the Development of a Shake Beverage - MDPI
←
→
Page content transcription
If your browser does not render page correctly, please read the page content below
beverages
Article
Partial Replacement of Maltodextrin by Sweet Potato
Flour (Ipomoea Batatas L. Lamarck) in the
Development of a Shake Beverage
Gisele Kirchbaner Contini 1, * , Fabielli Priscila de Oliveira 1 , Alana Martins 2
and Katielle Rosalva Voncik Córdova 1
 1   Departament of Food Engineering, State University of Central-West, R. Simeão Varela de Sá, 03 Vila Carli,
     Guarapuava-PR 85040-080, Brazil; fabiellioliveira@hotmail.com (F.P.d.O.);
     kvcordova@hotmail.com (K.R.V.C.)
 2   Department of Food Engineering, State University of Ponta Grossa, Av. Bonifácio Viléla, Centro,
     Ponta Grossa 84010-330, Brazil; ala.nnamartiins@gmail.com
 *   Correspondence: giselekirchbaner@hotmail.com; Tel.: +55-041-99188-6606

 Received: 19 December 2018; Accepted: 12 February 2019; Published: 1 March 2019

 Abstract: Sweet potato flour contains low-glycemic complex carbohydrates and, when it is ingested,
 prevents insulin spikes and prolongs the feeling of satiety. The aim of this study was to elaborate
 and to verify the acceptability of the shake with the total or partial substitution of maltodextrin for
 sweet potato flour. To elaborate the shake beverage, we used a 22 factorial design, with three central
 points, thus generating seven formulations. For the taste, color, texture, appearance, acceptance
 and attitude of purchase properties, sensory tests were conducted using a nine-point hedonic
 scale and panelists (n = 50). The highest acceptability formulations, formulations 3 (10% sweet
 potato flour; 25% maltodextrin) and 7 (0% sweet potato flour; 25% maltodextrin), were submitted
 to pH, moisture, ash, protein, lipid, crude fiber and total carbohydrate analyses. The statistical
 difference between the formulations from the T test (p < 0.05) was verified for the moisture, ash
 and lipid parameters. Formulation 3 presented higher values of moisture (93.26 ± 0.57) and lipids
 (1.91 ± 0.01), and formulation 7 had higher values of ash (0.39 ± 0.01). The results of the sensorial
 and physicochemical analyses of the shake indicate that sweet potato flour shows potential for the
 elaboration of this drink.

 Keywords: carbohydrates; sensory evaluation; shake beverage; factorial design approach; hedonic
 scale; low-glycemic

1. Introduction
      Sweet potato (Ipomoea batatas L. Lamarck) is the main tuber root cultivated in Brazil due to high
tolerance to drought and offers a wide adaptation to the climate and land [1]. According to the Food
and Agriculture Organization (FAO) statistics, the world’s production of sweet potatoes in 2016 was
concentrated in Asia and Africa [2]. It is considered one of the main sources of food, animal feed and
raw material for the industry. In the development of food, sweet potato is widely used in the extraction
of starch but is little explored in beverage preparations [3].
      This tuberous root is rich in starch and other nutrients [4]. Sweet potato has a composition of high
value to the human diet, which is important in meeting human nutritional needs such as carbohydrates,
fibers, potassium, vitamins A and C and high-quality protein. Sweet potato is consumed in different
ways; it is boiled, baked, fried or mashed. It can also be used for the preparation of breads and starch
in the industry [5,6].

Beverages 2019, 5, 18; doi:10.3390/beverages5010018                           www.mdpi.com/journal/beverages
Beverages 2019, 5, 18 2 of 8
Some studies have been carried out to further the development of carbohydrate solutions for
athletes, with a view to improving performance during long-term physical activities besides an increase
in glycemic levels [7–10]. One of the energetic supplements used in this field is maltodextrin, which is
a saccharide-based polymer containing D-glucose units linked by glycoside bonds, which is an easily
absorbed carbohydrate that is obtained from the partial hydrolysis of starch. It is beneficial to athletes,
for example, when running, playing soccer or tennis, as it provides energy during training [11,12].
In conformity with the benefits mentioned above, energy drinks are also marketed as an option for
people who are not athletes but are looking for a way to decrease tiredness and boost energy, enabling
weight loss and enhancing mental alertness [13].
Sports drinks can be ingested before, during and after exercise. When ingested before
exercise, they can prevent or even delay homeostatic disorders that can accompany physical
activities [14]. In addition, pre-exercise consumption can improve the circulation of blood glucose
concentrations through the supply of carbohydrates. When sports drinks are consumed during exercise,
the carbohydrates can improve performance, as demonstrated by Carter et al. [15].
The consumption of carbohydrate and protein supplements is recommended by the Brazilian
Society of Sports Medicine, aiming to favor a maximum resynthesis of muscular and hepatic
glycogen [16]. Ballistreri et al. [17] performed a study to establish the drinking pattern of energy
drinks among physical education students from an institution in Argentina. Most of these drinks
contain ingredients such as taurine, caffeine and vitamins. Considering that the potential risks of
energy drink consumption can be increased when consuming them concomitantly with, for example,
alcohol, the results denote the importance of reducing consumption among young people and also
reinforce the importance of adequate eating to achieve good performance in any physical activity.
It is due to these concerns that the shake beverage is presented as an alternative product. It is
easy-to-prepare and also aids in gym training by providing energy. It is also a natural food source
and a natural product, thus lowering the chances of causing complications in consumers. To further
increase the applicability of sweet potato as a major source of carbohydrates, in this study, we tested
sweet potato flour as a partial replacement for maltodextrin in a shake beverage.
2. Methodology
2.1. Sweet Potato and Sweet Potato Flour
Sweet potatoes (Ipomoea batatas L. Lamarck) were kindly provided by the Department of
Agronomy, State University of the Center-West (Parana, Brazil)-CEDETEG Campus (Parana, Brazil).
The tubers were selected, washed, weighted and grated. Thereafter, the samples were dried in
a drying oven at 65 ◦ C for 24 h. After drying, the samples were crushed and processed to obtain sweet
potato flour [18].
2.2. Preparation of Shake Beverage
The shake beverage was elaborated and one batch was made from a formulation that uses
maltodextrin as a basis for the determination of the percentages of the other ingredients in the shake
(Table 1). The original shake beverage formulation was modified by the addition of sweet potato flour
at different concentrations according to a 22 factorial design with three central points, thus generating
7 formulations (Table 1).
The other ingredients used in the shake beverage formulation were, as fixed parts, xanthan gum
Aminna® (2.50%), refined sugar União® (35.00%), grape flavoring hydroalcoholic artificial aroma Duas
Rodas® (0.05%), purple artificial liquid dye Duas Rodas® (0.10%), whole milk integral powder Sancor®
(21.00%); and as variable parts: sweet potato flour (10.00 and 20.00%) and grape flavor commercial
maltodextrin Body Action® (5.00 and 25.00%). The ingredients in maltodextrin are maltodextrin, citric
acid (acidulant), tricalcium phosphate (acidity regulator), caramel dye, sucralose (sweetener), bordeaux
dye and indigotine blue dye.Beverages 2019, 5, 18 3 of 8
Table 1. The 22 factorial design, with three central points, for the addition of sweet potato flour in the
formulation development.
Variables
Formulations Sweet Potato Flour Maltodextrin
1 +1 (20%) -1 (5%)
2 +1 (20%) +1 (25%)
3 -1 (10%) +1 (25%)
4 -1 (10%) -1 (5%)
5 (C) 1 0 (15%) 0 (15%)
6 (C) 1 0 (15%) 0 (15%)
7 (C) 1 0 (15%) 0 (15%)
(C) 1 represents the central point.
2.3. Proximate Composition of Sweet Potato Flour
The protein (Kjedahl, N × 6.25 for flour), ash (gravimetric), lipid and fiber brut contents of sweet
potato flour were determined using AOAC 2005 methods [19]. The total carbohydrate content was
calculated as the difference between the initial mass of the sample (100 g) and the total mass of the
proteins, lipids, fixed mineral residues and fibers.
2.4. Physicochemical Analysis
All analyses were performed for sweet potato flour and the shake beverage. The moisture content
analysis was performed through the adaptation of the method in [20], by drying the samples in
a conventional oven at 105 ◦ C for 8 h. The pH was evaluated by direct measurements through
a potentiometer (bench thermometer for aqueous solutions Mpa-210, Tecnopon) of the samples
prepared in a solution at a 1:10 (w/v) ratio with distilled water before using the potentiometer.
The colorimetric analysis [21] was performed only for the shake drink, using CIELAB color system
L* a* b* and colorimeter (Konic Minolta CR-400) with illuminant C and a 10◦ angle that was previously
calibrated. The parameters analyzed in triplicate were: L* (lightness) where L* = 0 means black and
L* = 100 means white, for a* and b* (set as chromaticity) where +a* means red and −a* means green;
−b* means blue and +b* means yellow [22].
The particle size of the flour was determined with a system consisting of five sieves. The mesh
opening diameters of the sieves were: 10 (nominal aperture of 2.00 mm), 12 (nominal aperture of
1.68 mm), 14 (nominal aperture of 1.41 mm), 35 (nominal aperture of 0.500 mm) and 48 (nominal
aperture of 0.300 mm).
2.5. Sensory Evaluation
This part of the study was approved by the Ethics Committee in Research of the State University
of the Center-West (Parana, Brazil) under the project identification code no. 81426725. The sensory
analysis was performed by 50 panelists, comprising students from the CEDETEG Campus of the State
University of the Center-West. Two methods were chosen for the sensory evaluation of the formulations.
The acceptance test [23] was conducted to assess whether the panelists liked the appearance, flavor,
color and texture of the shake beverage, applying the 9-point hedonic scale categorized as 9 “like
extremely”; 8 “liked”; 7 “liked moderately”; 6 “liked slightly”; 5 “neither liked nor disliked”; 4 “dislike
somewhat”; 3 “dislike moderately”; 2 “dislike very much”; and 1 “dislike extremely” to express
their overall impression. The formulations that obtained higher acceptance levels were submitted to
physicochemical analysis. The purchase intent test was measured using a five-point structured scale
(from 1 = definitely would not buy to 5 = definitely would buy) adapted from [24,25].
The samples were prepared with 10 g of shake powder added to 100 mL of cold water at 6 ◦ C.
Each panelist received seven samples of approximately 50 mL of the shake beverage presented inBeverages 2019, 5, 18 4 of 8
plastic cups which were previously coded with three-digit random numbers. The panelists evaluated
the samples from left to right and cleansed their palate with water between samples.
2.6. Statistical Analysis
Results are expressed as mean and standard error of the mean. Differences between
formulations were analyzed using ANOVA, followed by the Tukey test or Student test, with p < 0.05
considered significant. All analyses were performed using the Assistat Software version 7.7 beta
(DEAG-CTRN-UFCG, Pernambuco, Brazil) [26].
3. Results and Discussion
3.1. Proximate Composition
3.1.1. Shake Formulation
Formulations 3 and 7 were deemed the most acceptable formulations by the panelists. Thus,
physicochemical analyses were only performed for these formulations (Table 2).
Between formulations 3 and 7, the results of moisture, ash and lipid parameters showed no
statistical differences. However, formulation 3 presented higher values of moisture and lipids
compared with formulation 7. On the other hand, ash content presented higher values in formulation 7
than in formulation 3. It was not possible to find values for the physicochemical analyses of the shake
beverage formulations using sweet potato in any forms for comparison. To date, no shake beverages
based on sweet potato flour were found.
Table 2. pH, moisture, ash, protein, lipid, fiber and total carbohydrate values for the shake beverage
produced with sweet potato flour.
Formulation pH Moisture Ash Protein Lipid Fiber Carbohydrats
3 7.34 ± 93.26 ± 0.35 ± 0.17 ± 1.91 ± 0.23 ± 97.34 ±
0.01a 0.57a 0.01b 0.01a 0.01a 0.04a 0.75a
7 7.32 ± 91.80 ± 0.39 ± 0.17 ± 1.70 ± 0.27 ± 97.47 ±
0.01a 0.04b 0.01a 0.01a 0.03b 0.09a 0.11a
Data represent mean values for each formulation mean and standard error of the mean. Means followed by different
lowercase letters in the same column show statistical difference between formulations (p < 0.05). The results are
presented in % (w/v) with the exception of pH.
3.1.2. Sensory Evaluation
The development of the shake beverage with the partial or total replacement of maltodextrin
showed statistical differences in the sensory evaluation of all analyzed items. The panelists did not
like the formulations in which the concentration of sweet potato flour was 25%. The best scores were
obtained for the formulation containing 10% sweet potato flour (Table 3).
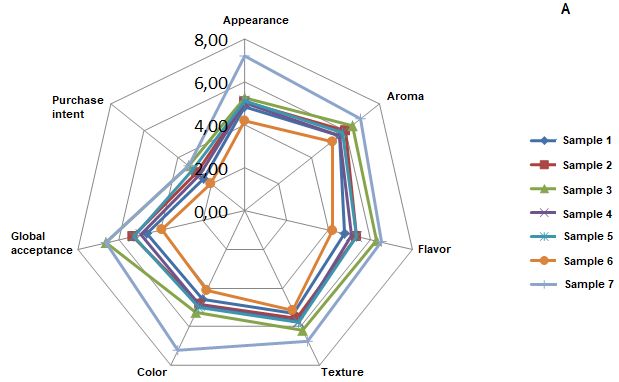
The highest values for sensory acceptance were found for formulations 3 and 7, based on the
appearance, overall acceptance and shake texture (Figure 1A). Regarding the intention of purchase
test, there were higher values in the intention to buy for formulations 3 and 7 (Figure 1B), where
formulation 3 contains 10% sweet potato flour and formulation 7 contains 15% maltodextrin. These
results show the possibility of developing this product with good acceptance values.Beverages 2019, 5, 18 5 of 8
Table 3. Results per sensory attribute of the shake beverage with the partial replacement of maltodextrin
with sweet potato flour.
Overall Purchase
Formulations Appearance Aroma Flavor Texture Color
Acceptance Intent
1 4.84 ± 5.64 ± 4.74 ± 5.28 ± 4.56 ± 4.70 ± 2.44 ±
1.76bc 1.52bc 1.98cd 1.96b 1.97bc 1.75d 1.11bc
Beverages22019, 5, x FOR PEER
5.06REVIEW
± 5.98 ± 5.32 ± 5.56 ± 4.84 ± 5.36 ± 2.865 ±
of 8
1.77bc 1.58abc 2.00bc 1.75b 1.81bc 1.84 c 1.15ab
1.77bc 1.58abc 2.00bc 1.75b 1.81bc 1.84 c 1.15ab
3 5.26 ± 6.38 ± 6.28 ± 6.18 ± 5.24 ± 6.62 ± 3.36 ±
3 5.26 ± 6.38 ± 6.28 ± 6.18 ± 5.24 ± 6.62 ± 3.36 ±
1.90 b 1.38ab 1.69ab 1.57ab 1.96b 1.51ab 1.03a
1.90 b 1.38ab 1.69ab 1.57ab 1.96b 1.51ab 1.03a
4 4 5.04 ±
5.04 ± ± ±
5.625.62 5.10±
5.10 ± 5.74± ±
5.74 ± ±
4.904.90 5.64 ±5.64 ± 2.72 ± 2.72 ±
1.72bc
1.72bc 1.58bc
1.58bc 1.75cd
1.75cd 1.72ab
1.72ab 1.95bc
1.95bc 1.46bc1.46bc 1.22abc1.22abc
5 5 5.14 ±
5.14 ± 5.845.84
± ± 5.32±
5.32 ± 5.76
5.76± ± 4.984.98
± ± 5.30 ±5.30 ± 3.08 ± 3.08 ±
1.81bc
1.81bc 1.59bc
1.59bc 1.89bc
1.89bc 1.66ab
1.66ab 1.93bc
1.93bc 1.81c 1.81c 1.10ab 1.10ab
6 4.22 ± 5.20 ± 4.18 ± 5.16 ± 4.12 ± 3.98 ± 2.04 ±
6 4.22 ± 5.20 ± 4.18 ± 5.16 ± 4.12 ± 3.98 ± 2.04 ±
1.84c 1.68c 1.83d 2.07b 2.20c 1.80d 1.07c
1.84c 1.68c 1.83d 2.07b 2.20c 1.80d 1.07c
7 7.20 ± 6.86 ± 6.52 ± 6.76 ± 7.20 ± 6.66 ± 3.34 ±
7 7.20 ±1.03a ±
6.861.38a 6.52 ±
1.59a 6.76 ±
1.30a 7.20 ±
1.20a 1.62a6.66 ± 1.65a 3.34 ±
Data represent mean values for each formulation mean1.30a
1.03a 1.38a 1.59a 1.20aerror of 1.62a
and standard 1.65a
the mean. Means
followed
Data representby
meandifferent lowercase
values for letters inmean
each formulation the and
same column
standard show
error of thestatistical
mean. Meansdifference between
followed by different
lowercase letters in the same
formulations (p < 0.05). column show statistical difference between formulations (p < 0.05).
Figure 1. Sensory profile analysis of the shake beverage formulation tested. (A) Histogram sensory
Figure 1. Sensory profile analysis of the shake beverage formulation tested. (A) Histogram sensory
evaluation-purchase intent test (B).
evaluation-purchase intent test (B).
3.1.3. Sweet Potato Flour
In Table 4, we present the results of the proximate composition for sweet potato flour. Bezerra
et al. [18] elaborated cereal bars with added sweet potato flour. In the pH, moisture, lipid and
reducing sugars content analyses, they found 6.07, 8.87, 9.18 and 71.17%, respectively. WhenBeverages 2019, 5, 18 6 of 8
3.1.3. Sweet Potato Flour
In Table 4, we present the results of the proximate composition for sweet potato flour.
Bezerra et al. [18] elaborated cereal bars with added sweet potato flour. In the pH, moisture, lipid
and reducing sugars content analyses, they found 6.07, 8.87, 9.18 and 71.17%, respectively. When
comparing those values with the result obtained in this study, there are similarities except for the
moisture content, which shows a great difference that can be justified by the botanical origin of the
sweet dressing and physical conditions of the raw material.
Table 4. Sweet potato flour proximate composition.
pH Moisture Ash Protein Lipids Fiber Carbohydrates
7.13 ± 0.01 7.13 ± 0.01 1.67 ± 0.03 9.42 ± 0.33 8.21 ± 0.01 2.33 ± 0.11 65.90 ± 0.01
Data represent mean values mean and standard error of the mean. The results are presented in % (w/v) with the
exception of pH.
Van Hal [27] presented an overview of the information on the processing and storage of sweet
potatoes from different sources. In that study, for moisture content, the values were between 4.3
and 13.2%. The results obtained in this study fall within this range. Of the protein content values
related in Van Hal’s study, the closest value to those obtained in this study is 8.5%. Regarding the total
carbohydrate content, the maximum value reported in [27] was 94.1%, whereas we report 65.9%.
3.1.4. Physicochemical Analysis
The parameters of the colorimetric analysis for the shake beverage were L* = 3994 ± 0.06,
a* = −1.92 ± 0.02a and b* = 1.80 ± 0.0a for formulation 3, and L* = 44.65 ± 0.09a, a* = −0.83 ± 0.b
and b* = 1.74 ± 0.02a for formulation 7. Regarding the physicochemical results, it was verified that
L* (lightness) was lighter in formulation 7 compared with formulation 3.
Visually, formulation 7 presented a light purple coloration in contrast to formulation 3 which
showed a darker purple coloration. This might be due to the variety of sweet potatoes that were used
at the time or in harvest, since they had a purplish pulp, or this may even be related to the antioxidant
content. In Table 5, the values regarding the particle size of the flour are shown. The particle size of the
flour retained in the final vessel after passing through the last sieve (48) had a size of 300 microns.
Table 5. Particle size distribution of sweet potato flour.
Sieves (mesh) Retained Portion (g)
10 15
12 20
14 30
35 40
48 20
Final Vessel 75
Data represent the mesh for each sieve in the system approach. Means the sweet potato flour portion in each sieve.
4. Conclusions
According to the results of the sensory analysis, shakes containing 10% sweet potato flour and
those with 25% maltodextrin obtained higher scores from the panelists, a greater global acceptance
and greater purchase intention. For the appearance, aroma, flavor, texture and overall impression,
the values obtained were higher than 5, which denotes “good acceptance”.
Sweet potato flour can be used as a raw material in the development of the shake. No statistical
differences were found between the formulations in most analyses. For this reason, we consider
maltodextrin as a suitable replacement for sweet potato flour, which, in addition to reducing theBeverages 2019, 5, 18 7 of 8
final value of the product, is also a low-cost raw material. The replacement of maltodextrin for sweet
potato flour is a credible alternative for shakes. According to the sensory evaluation, the replacement
had good acceptance values from the panelists, showing that the production of this shake is feasible
considering the taste and also a good alternative drink for people who practice physical activities.
Author Contributions: All authors contributed to the original draft preparation, revision and editing.
Funding: This research received Araucária Foundation and to the National Council for Scientific and Technological
Development (CNPq) funding.
Conflicts of Interest: The authors declare no conflict of interest.
References
1. Cavalcante, J.T.; Ferreira, P.V.; Soares, L.; Borges, V.; da Silva, P.P.; da Silva, J.W. Análise de trilha em caracteres
de rendimento de clones de batatadoce (Ipomoea batatas (L.) Lam). Acta Sci. Agron. 2006, 28, 261–266.
[CrossRef]
2. FAOSTAT. Available online: http://www.fao.org/faostat/en/#data/QC (accessed on 5 November 2018).
3. Olatunde, G.O.; Henshaw, F.O.; Idowu, M.A.; Tomlins, K. Quality attributes of sweet potato flour as
influenced by variety, pretreatment and drying method. Food Sci. Nutr. 2016. [CrossRef] [PubMed]
4. Wang, Z.; Fang, B.; Chen, X.; Liao, M.; Chen, J.; Zhang, X.; Huang, L.; Luo, Z.; Yao, Z.; Li, Y. Temporal patterns
of gene expression associated with tuberous root formation and development in sweetpotato (Ipomoea
batatas). BMC Plant Biol. 2015, 15, 180. [CrossRef] [PubMed]
5. Nzamwita, M.; Duodu, K.G.; Minnaar, A. Stability of β-carotene during baking of orange-fleshed sweet
potato-wheat composite bread and estimated contribution to vitamin A requirements. Food Chem. 2017, 228,
85–90. [CrossRef] [PubMed]
6. El Sheikha, A.F.; Ray, R.C. Potential impacts of bioprocessing of sweet potato: Review. Crit. Rev. Food
Sci. Nutr. 2017, 57, 455–471. [CrossRef] [PubMed]
7. Cole, M.; Hopker, J.G.; Wiles, J.D.; Coleman, D.A. The effects of acute carbohydrate and caffeine feeding
strategies on cycling efficiency. J. Sports Sci. 2018, 36, 817–823. [CrossRef] [PubMed]
8. Baker, L.; Rollo, I.; Stein, K.; Jeukendrup, A. Acute Effects of Carbohydrate Supplementation on Intermittent
Sports Performance. Nutrients 2015, 7, 5733–5763. [CrossRef] [PubMed]
9. Russell, M.; Benton, D.; Kingsley, M. Influence of carbohydrate supplementation on skill performance during
a soccer match simulation. J. Sci. Med. Sport 2012, 15, 348–354. [CrossRef] [PubMed]
10. Mujika, I.; Burke, L.M. Nutrition in Team Sports. Ann. Nutr. Metab. 2010, 57, 26–35. [CrossRef] [PubMed]
11. Carvalho, J.; Gonçalves, C.; Gil, A.M.; Gama, F.M. Production and characterization of a new dextrin based
hydrogel. Eur. Polym. J. 2007, 43, 3050–3059. [CrossRef]
12. Ormsbee, M.; Bach, C.; Baur, D. Pre-Exercise Nutrition: The Role of Macronutrients, Modified Starches
and Supplements on Metabolism and Endurance Performance. Nutrients 2014, 6, 1782–1808. [CrossRef]
[PubMed]
13. Larson, N.; Laska, M.N.; Story, M.; Neumark-Sztainer, D. Sports and energy drink consumption are linked to
health-risk behaviours among young adults. Public Health Nutr. 2015, 18, 2794–2803. [CrossRef] [PubMed]
14. Brink-Elfegoun, T.; Ratel, S.; Leprétre, P.-M.; Metz, L.; Ennequin, G.; Doré, E.; Martin, V.; Bishop, D.;
Aubineau, N.; Lescuyer, J.-F.; et al. Effects of sports drinks on the maintenance of physical performance
during 3 tennis matches: A randomized controlled study. J. Int. Soc. Sports Nutr. 2014, 11, 46. [CrossRef]
[PubMed]
15. Carter, J.; Jeukendrup, A.E.; Jones, D.A. The effect of sweetness on the efficacy of carbohydrate
supplementation during exercise in the heat. Can. J. Appl. Physiol. 2005, 30, 379–391. [CrossRef] [PubMed]
16. Borges Sapata, K.; Paula, A.; Fayh, T.; Reischak De Oliveira, A.; Glicemia, P.-C. Efeitos do consumo prévio de
carboidratos sobre a resposta glicêmica e desempenho. Rev. Bras. Med. Esporte 2006, 12, 189–194. [CrossRef]
17. Ballistreri, M.C.; Mendonça Corradi-Webster, C. Consumption of Energy drinks among physical education
students. Rev. Latino-Am Enfermagem. 2018, 16, 558–564. [CrossRef]
18. Bezerra, J.R.M.V.; Rigo, M.; Teixeira, Â.M.; Angelo, M.A.; Czaikoski, A. Processing of cereal bars with added
sweet potato flour (Ipomea batatas L.). Ambiência 2015, 11, 65–73. [CrossRef]Beverages 2019, 5, 18 8 of 8
19. Association of Official Analytical Chemists. Official Methods of Analysis; Association of Official Analytical
Chemists: Washington, DC, USA, 2005.
20. Bassinello, P.Z.; Carvalho, A.V.; de Rios, A.O.; de Maciel, R.A.; Berrios, J.D.J. Expanded Gluten-Free
Extrudates Made from Rice Grits and Bandinha (Bean) Flour Mixes: Main Quality Properties. J. Food
Process. Preserv. 2015, 39, 2267–2275. [CrossRef]
21. Falade, K.O.; Omiwale, O.O. Effect of Pretreatments on Color, Functional and Pasting Properties of White (D
ioscorea rotundata) and Yellow Yam (D ioscorea cayenensis) Varieties. J. Food Process. Preserv. 2015, 39, 1542–1554.
[CrossRef]
22. Hidalgo, A.; Fongaro, L.; Brandolini, A. Wheat flour granulometry determines colour perception.
Food Res. Int. 2014, 64, 363–370. [CrossRef] [PubMed]
23. Paixão, J.A.; Rodrigues, J.B.; Esmerino, E.A.; Cruz, A.G.; Bolini, H.M.A. Influence of temperature and fat
content on ideal sucrose concentration, sweetening power, and sweetness equivalence of different sweeteners
in chocolate milk beverage. J. Dairy Sci. 2014, 97, 7344–7353. [CrossRef] [PubMed]
24. Los, P.R.; Braga, C.M.; De Carvalho, J.R.F.; Simões, D.R.S.; Nogueira, A. Application of sensory analyses in
the development of a new apple cider. Rev. Bras. Tecnol. Agroindustrial 2017, 10, 2150–2168. [CrossRef]
25. Borges, R.S.; Prudêncio, S.H.; Roberto, S.R.; de Assis, A.M. Avaliação sensorial de suco de uva cv. Isabel em
cortes com diferentes cultivares. Rev. Bras. Frutic. 2011, 33, 584–591. [CrossRef]
26. Silva, F.A.; Carlos, A.V.A. The Assistat Software Version 7.7 Beta and its use in the analysis of experimental
data. Afr. J. Agric. Res. 2016, 11, 3733–3740. [CrossRef]
27. Van Hal, M. Quality of sweetpotato flour during processing and storage. Food Rev. Int. 2000, 16, 1–37.
[CrossRef]
© 2019 by the authors. Licensee MDPI, Basel, Switzerland. This article is an open access
article distributed under the terms and conditions of the Creative Commons Attribution
(CC BY) license (http://creativecommons.org/licenses/by/4.0/).You can also read