Global DNA Methylation in the Limbic System of Cattle - MDPI
←
→
Page content transcription
If your browser does not render page correctly, please read the page content below
epigenomes
Brief Report
Global DNA Methylation in the Limbic System
of Cattle
Bonnie Cantrell 1 , Hannah Lachance 1 , Brenda Murdoch 2 , Julia Sjoquist 3 , Richard Funston 4 ,
Robert Weaber 5 and Stephanie McKay 1, *
 1   Department of Animal and Veterinary Sciences, University of Vermont, Burlington, VT 05405, USA;
     bonnie.cantrell@uvm.edu (B.C.); lachance.hannah@gmail.com (H.L.)
 2   Department of Animal and Veterinary Science, University of Idaho, Moscow, ID 83844, USA;
     bmurdoch@uidaho.edu
 3   Department of Neurological Sciences, University of Vermont, Burlington, VT 05405, USA;
     julia.sjoquist@uvm.edu
 4   West Central Research and Extension Center, University of Nebraska, North Platte, NE 69101, USA;
     rick.funston@unl.edu
 5   Department of Animal Sciences and Industry, Kansas State University, Manhattan, KS 66506, USA;
     bweaber@ksu.edu
 *   Correspondence: stephanie.mckay@uvm.edu; Tel.: +1-802-656-2075

 Received: 11 March 2019; Accepted: 29 April 2019; Published: 5 May 2019

 Abstract: To elucidate the extent to which DNA methylation varies across multiple tissues in the
 brain and between animals, we have quantified global DNA methylation in tissues comprising the
 limbic system for six Red Angus x Simmental steers. Global DNA methylation was measured in nine
 regions of the bovine brain: amygdala, the bed nucleus of the stria terminalis, cingulate gyrus, dorsal
 raphe, hippocampus, hypothalamus, nucleus accumbens, periaqueductal gray and prefrontal cortex.
 DNA methylation varies among animals for each tissue type and varies among tissue types for each
 animal. The highest amounts of DNA methylation were found in the amygdala, cingulate gyrus and
 dorsal raphe, while the bed nucleus of the stria terminalis, nucleus accumbens and periaqueductal
 gray had the lowest amounts of DNA methylation. A heatmap sorted by k-means clustering was
 generated to graphically display percent DNA methylation in relation to tissue type and animal
 number. This is the first study to report measures of DNA methylation in the limbic system of the
 bovine brain and can be used to inform the cattle genomics community of expected variation in cattle
 brain methylation.

 Keywords: epigenetics; methylation; cattle; temperament; brain

1. Introduction
     Epigenetic modifications are a source of phenotypic variation that are independent of DNA
sequence variation. Epigenetic modifications do not change the DNA sequence itself but can
affect transcription and are important mediators of gene expression [1]. Consequently, epigenetic
modifications can cause one genotype to produce alternative phenotypes. DNA methylation is a type
of epigenetic modification that in mammals primarily involves the addition of a methyl group to the
5 position of cytosines that are found in CpG dinucleotides. When 5-methylcytosine (5-mC) is found in
the 50 promoter region of a gene, it can prevent transcriptional machinery from binding to its target,
resulting in the silencing of gene transcription [2].
     DNA methylation patterns are unique in mammalian brains. Brain functions impacted by DNA
methylation include motivational and emotional behavior, which are regulated by the limbic system [3].
The limbic system has been investigated primarily in rats and mice for variation in global DNA

Epigenomes 2019, 3, 8; doi:10.3390/epigenomes3020008                        www.mdpi.com/journal/epigenomes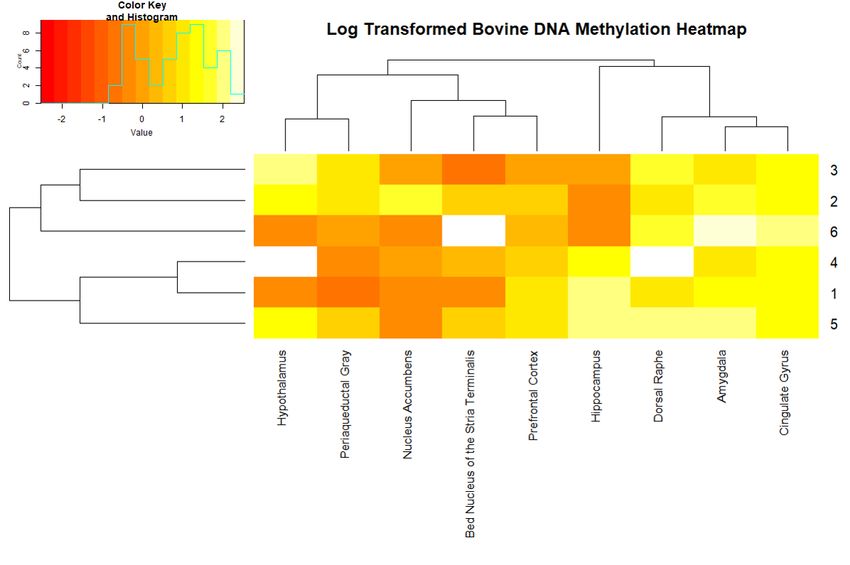
Epigenomes 2019, 3, x FOR PEER REVIEW 2 of 7
DNA methylation patterns are unique in mammalian brains. Brain functions impacted by DNA
Epigenomes 2019, 3, 8 2 of 7
methylation include motivational and emotional behavior, which are regulated by the limbic system
[3]. The limbic system has been investigated primarily in rats and mice for variation in global DNA
methylation
methylationwith withregard
regardtotoaddiction,
addiction,nutrition,
nutrition,disease,
disease,stress,
stress,and
andaging
aging[4–14].
[4–14].Gibbs
Gibbsetetal.
al.[15]
[15]
quantified
quantifiedDNA DNAmethylation
methylationlevels
levelsfor
forthe
thehuman
humancerebellum,
cerebellum,frontal
frontalcortex,
cortex,temporal
temporalcortex,
cortex,andand
pons.
pons.Generally,
Generally, methylation levels were
methylation levels weresimilar
similarbetween
betweencortical
corticalbrain
brain regions
regions andand
thethe brainstem,
brainstem, but
but different
different fromfrom the cerebellum.
the cerebellum. TheseThese studies
studies highlight
highlight the importance
the importance of examining
of examining multiplemultiple
tissues
tissues
withinwithin theto
the brain brain to determine
determine the extent
the extent of epigenetic
of epigenetic modulation.
modulation.
Comprehending
Comprehendingthe therole
roleofofDNA
DNAmethylation
methylationrelative
relativetotofunction
functionandandcomplex
complextraits
traitsrequires
requires
knowledge
knowledgeofofthe theglobal
globalrepresentation
representationofoftissue
tissuespecificity
specificityand
andvariation.
variation.Our
Ourstudy
studyfocuses
focusesononnine
nine
tissue
tissuetypes
typeswithin
withinthe thelimbic
limbicsystem,
system,ofofwhich
whichthree
threehave
havenever
neverbeen
beenexamined
examinedfor forglobal
globalDNADNA
methylation
methylationininany anyspecies.
species.Here,
Here,wewehave
havequantified
quantifiedthe
thevariation
variationofofglobal
globalDNA
DNAmethylation
methylationwithin
within
the
thelimbic
limbicsystem
systemofofcattle.
cattle.
2.2.Results
Results
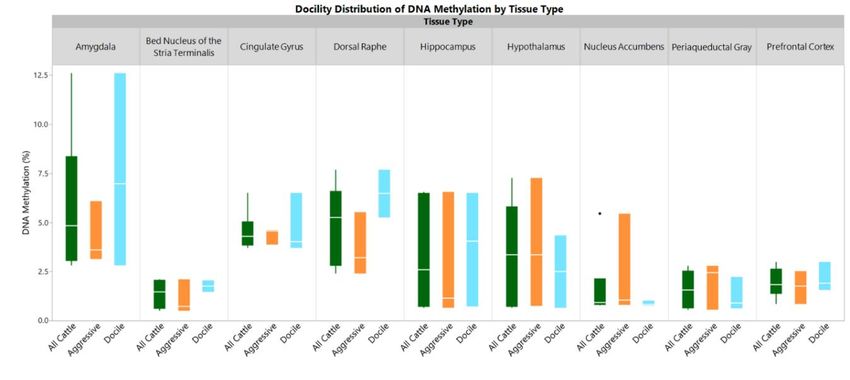
Average measures
Average measures ofof global
global DNA
DNA methylation
methylationranged
rangedfrom 1.38± ±0.74%
from1.38 0.74%inin
the bed
the bed nucleus of the
nucleus of
stria terminalis to 5.87 ± 3.70% in amygdala (Figure 1). DNA methylation
the stria terminalis to 5.87 ± 3.70% in amygdala (Figure 1). DNA methylation levels were levels were heterogeneous
within tissue types
heterogeneous andtissue
within within eachand
types animal (Figure
within each2).animal
The dorsal raphe,
(Figure 2). amygdala,
The dorsaland cingulate
raphe, gyrus
amygdala,
contained consistently higher amounts of DNA methylation in each animal.
and cingulate gyrus contained consistently higher amounts of DNA methylation in each animal. Conversely, the lowest
amount of DNA
Conversely, methylation
the lowest amountin most animals
of DNA was foundininmost
methylation the nucleus
animals accumbens.
was found The
inexception was
the nucleus
animal 2 that
accumbens. Theshowed a higher
exception waslevel of methylation
animal 2 that showedin the nucleuslevel
a higher accumbens but was the
of methylation outlier
in the in the
nucleus
boxplot (Figure
accumbens but was1). the outlier in the boxplot (Figure 1).
Figure 1. Distribution of Global DNA Methylation by Tissue Type.
Figure 1. Distribution of Global DNA Methylation by Tissue Type.
Outlier box plots are shown for each tissue type based on the percent of methylation. The solid
box outlinesbox
Outlier theplots are 3rd
1st and shown for each
quartiles tissue
with type
a line based
in the on therepresenting
middle percent of methylation.
the median. The solid
Whiskers
box outlines
extend up tothe
the 1st and 3rd
distance quartiles
of the with aranges.
interquartile line in The
the ends
middle representing
of the thethe
whiskers are median.
highestWhiskers
or lowest
extend
percentup to the distance
of methylation of the
within interquartile
a normal ranges.
distribution. The ends
A black of the whiskers
dot indicates an outlierare highest or
in the distribution.
lowestApercent
heatmap ofofmethylation within a DNA
the log-transformed normal distribution.
methylation A black
levels dottissues
for nine indicates anbovine
of the outlierbrain
in thein
distribution.
six animals. The key identifies the log-transformed DNA methylation percentage as “Value” and the
A heatmap
number of the
of animals log-transformed
for each methylation DNA methylation
percentage levels
is labeled for nine
as count. tissues
Tissues andof the bovine
animal brain
numbers are
insorted
six animals. The key identifies the log-transformed DNA methylation percentage
according to k-means clustering results. Three samples have missing data indicated by a white as “Value” and
the
boxnumber
(animal of4’sanimals for each
dorsal raphe and methylation
hypothalamus percentage
and animal is 6’s
labeled as count.
bed nucleus Tissues
of the and animal
stria terminalis).
numbers are sorted according to k-means clustering results. Three samples
Discrepancies between hierarchical clustering and k-means clustering were identified when have missing data
indicated
examining byDNA
a white box (animal
methylation 4’s dorsal
levels. raphetissue
Clustering and hypothalamus
type with threeand animal
centers for 6’s bed nucleus
k-means of
generated
the stria
three terminalis).
clusters: (1) amygdala, cingulate gyrus, and dorsal raphe, (2) the bed nucleus of the stria terminalis,
hypothalamus, nucleus accumbens and periaqueductal gray, (3) hippocampus and prefrontal cortex.
Hierarchical clustering identified three clusters: (1) amygdala and cingulate gyrus, (2) the bed nucleusEpigenomes 2019, 3, 8 3 of 7
of the stria terminalis and prefrontal cortex, (3) hypothalamus and periaqueductal gray (Figure 2).
For both methods, the amygdala clustered with cingulate gyrus and hypothalamus clustered with
periaqueductal gray, thus, indicating more similarity in DNA methylation levels in these two pairs of
tissues compared
Epigenomes to other
2019, 3, x FOR tissues measured.
PEER REVIEW 3 of 7
Figure 2. K-means Sorted Heatmap of Global DNA Methylation by Tissue Type and Animal Number.
Figure 2. K-means Sorted Heatmap of Global DNA Methylation by Tissue Type and Animal Number.
3. Discussion
Discrepancies
Each tissue withinbetween hierarchical
the brain, although clustering and k-means
interconnected through clustering were identified
neural pathways, has itswhen
own
examining
unique DNA methylation
functions that may belevels. Clustering
contributing tissue typeinwith
to differences DNA three centers forbetween
methylation k-meanseach
generated
tissue
three clusters:
type. (1) amygdala,
The periaqueductal graycingulate
has been gyrus,
shown andtodorsal raphe, (2)tothe
be connected thebed nucleus of the
hypothalamus stria
through
terminalis,
the hypothalamus,
oxytocinergic nucleus
social network accumbens
[16]. We foundand DNAperiaqueductal gray, (3)
methylation levels to behippocampus and
similar between
prefrontal
the cortex. Hierarchical
hypothalamus clusteringgray
and periaqueductal identified
(Figure three clusters:
2), which may (1) indicate
amygdala a and cingulate
similar use ofgyrus,
DNA
(2) the bed nucleus
methylation for theof the stria terminalis
oxytocinergic and prefrontal
social network. cortex,
We also found(3) the
hypothalamus
amygdala and andcingulate
periaqueductal
gyrus
gray (Figure
cluster 2). Fortogether,
consistently both methods,
which the
mayamygdala clustered
indicate similar with cingulate
epigenetic gyrus
regulation and hypothalamus
between these tissues.
clustered
The with periaqueductal
amygdala, cingulate gyrusgray, thus, indicating
and dorsal raphe have more similarity
the highest in DNA
average andmethylation levels in
nucleus accumbens
these two pairs of tissues compared to other tissues measured.
has the lowest average percentages of global DNA methylation (Figure 1 and Supplementary Table
S1). Cingulate gyrus and dorsal raphe are important intermediates in neural signaling pathways of
3. Discussion
neurotransmitters [16,17]. The cingulate gyrus is an integration point of the emotion and memory
processing limbic cortex
Each tissue within the andbrain,
the decision-making cerebral cortex.
although interconnected throughThe amygdala
neural is important
pathways, for
has its own
the regulation of signaling within the limbic system involving the signaling pathways
unique functions that may be contributing to differences in DNA methylation between each tissue of serotonin,
glutamate, and dopamine and
type. The periaqueductal grayishas
thought
beentoshown
be thetomain regulator oftothe
be connected thehypothalamus’s
hypothalamus function
through[17].
the
These tissues may utilize methylation to regulate signaling processing differently
oxytocinergic social network [16]. We found DNA methylation levels to be similar between the for each pathway
that it interacts and
hypothalamus with,periaqueductal
thus partially explaining
gray (Figure the2),
higher
whichpercentages
may indicate of global DNA use
a similar methylation.
of DNA
Interestingly, the hippocampus showed the greatest difference between animals
methylation for the oxytocinergic social network. We also found the amygdala and cingulate gyrus with respect to
log-transformed DNA methylation level and clustered animals into two groups (Figure
cluster consistently together, which may indicate similar epigenetic regulation between these tissues. 2). This
elucidates
The amygdala,the potential
cingulateofgyrus
globaland
DNA methylation
dorsal in the
raphe have thehippocampus
highest average to play
and drastically different
nucleus accumbens
roles within cattle.
has the lowest average percentages of global DNA methylation (Figure 1 and Supplementary Table
S1). Cingulate gyrus and dorsal raphe are important intermediates in neural signaling pathways of
neurotransmitters [16,17]. The cingulate gyrus is an integration point of the emotion and memory
processing limbic cortex and the decision-making cerebral cortex. The amygdala is important for the
regulation of signaling within the limbic system involving the signaling pathways of serotonin,
glutamate, and dopamine and is thought to be the main regulator of the hypothalamus’s function
[17]. These tissues may utilize methylation to regulate signaling processing differently for eachEpigenomes 2019, 3, 8 4 of 7
Global DNA methylation levels and variation across samples within this study are similar to other
studies. Global DNA methylation levels less than 1% are not uncommon for brain tissues. Reports of
global DNA methylation in the hippocampus have ranged from >0.01% to 1.15% across rat studies
using the same global quantification kit as the current study [18,19]. We found that half of our animals
had global DNA methylation levels less than 1.15% in the hippocampus. However, the other half of
the animals had values greater than 4%. Similarly, we found that two of the five animals dissected for
the hypothalamus have global DNA methylation levels within the previously reported range of 0.5%
to 1.25% and the remaining samples have greater than 3.3% global DNA methylation [20]. While these
levels of global DNA methylation seem high for brain tissues, our data are similar to that previously
reported for cattle [21]. In 2018, Mendonça and colleagues quantified global DNA methylation in
blood, funiculus umbilicalis, cotyledon, and allantochorion tissues in newborn calves using the same
MethylFlash kit (Epigentek, Farmingdale, NY, USA) as the present study. Mendonça reported high
levels of global DNA methylation across tissues (10.71–24.13%) in male calves and a standard error of
mean up to 4.31% in males and 7.56% in females [21]. We found DNA methylation to range fromEpigenomes 2019, 3, 8 5 of 7
contamination using the NanoDrop 1000 Spectrophotometer (Thermo Scientific, Wilmington, DE, USA)
and quality checked for the absence of DNA sheering using a 1% agarose gel with ethidium bromide.
4.3. Global DNA Methylation Measurement
All samples were tested for global DNA methylation using the MethylFlash™ Methylated DNA
Quantification Kit (Colorimetric) (Epigentek, Farmingdale, NY, USA). The MethylFlash (previously
called Methlamp) kit is advertised as having an accuracy of 99% in determining global DNA
methylation [22]. MethylFlash uses an enzyme-linked immunosorbent assay (ELISA) based method to
quantify global DNA methylation. This method of global DNA methylation quantification has been
adopted by multiple antibody and epigenetic companies including Zymo (Irvine, CA, USA), Abcam
(Cambridge, MA, USA), Sigma (St. Louis, MO, USA), and Cell Bio Labs (San Diego, CA, USA). However,
of these methods, Epigentek’s MethylFlash kit was published more frequently [23]. Studies that have
compared immunoquantification and ELISA-based assays of global DNA quantification have found the
results to be comparable to other methods of global DNA methylation, but there is a greater limitation
on detection range of DNA methylation and robustness in ELISA based methods [23–25]. ELISA-based
methods are easier to use and cost less than mass spectrometry and chromatography-based methods,
allowing for ELISAs to be more applicable in clinical settings [25]. The standard protocol was modified
to better control for the variation between duplicates on the plate as the accuracy of ELISA-based kits
can be limited if washing and the various antibodies timing are not first optimized [26].
For each sample, 50–200 ng of DNA was used, in duplicate, as recommended by Epigentek.
Epigentek states that the MethylFlash kit specificity binds single- or double-stranded DNA 100 bp or
larger to the assay plate. The manufacturer’s standard absolute quantification protocol was modified
according to recommendations from Epigentek (personal communication). Briefly, those modifications
were the use of a multichannel pipette, use of one set of tips to add a solution and a new set for removal
of solution, avoiding contact with the sides of the wells of the plate, tilting the plate to remove solutions,
keeping consistent timing during color changing steps, and avoiding exposure to light during the color
changing steps. In order to decrease the percent coefficient of variation between duplicate samples,
additional modifications were implemented for seventeen samples. Specifically, to remove solutions,
the plate was inverted quickly and hit on an absorbent pad until the wells appeared dry. Absorbance
readings from each plate were calculated at 450 nm using a BioTek Synergy Plate Reader and the Gen 5
Program Data Analysis Software V.2.03 (Winooski, VT, USA).
4.4. Data Analysis
A standard curve was generated in Microsoft Excel 2013 (Redmond, WA, USA) using control
samples (provided in the kit) from each plate. Subsequently, the percent coefficient of variation (CV)
was calculated for the optical density (OD) values of the duplicates:
Standard Deviation
× 100 = %CV
AverageOD
Samples with a less than 15% CV were considered passing for each plate as recommended by Epigentek
(personal communication). Percent global DNA methylation was calculated using Epigentek’s equation
for absolute quantification, which accounts for the amount of DNA used for each sample.
Descriptive statistics were generated in RStudio version 1.0.136 (RStudio, Boston, MA) and
JMP® Pro 12.1.0 (SAS Institute Inc., Cary, NC, USA). Outlier box plots were constructed in JMP® .
The distribution of DNA methylation was skewed to the right and therefore a log transformation
was performed to normalize the percentages of DNA methylation. The heatmap and k-means were
generated in RStudio for log-transformed data. Heatmaps were created using heatmaps.2 within
gplots 3.0.1 sorted for tissue type and animal number by k-mean clustering with no trace [27]. The
heatmaps.2 algorithm creates a dendrogram based on agglomerative hierarchical clustering. This
method builds a distance matrix starting with one node for each sample and repeating until there isEpigenomes 2019, 3, 8 6 of 7
one node for all samples. The Lance–Williams dissimilarity formula is used by the program to cluster
the samples by Euclidean distance. There were missing data for the bed nucleus of the stria terminalis,
dorsal raphe, and hypothalamus and therefore k-means clustering used the k-POD algorithm for a
maximum of 100 iterations in the kpodclustr package to account for the missing data [28]. The k-means
clustering method starts with a random sample as its center of the cluster for a k number of centers.
Similar to hierarchical clustering, the Euclidean distance is calculated between samples to the nearest
center. However, the mean distance to the center of all samples in the cluster is used to calculate the
location of the next center and the calculation is repeated. The K-POD clustering results were based on
two centers for comparison between animals and three centers for comparison between tissue types.
Biologically, it was unknown how different tissues would cluster in respect to DNA methylation levels
and therefore to determine the number of centers, the RStudio package ‘stats’ (version 3.2.5) hclust
function was used to cluster by Euclidean distance with the ward.2 cluster method. The number of
centers used for tissue comparisons were based on the tightness of clustering in the output of Ward’s
hierarchical clustering.
Supplementary Materials: The following are available online at http://www.mdpi.com/2075-4655/3/2/8/s1.
Table S1: Table of Percent Global DNA Methylation.
Author Contributions: B.C. assisted in experimental design, performed assays, analyzed data and drafted the
manuscript. H.L. assisted in experimental design and implementation of assay protocols. B.M. and J.S. assisted in
drafting the manuscript. R.F. provided samples, assisted in sample collection and drafting the manuscript. R.W.
assisted in sample collection, experimental design and drafting the manuscript. S.M. assisted in sample collection,
experimental design, and drafting the manuscript.
Funding: This work was supported by the Walton-Berry Graduate Student Support Grant from the American
Simmental Association, NRSP-8 HATCH Grant no. 2013-VT-H02017MS and USDA-NIFA-2016-67016-24766 from
the USDA National Institute of Food and Agriculture.
Conflicts of Interest: The authors declare that they have no conflicts of interests.
References
1. Murdoch, B.M.; Murdoch, G.K.; Greenwood, S.; McKay, S. Nutritional Influence on Epigenetic Marks and
Effect on Livestock Production. Front. Genet. 2016, 7. [CrossRef] [PubMed]
2. Portela, A.; Esteller, M. Epigenetic modifications and human disease. Nat. Biotechnol. 2010, 28, 1057–1068.
[CrossRef]
3. Meaney, M.J.; Szyf, M. Environmental programming of stress responses through DNA methylation: Life at
the interface between a dynamic environment and a fixed genome. Dialogues Clin. Neurosci. 2005, 7, 103–123.
[PubMed]
4. Chouliaras, L.; Mastroeni, D.; Delvaux, E.; Grover, A.; Kenis, G.; Hof, P.R.; Steinbusch, H.W.M.; Coleman, P.D.;
Rutten, B.P.F.; van den Hove, D.L.A. Consistent decrease in global DNA methylation and hydroxymethylation
in the hippocampus of Alzheimer’s disease patients. Neurobiol. Aging 2013, 34, 2091–2099. [CrossRef]
[PubMed]
5. Jadavji, N.M.; Deng, L.; Leclerc, D.; Malysheva, O.; Bedell, B.J.; Caudill, M.A.; Rozen, R. Severe
methylenetetrahydrofolate reductase deficiency in mice results in behavioral anomalies with morphological
and biochemical changes in hippocampus. Mol. Genet. Metab. 2012, 106, 149–159. [CrossRef]
6. LaPlant, Q.; Vialou, V.; Covington, H.E.; Dumitriu, D.; Feng, J.; Warren, B.L.; Maze, I.; Dietz, D.M.; Watts, E.L.;
Iniguez, S.D.; et al. Dnmt3a regulates emotional behavior and spine plasticity in the nucleus accumbens.
Nat. Neurosci. 2010, 13, 1137–1143. [CrossRef] [PubMed]
7. Mychasiuk, R.; Harker, A.; Ilnytskyy, S.; Gibb, R. Paternal stress prior to conception alters DNA methylation
and behaviour of developing rat offspring. Neuroscience 2013, 241, 100–105. [CrossRef]
8. Mychasiuk, R.; Ilnytskyy, S.; Kovalchuk, O.; Kolb, B.; Gibb, R. Intensity matters: Brain, behaviour and the
epigenome of prenatally stressed rats. Neuroscience 2011, 180, 105–110. [CrossRef]
9. Mychasiuk, R.; Muhammad, A.; Ilnytskyy, S.; Kolb, B. Persistent gene expression changes in NAc, mPFC,
and OFC associated with previous nicotine or amphetamine exposure. Behav. Brain Res. 2013, 256, 655–661.
[CrossRef] [PubMed]Epigenomes 2019, 3, 8 7 of 7
10. Rodrigues, G.M., Jr.; Toffoli, L.V.; Manfredo, M.H.; Francis-Oliveira, J.; Silva, A.S.; Raquel, H.A.;
Martins-Pinge, M.C.; Moreira, E.G.; Fernandes, K.B.; Pelosi, G.G.; et al. Acute stress affects the global DNA
methylation profile in rat brain: Modulation by physical exercise. Behav. Brain Res. 2015, 279, 123–128.
[CrossRef]
11. Sable, P.; Randhir, K.; Kale, A.; Chavan-Gautam, P.; Joshi, S. Maternal micronutrients and brain global
methylation patterns in the offspring. Nutr. Neurosci. 2015, 18, 30–36. [CrossRef]
12. Simmons, R.K.; Stringfellow, S.A.; Glover, M.E.; Wagle, A.A.; Clinton, S.M. DNA methylation markers in the
postnatal developing rat brain. Brain Res. 2013, 1533, 26–36. [CrossRef]
13. Toffoli, L.V.; Rodrigues, G.M., Jr.; Oliveira, J.F.; Silva, A.S.; Moreira, E.G.; Pelosi, G.G.; Gomes, M.V. Maternal
exposure to fluoxetine during gestation and lactation affects the DNA methylation programming of rat’s
offspring: Modulation by folic acid supplementation. Behav. Brain Res. 2014, 265, 142–147. [CrossRef]
14. Williams-Karnesky, R.L.; Sandau, U.S.; Lusardi, T.A.; Lytle, N.K.; Farrell, J.M.; Pritchard, E.M.; Kaplan, D.L.;
Boison, D. Epigenetic changes induced by adenosine augmentation therapy prevent epileptogenesis. J. Clin.
Investig. 2013, 123, 3552–3563. [CrossRef]
15. Gibbs, J.R.; van der Brug, M.P.; Hernandez, D.G.; Traynor, B.J.; Nalls, M.A.; Lai, S.-L.; Arepalli, S.; Dillman, A.;
Rafferty, I.P.; Troncoso, J.; et al. Abundant Quantitative Trait Loci Exist for DNA Methylation and Gene
Expression in Human Brain. PLoS Genet. 2010, 6, e1000952. [CrossRef]
16. Keltner, D.; Kogan, A.; Piff, P.K.; Saturn, S.R. The Sociocultural Appraisals, Values, and Emotions (SAVE)
Framework of Prosociality: Core Processes from Gene to Meme. Annu. Rev. Psychol. 2014, 65, 425–460.
[CrossRef]
17. Morgane, P.J.; Galler, J.R.; Mokler, D.J. A review of systems and networks of the limbic forebrain/limbic
midbrain. Prog. Neurobiol. 2005, 75, 143–160. [CrossRef]
18. Mega, F.; de Meireles, A.L.F.; Piazza, F.V.; Spindler, C.; Segabinazi, E.; dos Santos Salvalaggio, G.; Achaval, M.;
Marcuzzo, S. Paternal physical exercise demethylates the hippocampal DNA of male pups without modifying
the cognitive and physical development. Behav. Brain Res. 2018, 348, 1–8. [CrossRef]
19. Spindler, C.; Segabinazi, E.; Meireles, A.; Piazza, F.; Mega, F.; dos Santos Salvalaggio, G.; Achaval, M.; Elsner, V.;
Marcuzzo, S. Paternal physical exercise modulates global DNA methylation status in the hippocampus of
male rat offspring. Neural. Regen. Res. 2019, 14, 491–500. [CrossRef]
20. Chastain, L.G.; Franklin, T.; Gangisetty, O.; Cabrera, M.A.; Mukherjee, S.; Shrivastava, P.; Jabbar, S.; Sarkar, D.K.
Early life alcohol exposure primes hypothalamic microglia to later-life hypersensitivity to immune stress:
Possible epigenetic mechanism. Neuropsychopharmacology 2019. [CrossRef]
21. Mendonça, A.S.; Braga, T.F.; Melo, E.O.; Dode, M.A.; Franco, M.M. Distribution of 5-methylcytosine and
5-hydroxymethylcytosine in bovine fetal tissue of the placenta. Pesqui. Veterinária Bras. 2018, 38, 2012–2018.
22. Tools of the trade. Nature 2008, 454, 796. [CrossRef]
23. Kurdyukov, S.; Bullock, M. DNA Methylation Analysis: Choosing the Right Method. Biology 2016, 5, 3.
[CrossRef]
24. Kremer, D.; Metzger, S.; Kolb-Bachofen, V.; Kremer, D. Quantitative measurement of genome-wide DNA
methylation by a reliable and cost-efficient enzyme-linked immunosorbent assay technique. Anal. Biochem.
2012, 422, 74–78. [CrossRef]
25. Chowdhury, B.; Cho, I.-H.; Irudayaraj, J. Technical advances in global DNA methylation analysis in human
cancers. J. Biol. Eng. 2017, 11, 10. [CrossRef]
26. Gan, S.D.; Patel, K.R. Enzyme immunoassay and enzyme-linked immunosorbent assay. J. Invest. Derm. 2013,
133, e12. [CrossRef]
27. Warnes, G.; Bolker, B.; Bonebakker, L.; Gentleman, R.; Huber, W.; Liaw, A.; Lumley, T.; Maechler, M.;
Magnusson, A.; Moeller, S.; et al. gplots: Various R Programming Tools for Plotting Data. R package version
3.0.1. The Comprehensive R Archive Network. 2016. Available online: http://cran.r-project.org/web/packages/
gplots/ (accessed on 17 October 2018).
28. Chi, J.T.; Chi, E.C.; Baraniuk, R.G. K-POD: A method for k-means clustering of missing data. Am. Stat. 2016,
70, 91–99. [CrossRef]
© 2019 by the authors. Licensee MDPI, Basel, Switzerland. This article is an open access
article distributed under the terms and conditions of the Creative Commons Attribution
(CC BY) license (http://creativecommons.org/licenses/by/4.0/).You can also read