Pedagogy and Infrastructure for Upper-Division Data Science Courses
←
→
Page content transcription
If your browser does not render page correctly, please read the page content below

Pedagogy and Infrastructure for Upper-Division Data
                Science Courses

                Allen Shen

                Electrical Engineering and Computer Sciences
                University of California, Berkeley

                Technical Report No. UCB/EECS-2021-122
                http://www2.eecs.berkeley.edu/Pubs/TechRpts/2021/EECS-2021-122.html

                May 14, 2021
Copyright © 2021, by the author(s).
                            All rights reserved.

Permission to make digital or hard copies of all or part of this work for
personal or classroom use is granted without fee provided that copies are
not made or distributed for profit or commercial advantage and that copies
bear this notice and the full citation on the first page. To copy otherwise, to
republish, to post on servers or to redistribute to lists, requires prior specific
permission.

                               Acknowledgement

I would like to thank Professor Joshua Hug for his guidance within the past
few years. I would also like to thank Professor John DeNero and Professor
Joseph Gonzalez for giving me the opportunity to teach in their courses. In
addition, I want to thank Suraj Rampure, Ethan Shang, and all my other
fellow course staff members for making my time at Berkeley so much more
enjoyable. Finally, I want to thank my family for their endless support
throughout my entire life.
Pedagogy and Infrastructure for Upper-Division Data Science Courses

                                      by Allen Shen

                                   Research Project

Submitted to the Department of Electrical Engineering and Computer Sciences,
University of California at Berkeley, in partial satisfaction of the requirements for the
degree of Master of Science, Plan II.

Approval for the Report and Comprehensive Examination:

                                        Committee:

                                   Professor Joshua Hug
                                     Research Advisor

                                      14-May-2021
                                           (Date)

                                        *******

                              Professor Joseph M. Hellerstein
                                      Second Reader

                                           (Date)
Pedagogy and Infrastructure for Upper-Division Data Science Courses

                                 by

                            Allen Shen

          A thesis submitted in partial satisfaction of the

                   requirements for the degree of

                        Masters of Science

                                 in

           Electrical Engineering and Computer Science

                               in the

                         Graduate Division

                               of the

                 University of California, Berkeley

                       Committee in charge:

                   Professor Joshua Hug, Chair
                  Professor Joseph M. Hellerstein

                            Spring 2021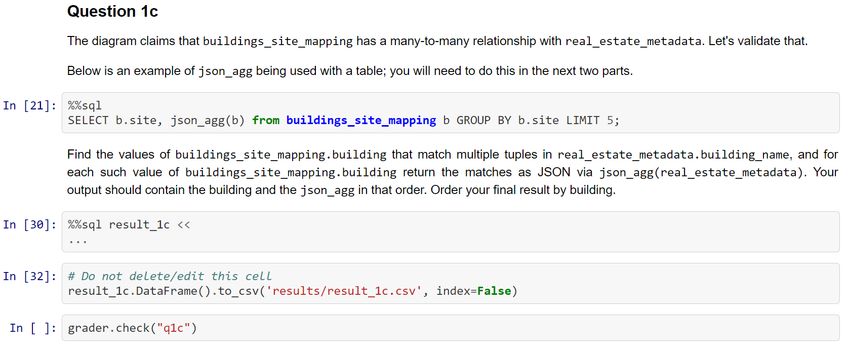
1

                                         Abstract

          Pedagogy and Infrastructure for Upper-Division Data Science Courses

                                            by

                                        Allen Shen

            Masters of Science in Electrical Engineering and Computer Science

                             University of California, Berkeley

                               Professor Joshua Hug, Chair

The quick rise in popularity of data science courses has led to a need to develop scalable
infrastructure to support such courses. The most essential part of this scalable infrastruc-
ture is a scalable grading system that enables instructors to automatically grade student
submissions without requiring them to look at each submission individually for an extended
period of time. In this work, we discuss two autograding systems that help accomplish
this task by providing a means to autograde Jupyter notebook assignments and Java-based
assignments. We expand on the former by highlighting a workflow for distributing and auto-
grading Jupyter notebook assignments via Otter Grader. We then talk about the pedagogy
and infrastructure that enables data systems courses to support hundreds of students, and
we finally discuss tools for learning data visualization with an emphasis on the Lux Jupyter
notebook widget. We hope that this work helps lay the groundwork for the development of
future tools and methods that enable learning at scale for data science courses.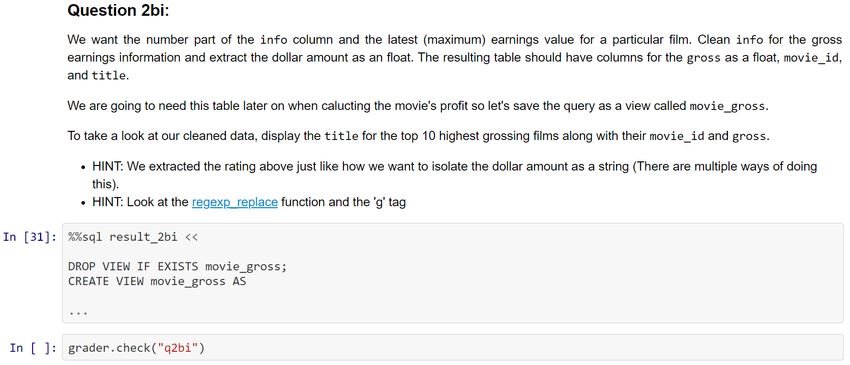
i

To my family and friends.

ii

Contents

Contents                                                                                                                                        ii

1 Introduction                                                                                                                                   1
  1.1 Principles and Techniques of Data         Science             .   .   .   .   .   .   .   .   .   .   .   .   .   .   .   .   .   .   .    1
  1.2 Introduction to Database Systems          . . . . .           .   .   .   .   .   .   .   .   .   .   .   .   .   .   .   .   .   .   .    2
  1.3 Data Engineering . . . . . . . . .        . . . . .           .   .   .   .   .   .   .   .   .   .   .   .   .   .   .   .   .   .   .    3
  1.4 Impact of COVID-19 Pandemic .             . . . . .           .   .   .   .   .   .   .   .   .   .   .   .   .   .   .   .   .   .   .    3

2 Jupyter Notebook Assignments                                                                                                                   5
  2.1 Introduction . . . . . . . . . . .    .   .   .   .   .   .   .   .   .   .   .   .   .   .   .   .   .   .   .   .   .   .   .   .   .    5
  2.2 Related Work . . . . . . . . . .      .   .   .   .   .   .   .   .   .   .   .   .   .   .   .   .   .   .   .   .   .   .   .   .   .    6
  2.3 Autograder Environments . . .         .   .   .   .   .   .   .   .   .   .   .   .   .   .   .   .   .   .   .   .   .   .   .   .   .    8
  2.4 Student Workflow . . . . . . . .      .   .   .   .   .   .   .   .   .   .   .   .   .   .   .   .   .   .   .   .   .   .   .   .   .    8
  2.5 Writing Tests . . . . . . . . . .     .   .   .   .   .   .   .   .   .   .   .   .   .   .   .   .   .   .   .   .   .   .   .   .   .   10
  2.6 Assignment Metadata . . . . . .       .   .   .   .   .   .   .   .   .   .   .   .   .   .   .   .   .   .   .   .   .   .   .   .   .   10
  2.7 Building Assignments . . . . . .      .   .   .   .   .   .   .   .   .   .   .   .   .   .   .   .   .   .   .   .   .   .   .   .   .   12
  2.8 Outcomes . . . . . . . . . . . .      .   .   .   .   .   .   .   .   .   .   .   .   .   .   .   .   .   .   .   .   .   .   .   .   .   12

3 Teaching Data Systems Courses                                                                                                                 14
  3.1 Introduction . . . . . . . . . . . . . . . . . . . . . . . . . . . . . . . . . . . .                                                      14
  3.2 edX to Gradescope . . . . . . . . . . . . . . . . . . . . . . . . . . . . . . . .                                                         14
  3.3 Data Engineering Assignments . . . . . . . . . . . . . . . . . . . . . . . . . .                                                          18

4 Tools for Learning Data Visualization                                                                                                         21
  4.1 Introduction . . . . . . . . . . . . . . .            .   .   .   .   .   .   .   .   .   .   .   .   .   .   .   .   .   .   .   .   .   21
  4.2 Related Work . . . . . . . . . . . . . .              .   .   .   .   .   .   .   .   .   .   .   .   .   .   .   .   .   .   .   .   .   22
  4.3 User Studies . . . . . . . . . . . . . . .            .   .   .   .   .   .   .   .   .   .   .   .   .   .   .   .   .   .   .   .   .   24
  4.4 Conclusions from User Studies . . . . .               .   .   .   .   .   .   .   .   .   .   .   .   .   .   .   .   .   .   .   .   .   25
  4.5 Future Work . . . . . . . . . . . . . . .             .   .   .   .   .   .   .   .   .   .   .   .   .   .   .   .   .   .   .   .   .   27

5 Conclusion                                                                                                                                    28

Bibliography                                                                                                                                    29

iii

                                 Acknowledgments
I would like to thank Professor Joshua Hug for his guidance within the past few years. I
would also like to thank Professor John DeNero and Professor Joseph Gonzalez for giving me
the opportunity to teach in their courses. In addition, I want to thank Suraj Rampure, Ethan
Shang, and all my other fellow course staff members for making my time at Berkeley so much
more enjoyable. Finally, I want to thank my family for their endless support throughout my
entire life.
1

Chapter 1

Introduction

Data science has exploded in popularity in recent years due to the advance of new data-
intensive systems [49] and the development of novel techniques for machine learning [5].
Following the footsteps of many other universities, data science became an undergraduate
major at UC Berkeley in 2018 [44]. Since then, it has quickly become the fastest-growing
major on campus, and its size now rivals the size of the computer science major [33].
    In this thesis, we will focus on the pedagogy and infrastructure required to support
three upper-division data science courses at UC Berkeley: Principles and Techniques of
Data Science, Introduction to Database Systems, and Data Engineering. These courses
are intended for junior and senior level undergraduate students, but graduate students are
welcome to take them as well. Prior work has explored how courses similar to these could
be incorporated in the curriculum for a data science program [1] [42] [2].
    First, Chapter 2 goes over a workflow for distributing and autograding assignments in
data science courses. Next, Chapter 3 talks about the pedagogy and infrastructure in data
systems courses. Finally, Chapter 4 discusses tools for learning data visualization.

1.1     Principles and Techniques of Data Science
Principles and Techniques of Data Science (Data 100) [40] is an intermediate data science
course at UC Berkeley. The course follows an introductory data science course called Foun-
dations of Data Science (Data 8) [14], and it assumes a background of Data 8, introductory
programming, linear algebra, and calculus. Course enrollment exceeded 1000 students per
semester in recent fall/spring iterations.
    Recent iterations of Data 100 have been divided into roughly three portions. In the
first section of the course, students learn how to use practical data science tools for data
manipulation and data visualization. These tools include but are not limited to SQL, pandas,
and seaborn. The second portion of the course covers theoretical concepts behind common
machine learning techniques including linear regression, logistic regression, and gradient
CHAPTER 1. INTRODUCTION                                                                     2

descent. The third and final segment of the course covers other techniques in machine
learning such as decision trees, PCA, and k-means clustering.

        Figure 1.1: A Data 100 lecture web page from the Summer 2020 semester.

1.2     Introduction to Database Systems
Introduction to Database Systems (CS 186) [23] is an introductory course on the internals
of modern database systems including but not limited to topics such as SQL, B+ Trees,
query optimization, transactions, and recovery. It assumes a background of introductory
programming, data structures, and a first course on computer architecture. Enrollment in
the course has recently hovered at around 600 students per fall/spring semester.
    In recent semesters, the course was offered in an online format (CS W186) with pre-
recorded lectures and in-person discussion sections. Although lectures were given asyn-
chronously, students were still expected to keep to a schedule of two lectures a week in order
to keep pace with assignments.
CHAPTER 1. INTRODUCTION 3 1.3 Data Engineering Data Engineering (CS 194-35/Info 290T-2) [8] is a course that covers the principles and practices of managing data at scale from a user’s perspective. It is not intended to directly replace a traditional database course (i.e. CS 186) even though many topics are similar. The course was first offered in the Spring 2021 semester with a cohort of around 125 undergrad- uate and graduate students, although a precursor to the course was offered exclusively to graduate students in the Spring 2020 semester. Figure 1.2: Topics in CS 194-35/Info 290T-2. Topics in blue are covered in a traditional database course. 1.4 Impact of COVID-19 Pandemic In March 2020, the COVID-19 pandemic forced universities across the world to transition to remote instruction [30]. UC Berkeley announced that most courses would be required to transition to a remote format starting March 10, 2020 [6]. As a result, computer science and data science courses were forced to adapt by offering both synchronous and asynchronous modes of instruction. Most of this work was conducted in the midst of the pandemic, during which the aforementioned classes were offered via remote instruction.
CHAPTER 1. INTRODUCTION                                                                   4

    For Data 100 in particular, the instructors wanted to provide a flexible experience for
students regardless of where they were situated [41]. This meant that a purely synchronously
model was not feasible, and both synchronous and asynchronous options needed to be pro-
vided to optimize for remote instruction. Lectures were presented asynchronously as a series
of short pre-recorded videos with a set of conceptual questions following each video. To
supplement lecture content, the instructors offered both pre-recorded and live discussion
sections, in addition to live lab sections.
5
Chapter 2
Jupyter Notebook Assignments
2.1 Introduction
Jupyter notebooks are a widely used tool for data science in industry, research, and educa-
tion. Assignments in the Jupyter format can contain both coding and written/visualization
questions within the same document, making the format particularly well-suited for data
analysis tasks. Data scientists often use Jupyter notebooks because of their interactivity; for
example, notebooks allow users to simultaneously look at data and visualizations generated
from data. Moreover, users can run Jupyter notebook cells out of order, and notebooks
must be run in a particular environment. All of these intricacies make autograding assign-
ments in Jupyter notebooks more challenging compared to autograding assignments in more
traditional file formats (i.e. .java, .py, .cpp, etc.).
As most other courses with autograder infrastructure are not Jupyter-based, they require
specific autograder infrastructure depending on the programming language in use. For Data
100, we have used an autograder system based on Otter Grader [38], which is a Jupyter
notebook autograder system developed by the Data Science Education Program (DSEP) at
UC Berkeley, since the Summer 2020 semester. Otter provides a set of commands for the
development, distribution, and grading of Jupyter notebook assignments. It also generates
PDFs of written questions from notebook assignments; these PDFs can then be used for
manual grading on Gradescope [17], which is a tool for managing and grading course as-
signments. Immediately after autograding is finished, PDF generation can happen in the
same environment as the code autograder, so students do not have to worry about managing
PDFs themselves.
Setup of Otter Grader is relatively straightforward since the package can be installed via
pip. The command pip install otter-grader will install the otter binary so that Otter
Grader can be used from the command line. Further documentation on the installation
process can be found on the Otter Grader documentation website [39].
This chapter will focus on the usage of Otter Grader for assignments in data science
courses. In particular, we will discuss how to develop assignments that are compatible withCHAPTER 2. JUPYTER NOTEBOOK ASSIGNMENTS 6
Otter Grader and Gradescope. This chapter will not go into details regarding how Otter
Grader is implemented.
Figure 2.1: A Jupyter notebook using Otter Grader.
2.2 Related Work
In this section, we discuss some alternative tools to Otter Grader.
nbgrader
Nbgrader [36] is a similar tool for Jupyter notebook autograding. When we used nbgrader
during the Spring 2018 and Fall 2018 semesters, we found that our assignment workflow
was a bit tedious, so we decided to stop using the tool after the Fall 2018 semester. One
limitation of nbgrader at the time was that it only allowed users to grade one assignment
at a time. We preferred a grading style in which graders were responsible for a small subset
of questions on an assignment rather than for all questions in a subset of all submissions.
This allowed for more consistent grading as one grader would be responsible for a particular
question for all submissions. In addition, the nbgrader interface took a long time to switchCHAPTER 2. JUPYTER NOTEBOOK ASSIGNMENTS 7
between student submissions; this slowdown became very noticeable at a large scale of nearly
a thousand submissions.
Figure 2.2: Example of the nbgrader interface.
okpy
Okpy [37] is an autograding system developed by several current and former students at UC
Berkeley. Although okpy provides an interface for Jupyter notebook autograding, we found
that integrating our custom autograder was more challenging compared to Gradescope due
to more sparse documentation.
Pandas Grader
Pandas Grader [7] is an okpy compatible autograder developed by Simon Mo and William
Huang for Data 100. We used this autograder for the Spring 2019, Summer 2019, Fall 2019,
and Spring 2020 semesters. Pandas Grader is based on Gofer Grader [16], a lightweight
autograder library developed by Vincent Su. Although Pandas Grader allowed us to auto-
grade assignments efficiently, we found that the workflow was too complex, leading to several
autograder errors that were very difficult to debug. Since Pandas Grader was very intricate,
it also required a lot of time to learn and maintain. As a result, we felt that we had a large
knowledge gap when the teaching assistants associated with the tool left Data 100 course
staff.CHAPTER 2. JUPYTER NOTEBOOK ASSIGNMENTS 8
Figure 2.3: Example of okpy usage for Jupyter notebooks.
2.3 Autograder Environments
One challenge with grading Jupyter notebook assignments is maintaining consistency be-
tween the student’s programming environment and the autograder’s environment. In Data
100, we use a JupyterHub [27] server called DataHub [9]. DataHub allows users to complete
their assignments in a single environment that is shared among all users, and it allows us to
use nbgitpuller [35] to distribute assignments to students.
Both nbgrader and Pandas Grader combined with okpy allowed us to run the autograder
in the exact same environment where the students worked since we could run these tools
in the DataHub environment. This helped us maintain consistency between student and
staff results. When we transitioned to Otter Grader, one downside was that we were no
longer able to replicate the exact same environment on Gradescope. As such, we resorted to
using pip freeze to generate a requirements.txt file that contained most of the packages
from the DataHub environment. Nevertheless, we had to remove some packages from the
requirements.txt file because they were not compatible with the Gradescope autograder.
For future work, we recommend using the “Manual Docker Configuration” feature on the
Gradescope autograder to fix the issue of environment replication.
2.4 Student Workflow
In this section, we list some of the assignment submission instructions we provide to students
in Data 100.CHAPTER 2. JUPYTER NOTEBOOK ASSIGNMENTS 9
Figure 2.4: Example output from pip freeze on DataHub.
1. After completing an assignment, navigate to Kernel > Restart & Run All. Make sure
that all public test cases pass locally. Note that it is essential to restart your kernel
before checking if you are passing all the test cases to ensure that your variables do
not have local state such that they pass the tests in your notebook but not on the
autograder. Try not to reuse variable names if possible.
2. Save your notebook under File > Save and Checkpoint. This is a very important step.
If you do not save your notebook, then you might run into issues with the downloaded
.zip file.
3. Run the very last cell in your notebook, which generates a .zip file for you to download
to your local machine. Download the .zip file, which contains all of the necessary
components of your submission.
4. Upload this .zip to the correct assignment on Gradescope.
5. A while after submitting, the autograder built-in to the Gradescope assignment will
tell you which public test cases you have passed and failed. Any test cases you have
failed will be marked in red, along with output of which test case you failed.
• The public test cases on Gradescope are identical to the ones that you had in
your notebook. If you pass all test cases locally, you should also pass them all on
Gradescope.
• The autograder on Gradescope will extract the PDF of your notebook and man-
ually grade it for assignments that require PDF generation. No action is required
on your part here.CHAPTER 2. JUPYTER NOTEBOOK ASSIGNMENTS 10
• There are hidden test cases which are not visible when you submit. When we
release grades, you will see your autograded scores (with both public and hidden
tests) and written scores on Gradescope under two separate assignments.
Figure 2.5: Example of a student submission cell with Otter.
2.5 Writing Tests
Tests follow the jassign format [24]. Developed by John DeNero at UC Berkeley, jassign is
a package used for the purpose of authoring and distributing Jupyter notebook assignments.
Otter Grader also has its own test format, but backwards compatibility with jassign allowed
us to transition seamlessly between Pandas Grader and Otter Grader.
2.6 Assignment Metadata
For the first cell of the notebook, we use the following metadata. This cell will get removed
for the student version of the assignment.
BEGIN ASSIGNMENT
files:
- file1
- file2
generate:
pdfs:
course_id: xxxxxx
assignment_id: yyyyyy
show_hidden: true
requirements: requirements.txt
overwrite_requirements: true
run_tests: false
In the rest of this section, we describe these flags in more detail.CHAPTER 2. JUPYTER NOTEBOOK ASSIGNMENTS 11
Figure 2.6: An example question following the jassign format.
• files: This is a list of supporting files required for the assignment. All file paths
should go from the assignment notebook directory.
• course id and assignment id: These come from the Gradescope URL of the PDF
assignment. The first set of numbers is the course id, and the second set of numbers
is the assignment id.
• show hidden: Setting this to true will make it so that results for hidden tests will be
released to students after grades are published on Gradescope.
• requirements: This should correspond to the requirements.txt file for the Grade-
scope autograding container. The path is relative to the notebook directory.
• overwrite requirements: Setting this to true will replace the default
requirements.txt file given by Otter.
• run tests: We set this to false so that all tests are not run when building the
assignment.CHAPTER 2. JUPYTER NOTEBOOK ASSIGNMENTS 12
2.7 Building Assignments
We create a Gradescope autograder assignment for every assignment, and we create a Grade-
scope PDF assignment for each assignment that requires PDF generation. To generate the
autograder and student versions of an assignment, we run the otter assign command af-
ter running all of the cells of the assignment notebook. For assignments that require PDF
generation, this step requires authentication with a Gradescope account so that Otter can
generate a token to upload to the Gradescope PDF assignment. After generating the auto-
grader and student versions of an assignment, we test the assignment on DataHub with the
following the steps:
• We make sure that PDF generation works and that the generated PDF includes all
questions that need to be manually graded.
• We run all tests on the autograder version of the notebook to check that they all pass.
• We ensure that the student version of the notebook does not include any solutions or
hidden tests.
After building the assignment, we download the autograder.zip file generated by Otter
and upload the file to the corresponding programming assignment on Gradescope. Then, we
make sure that the autograder version of the assignment passes all the tests on Gradescope.
2.8 Outcomes
A benefit of Otter is that it allows students to see their scores for public tests shortly after
they submit an assignment. Previously, students had to wait weeks and sometimes months
before they could see their grades for an assignment. Under the old system, students would
run a cell that submits their assignment to okpy or nbgrader, but this process would not
grade their assignment.
Another benefit of the Otter integration with Gradescope is that students submit all
assignments and see all of their grades on Gradescope, removing the need to look at multiple
platforms to see their grades. Previously, we had to compile grades on both okpy and
Gradescope, which led to a lot of overhead with merging grades between the two sources.
After our move to Otter Grader, students often commented that they appreciated seeing all
of their grades in one location.
On the staff side, providing prompt feedback has reduced the autograding overhead, and
we have to deal with much fewer autograder regrade requests as a result. We are also able to
find and fix autograder bugs earlier in the assignment development process. Furthermore, we
believe that Otter is much easier to learn and use compared to our old autograding systems.
We do not feel like there is a large learning gap with Otter because many members of our
course staff were able to learn the intricacies of Otter without many issues.CHAPTER 2. JUPYTER NOTEBOOK ASSIGNMENTS 13 Unfortunately, Gradescope does not currently provide an easy way to generate overall grades using grades from individual assignments. We would recommend exploring Total Course Points [43] as a potential solution to this problem; this is what UC Berkeley’s CS 61C: Great Ideas in Computer Architecture (Machine Structures) uses for reporting overall grades. As an alternative solution, many other Berkeley computer science courses generate a PDF grade report describing the overall grade breakdown for each individual student on Gradescope.
14

Chapter 3

Teaching Data Systems Courses

3.1     Introduction
Teaching data systems courses such as CS 186 (Introduction to Database Systems) and CS
194-35/Info 290T-2 (Data Engineering) to hundreds of students requires scalable infrastruc-
ture to support each individual student without causing too much of a burden to instructors.
Developing such infrastructure takes a lot of time and is sometimes not worth the effort for
smaller courses. For larger courses, autograders are often used to handle hundreds of student
submissions at the same time so that instructors do not have to look at each submission in-
dividually. For data systems courses in particular, assignments require students to use many
different types of programming languages and tools, each of which requires its own unique
autograder.
    Recent iterations of CS 186 contain assignments in three different programming lan-
guages: SQL, Java, and the MongoDB Query Language (MQL) [34]. There is one project
in SQL and one project in MQL which serve to give students practice with querying data
in those languages. In addition, the course contains a larger Java project, which is split up
into four distinct projects. In these four projects, the student is required to implement parts
of a relational database management system (i.e. B+ Trees, Joins and Query Optimization,
Concurrency, and Recovery).

3.2     edX to Gradescope
Prior to and including the Spring 2020 semester, lecture content for CS W186 (the online ver-
sion of CS 186) was delivered via edX [12], a massive open online course (MOOC) provider.
Although an autograder system was developed to support the course projects on edX, exams
(whether in person or online) needed to appear on Gradescope, so students had to look at
both edX and Gradescope for course grades. In the Fall 2020 and Spring 2021 semesters,
both the lecture content and the autograder was transferred to Gradescope, ensuring that all
graded assignments appeared on Gradescope instead of being split across multiple platforms.
CHAPTER 3. TEACHING DATA SYSTEMS COURSES 15
This in turn made Gradescope the single source of truth for all course grades. If they wanted,
an instructor could decide to use edX for lecture content and Gradescope for grading infras-
tructure instead of using Gradescope for both. In other words, the same sustainable grading
infrastructure could be used regardless of which platform was used for lecture content.
Figure 3.1: A module from the edX version of CS W186.
Before CS 186 made the transition from edX to Gradescope, several other UC Berke-
ley courses had made the same transition, including but not limited to CS 61C (Machine
Structures), CS 169 (Software Engineering), and CS 188 (Introduction to Artificial Intelli-
gence). For CS 61C and CS 188 respectively, Stephan Kaminsky and Aditya Baradwaj have
developed a script that converts from edX’s online assignment format to Gradescope’s online
assignment format [13].CHAPTER 3. TEACHING DATA SYSTEMS COURSES 16
Figure 3.2: A part of a module from the Gradescope version of CS W186.
Java Autograders on Gradescope
Currently, the CS 186 course staff uses GitHub Classroom to distribute projects to students,
and students submit their projects to Gradescope via GitHub. The autograder for Java
assignments is based on the java-mvn [18] autograder sample from Gradescope. As such,
it uses the jh61b [26] library developed by Josh Hug for CS 61B (Data Structures) at UC
Berkeley. This library uses a JUnit Listener framework to run user-annotated JUnit test
cases and to output results in the format required for Gradescope. A popular alternative to
jh61b is jgrade [25].CHAPTER 3. TEACHING DATA SYSTEMS COURSES 17
Figure 3.3: A few JUnit test cases using the jh61b library.
The custom CS 186 Gradescope autograder provides the following features on top of the
java-mvn autograder sample:
• Post-processing of results to show students whether their code successfully compiled
and whether their submission contains all of the necessary files.
• Structure that allows the course staff to pick which project to run the autograder on
by changing a single line of code.
• Custom configuration of overall point values and automatic calculation of how many
points each test case is worth using the total number of test cases.
Future work on the autograder involves the following:
• A deeper dive into security. Prior work has shown that students can hack the auto-
grader by exploiting the structure of the Gradescope autograder system [19] [45].
• Additional functionality for rate limiting student submissions and for pulling the au-
tograder directly from a private GitHub repository.CHAPTER 3. TEACHING DATA SYSTEMS COURSES 18
• Allowing the autograder to run a strict subset of the test cases corresponding to a class
(instead of all test cases).
Feedback
Students found CS 186 more organized following the transition from edX to Gradescope.
On a mid-semester survey, students were asked how organized they felt the course was
relative to other Berkeley upper division courses on a scale from 1 (least organized) to 5
(most organized). For the Spring 2020 semester (pre-Gradescope transition), the average
organization rating was 3.9057 with standard deviation of 1.0062. On the other hand, the
average organization rating was 4.0482 with a standard deviation of 0.9954 for the Fall 2020
semester (post-Gradescope transition).
Course staff also found the Gradescope autograder easier to understand because of the
excellent documentation that Gradescope provides for its autograding system. Gradescope
also abstracts away the complexity of Docker containers, so users do not have to have intricate
knowledge of Docker to build and maintain an autograder.
3.3 Data Engineering Assignments
The assignments for the Spring 2021 offering of Data Engineering consisted of 5 projects and
5 multivitamins. Multivitamins were short written assignments designed to keep students on
schedule and to check for basic understanding of concepts from lecture while projects were
longer assignments that gave students hands-on practice with the data engineering tools
they were learning in lecture. For the first 4 projects, we required students to use DataHub
similar to Data 100. For the fifth and final project, we allowed students to work either locally
or on DataHub.
SQL
The first three projects used the ipython-sql [11] package in conjunction with a PostgreSQL
database server on DataHub. These projects differed from traditional SQL assignments
because students needed to perform data manipulation tasks using SQL instead of simply
querying data from the database. As such, students needed a more intricate understanding
of SQL, and they had to learn more SQL constructs than a typical database course would
teach.
The first project required students to use SQL to process data from the IMDB database
[22]. Although there were lots of simple query-based tasks in this project, we also in-
cluded multiple questions that required the use of more sophisticated SQL constructs such as
REGEXP REPLACE. Although most of our students had prior experience with SQL, the project
helped serve as an introductory project for those who did not.CHAPTER 3. TEACHING DATA SYSTEMS COURSES 19
In the second project, students explored how database management systems optimize
query execution and how users can further tune the performance of their queries. The project
worked with Lahman’s Baseball Database [29], an open source collection of baseball statistics
from 1871 to 2020 with batting statistics, team statistics, managerial records, Hall of Fame
records, etc. Students used the EXPLAIN ANALYZE command to analyze query performance,
and they came up with ways to improve their queries using the information outputted from
the command.
The third project served as a successor to the first project. In this project, we used one
month of data from sensors in buildings at UC Berkeley. Notably, this dataset was extremely
messy, and students needed to clean the dataset using techniques such as outlier detection,
entity resolution, and linear interpolation in SQL.
Figure 3.4: An example question from Project 1 involving data manipulation.
MongoDB
Our fourth project went over semi-structured JSON data with a focus on MongoDB, a
database system that stores data in a construct known as documents. We used the Yelp
Academic Dataset [48], which contains a dataset of businesses, reviews, and users. Our goal
with this project was to teach students what MongoDB can (and cannot) do with respect
to its documents and to compare and contrast MongoDB with other data representation
formats such as the relational model and the DataFrame model. Similar to the first three
projects, we included questions that involved data manipulation in MongoDB in addition to
simpler querying tasks.CHAPTER 3. TEACHING DATA SYSTEMS COURSES 20
Data Build Tool
Our fifth and final project used the data build tool (dbt) [10]. This was a fairly open-ended
project that allowed students to have the flexibility of exploring their own datasets and to
build their own data pipelines.
Grading
Similar to Data 100, we used Otter Grader to autograde the first four projects. The fifth
project was graded manually by the course staff. Notably, we could not follow the same steps
as described in the previous chapter because the DataHub PostgreSQL server and MongoDB
server were not present in the Gradescope autograder environment. Instead of attempting
to replicate these servers on Gradescope, we resorted to an alternative method that involved
converting SQL relations to pandas DataFrames, which would then be written to CSV files.
Students would submit these CSV files to Gradescope, and our tests would use pandas to
read and grade these CSV files. This was not an ideal solution because students’ SQL code
would not be run on the autograder; however, it allowed us to write local tests without
worrying about any post-processing overhead on the autograder end. We also needed to tell
students to use ORDER BY and LIMIT in their SQL queries so that their output would be small
and deterministic. For the MongoDB project, we also resorted to pickle for serialization
because some of the MongoDB objects could not be easily converted to CSV files. For future
work, we definitely recommend finding a way to replicate the database servers on Gradescope
with the least amount of overhead so that student queries could be run on different relations
in the autograder environment.
Figure 3.5: An example of the grading workflow for a question on Project 3.21
Chapter 4
Tools for Learning Data Visualization
4.1 Introduction
Data visualization is one of the most essential elements in data scientist’s toolkit, and it is a
topic that is covered extensively in many data science courses. In recent offerings of Data 100,
two entire lectures have been devoted to data visualization principles and tools. Although
the course primarily uses Python tools such as matplotlib and seaborn to generate data
visualizations, it alludes to other popular alternatives such as plotly and altair.
Lux [31] is a data visualization project which is implemented as a Jupyter notebook
extension; the extension allows users to quickly visualize pandas DataFrames by graphing
interesting distributions, correlations, and trends. In response to feedback from previous
users who stated that they wanted greater control over the visualization process, we seek to
find ways to generate code that users are then able to use to modify existing Lux visualiza-
tions.
Our proposed solution is a to code function for Lux visualization objects. Although
Lux currently has a to Altair function to retrieve the altair code corresponding to a
visualization, this code is very specific to a certain visualization, and there is not a lot of
room for customization. We aim to produce generated code that would allow users to make
modifications from the DataFrame level, to adjust values presented in the visualization, and
to customize cosmetic features such as font, color, axes labels, etc.
By providing accompanying documentation to our generated code, we also hope that
our function will help enable students to learn data visualization packages for the first time.
Generally, students find that matplotlib and seaborn are easier to learn compared to the
plotly and altair; however, all four packages have their own intricacies and nuances. Expe-
rienced users of these packages can easily write code to generate their desired visualizations;
however, novice users often have trouble writing code from scratch. With our function, novice
users can first understand how different parts of code can affect the outputted visualization
before generating entire visualizations without any skeleton code.CHAPTER 4. TOOLS FOR LEARNING DATA VISUALIZATION 22
Figure 4.1: The Lux Jupyter notebook widget.
4.2 Related Work
Prior need finding work has shown that programming languages are essential in creating
abstractions for the data visualization process [32]. One participant in a prior study stated
the following:
Once you have made a visualization [using programming tools], if you want to
tweak things about it, you can. Just put what you do into a script, add some
parameters, and you could repeatedly get the same visualization with variations...
It will generate the thing automatically, you don’t have to create a whole picture
by hand again.
Other need finding has shown that users are frustrated with data visualization tools in
computational notebook environments [4]. Users often need to change small bits of code
to tailor visualizations to their needs, and data scientists frequently export code to redo
exploratory data analysis outside of their computational notebook. Lux provides a way for
users to export visualizations (with the “download” button), and our proposed tool provides
flexibility for users to tweak code to generate their desired visualizations.
There has also been a lot of ongoing research to make data visualization tools more
accessible to users. B2 [46] is a data visualization tool developed by Wu, Hellerstein, and
Satyanarayan at UC Berkeley and MIT CSAIL. The tool attempts to bridge the gap between
code and interactive data visualization in computational notebooks by providing data visu-
alizations corresponding to pandas DataFrames. While B2 is extremely instructional with
an interactive widget directing users to which parts of code to modify in order to changeCHAPTER 4. TOOLS FOR LEARNING DATA VISUALIZATION 23
features of a graph, it is too complex of a system to integrate with Lux, which aims to let
users visualize many relationships at once.
Figure 4.2: Interactive visualizations and code generation in B2.
Penrose [47] provides a domain-specific language (DSL) for visualization based on math-
ematical concepts. In Penrose, visual representations are user-defined in a constraint-based
specification language, and diagrams are generated automatically via constrained numerical
optimization. Visualizations in Penrose are more abstract in nature, so they are not very
pertinent to Lux. However, we found the DSL useful for the purpose of describing pertinent
aspects of mathematical objects.
Pylustrator is a Python package that allows users to create figures for publications in a
reproducible manner [15]. The package provides an interactive interface that allows users to
tweak visualizations, and it shows users the code corresponding to their changes. The plot
editor in MATLAB also behaves in a similar way to Pylustrator as it provides a “Show-M-
Code” function that gives users the code corresponding to the visualization they generated
in the plot editor. Both of these tools are limited in scope and do not work for the altair
visualization package.
We were also influenced by the nbgather project [20], which extracts the code that gener-
ates a visualization in a Jupyter notebook. In this project, Head, et al. use program slicing
to find the appropriate notebook cells from a Jupyter notebook that may be executed out
of order. They benefit from the execution order which helps generate an execution log from
which a parse tree can be constructed. This use case contrasts from ours as the code we
are trying to generate exists across a multitude of files as opposed to an execution log of a
Jupyter notebook. It would be difficult for us to construct a similar log and to determine
which lines should be included in a slice.CHAPTER 4. TOOLS FOR LEARNING DATA VISUALIZATION 24
Figure 4.3: Penrose’s DSL.
4.3 User Studies
We made a prototype of our suggested to code function using program tracing techniques.
Then, we tested our prototype of our to code function on four users to determine the
usefulness of the function. All four participants were familiar with pandas and matplotlib,
but they had no prior experience with Lux and altair.
We prepared a short tutorial notebook to introduce our participants to some of Lux’s
features and its primary use case as a widget that provides potential data visualizations
associated with pandas DataFrames. In addition, the tutorial describes how to create desired
visualizations on-demand using the Lux Vis object, and it introduces the user to our to code
function for the purpose of tweaking existing visualizations.
For all our user studies, we chose to use MyBinder [3], which turns Git repositories into
interactive Jupyter notebooks by building a Docker image of the corresponding repository.
MyBinder helped ensure that all participants in our user study had access to the exact same
environment while they were interacting with our prepared Jupyter notebook.
After completing the tutorial, we told our participants to complete two short tasks, which
consisted of changing the figure size (Task 1) and y-axis label (Task 2) of a plot. Owing to
prior work [28], we alternated between which task was given first among the participants in
our user study. Users were allowed to use whatever resources they wanted for both tasks
except for the to code function, which was given to the user after they completed one of the
two tasks.
For evaluative purposes, we timed how long users took to complete each of the two tasks
with a maximum of 5 minutes per task, and we asked users to explain their thought process
as they worked through the tasks [21]. At the end of the user study, participants completedCHAPTER 4. TOOLS FOR LEARNING DATA VISUALIZATION 25
Figure 4.4: The process of code gathering in nbgather.
a short survey, which contained the following questions:
• How reliable was the generated code (on a scale of 1 to 4)?
• How trustworthy was the generated code (on a scale of 1 to 4)?
• Would this feature of providing the code for a visualization created using Lux fit well
into your workflow with data visualization in Jupyter notebooks? (Yes or No)
• Overall, is this feature of providing the code for a visualization created using Lux useful
for you? (Yes or No)
4.4 Conclusions from User Studies
Before obtaining access to the to code function, none of our participants completed the first
task within the allocated 5 minutes. After our intervention, participants finished the second
task in 1 minute and 43 seconds on average. For the first task, users often referred to official
documentation and examples through Google and Stack Overflow. Corroborating with prior
work [50], two of our four users tried to find similarities between the APIs of matplotlib
and altair by attempting to recreate the altair plot in matplotlib.CHAPTER 4. TOOLS FOR LEARNING DATA VISUALIZATION 26
Figure 4.5: Example output from our suggested to code function.
First Task Completion Time Second Task Completion Time
DNF 1:20
DNF 1:01
DNF 2:06
DNF 2:25
Table 4.1: User completion times for tasks. DNF means that the user did not finish in the
allotted 5 minute time frame. 1:20 indicates 1 minute and 20 seconds. The first task was
given before our intervention, and the second task was given after our intervention.
All four participants stated that our intervention would work well with their current
data visualization workflow in Jupyter notebooks while three of the four users claimed that
the feature of providing code for a visualization would be useful for them. Although users
generally found that the generated code was reliable and trustworthy, they were not able to
completely parse the large amount of unfamiliar code, and they wanted to know the purpose
of each line of code. Nevertheless, all of our participants successfully tweaked altair code
despite having no prior experience with the package.CHAPTER 4. TOOLS FOR LEARNING DATA VISUALIZATION 27
Reliability Trustworthiness
3 3
4 4
3 4
4 4
Table 4.2: Reliability and trustworthiness of generated code on a scale from 1 to 4.
4.5 Future Work
Based on user feedback, we would like to find ways to provide accompanying documentation
for any generated code. We would also like to implement some sort of accuracy testing for
our function so that we could test that the generated code correctly produces all of the
visualizations produced by Lux. The concrete implementation of our suggested to code
function beyond our initial prototype would require additional work in program tracing, and
more work would be needed to extend Lux to other plotting libraries such as matplotlib.
Last but not least, we hope to incorporate this tool in an educational setting in the future
to see if it helps students learn to program with an unfamiliar data visualization package.28 Chapter 5 Conclusion In this work, we examined the pedagogy and infrastructure required to support three upper- division data science courses at UC Berkeley. We discussed how Berkeley data science courses use Otter Grader to distribute and autograde Jupyter-based assignments, and we described how courses use the jh61b library in conjunction with Gradescope to autograde Java-based assignments. For a new data engineering course, we highlighted five projects that emphasize data manipulation tasks over data querying tasks, and for the Lux data visualization widget, we conducted a user study to determine the usefulness of a to code function that allows users to view, edit, and extend existing data visualizations. We hope that this work serves as the foundation for future work that augments learning in data science courses.
29

Bibliography

 [1] Genevera I. Allen. “Experiential Learning in Data Science: Developing an Interdisci-
     plinary, Client-Sponsored Capstone Program”. In: Proceedings of the 52nd ACM Tech-
     nical Symposium on Computer Science Education. SIGCSE ’21. Virtual Event, USA:
     Association for Computing Machinery, 2021, pp. 516–522. isbn: 9781450380621. doi:
     10.1145/3408877.3432536. url: https://doi.org/10.1145/3408877.3432536.
 [2] Ismail Bile Hassan et al. “Data Science Curriculum Design: A Case Study”. In: Proceed-
     ings of the 52nd ACM Technical Symposium on Computer Science Education. SIGCSE
     ’21. Virtual Event, USA: Association for Computing Machinery, 2021, pp. 529–534.
     isbn: 9781450380621. doi: 10.1145/3408877.3432443. url: https://doi.org/10.
     1145/3408877.3432443.
 [3] Binder. 2021. url: https://mybinder.org/.
 [4] Souti Chattopadhyay et al. “What’s Wrong with Computational Notebooks? Pain
     Points, Needs, and Design Opportunities”. In: Proceedings of the 2020 CHI Conference
     on Human Factors in Computing Systems. CHI ’20. Honolulu, HI, USA: Association for
     Computing Machinery, 2020, pp. 1–12. isbn: 9781450367080. doi: 10.1145/3313831.
     3376729. url: https://doi.org/10.1145/3313831.3376729.
 [5] Tianqi Chen and Carlos Guestrin. “XGBoost: A Scalable Tree Boosting System”.
     In: Proceedings of the 22nd ACM SIGKDD International Conference on Knowledge
     Discovery and Data Mining. KDD ’16. San Francisco, California, USA: Association
     for Computing Machinery, 2016, pp. 785–794. isbn: 9781450342322. doi: 10.1145/
     2939672.2939785. url: https://doi.org/10.1145/2939672.2939785.
 [6] Carol Christ. As coronavirus spreads, UC Berkeley suspends in-person instruction.
     2020. url: https://news.berkeley.edu/2020/03/09/as-coronavirus-spreads-
     uc-berkeley-suspends-in-person-instruction/.
 [7] Data 100 Autograder. 2020. url: https://github.com/DS-100/Pandas-Grader.
 [8] Data Engineering. 2021. url: https://cal-data-eng.github.io/.
 [9] DataHub. 2021. url: https://datahub.berkeley.edu/.
[10] dbt. 2021. url: https://www.getdbt.com/.
[11] Catherine Devlin. ipython-sql. 2021. url: https://github.com/catherinedevlin/
     ipython-sql.
BIBLIOGRAPHY 30
[12] edX. 2021. url: https://www.edx.org/.
[13] edX-to-gradescope. 2020. url: https://github.com/AdityaB97/edX-to-gradescope.
[14] Foundations of Data Science. 2021. url: http://data8.org/.
[15] R. Gerum. “pylustrator: code generation for reproducible figures for publication”. In:
Journal of Open Source Software (2020).
[16] Gofer Grader. 2019. url: https://github.com/data-8/Gofer-Grader.
[17] Gradescope. 2021. url: https://www.gradescope.com/.
[18] Gradescope Java+Maven Autograder Example. 2021. url: https : / / gradescope -
autograders.readthedocs.io/en/latest/java-mvn/.
[19] Steven Hao et al. Security Analysis of Gradescope. 2016. url: http : / / courses .
csail.mit.edu/6.857/2016/files/20.pdf.
[20] Andrew Head et al. “Managing Messes in Computational Notebooks”. In: Proceed-
ings of the 2019 CHI Conference on Human Factors in Computing Systems. CHI ’19.
Glasgow, Scotland Uk: Association for Computing Machinery, 2019, pp. 1–12. isbn:
9781450359702. doi: 10.1145/3290605.3300500. url: https://doi.org/10.1145/
3290605.3300500.
[21] Karen Holtzblatt and Hugh Beyer. Contextual Design: Defining Customer-Centered
Systems. Chap. Principles of Contextual Inquiry.
[22] IMDb. 2021. url: https://www.imdb.com/.
[23] Introduction to Database Systems. 2021. url: https://cs186berkeley.net/.
[24] jassign: Jupyter Notebook Assignments. 2019. url: https : / / github . com / okpy /
jassign.
[25] JGrade. 2020. url: https://github.com/tkutcher/jgrade.
[26] jh61b. 2019. url: https://github.com/ucsb-gradescope-tools/jh61b.
[27] JupyterHub. 2021. url: https://jupyter.org/hub.
[28] Amy J. Ko, Thomas D. LaToza, and Margaret M. Burnett. “A Practical Guide to
Controlled Experiments of Software Engineering Tools with Human Participants”. In:
Empirical Software Engineering (2013), pp. 110–141.
[29] Sean Lahman. Download Lahman’s Baseball Database. 2020. url: http : / / www .
seanlahman.com/baseball-archive/statistics/.
[30] Eric Levenson, Chris Boyette, and Janine Mack. Colleges and universities across the
US are canceling in-person classes due to coronavirus. 2020. url: https://www.cnn.
com/2020/03/09/us/coronavirus-university-college-classes/index.html.
[31] Lux: A Python API for Intelligent Visual Discovery. 2021. url: https://github.
com/lux-org/lux.BIBLIOGRAPHY 31
[32] Dor Ma’ayan et al. “How Domain Experts Create Conceptual Diagrams and Implica-
tions for Tool Design”. In: Proceedings of the 2020 CHI Conference on Human Factors
in Computing Systems. CHI ’20. Honolulu, HI, USA: Association for Computing Ma-
chinery, 2020, pp. 1–14. isbn: 9781450367080. doi: 10.1145/3313831.3376253. url:
https://doi.org/10.1145/3313831.3376253.
[33] Kara Manke. Largest gift in Berkeley’s History will seed hub for data science. 2020.
url: https://data.berkeley.edu/news/largest-gift-berkeley%5C%E2%5C%80%
5C%99s-history-will-seed-hub-data-science.
[34] MongoDB. 2021. url: https://www.mongodb.com/.
[35] nbgitpuller. 2021. url: https://github.com/jupyterhub/nbgitpuller.
[36] nbgrader. 2021. url: https://github.com/jupyter/nbgrader.
[37] OK. 2021. url: https://okpy.org/.
[38] Otter-Grader. 2021. url: https://github.com/ucbds-infra/otter-grader.
[39] Otter-Grader Documentation. 2021. url: https://otter-grader.readthedocs.io/
en/latest/.
[40] Principles and Techniques of Data Science. 2021. url: http://ds100.org/.
[41] Suraj Rampure, Allen Shen, and Josh Hug. “Experiences Teaching a Large Upper-
Division Data Science Course Remotely”. In: Proceedings of the 52nd ACM Technical
Symposium on Computer Science Education. SIGCSE ’21. Virtual Event, USA: As-
sociation for Computing Machinery, 2021, pp. 523–528. isbn: 9781450380621. doi:
10.1145/3408877.3432561. url: https://doi.org/10.1145/3408877.3432561.
[42] Mariam Salloum et al. “Developing an Interdisciplinary Data Science Program”. In:
Proceedings of the 52nd ACM Technical Symposium on Computer Science Educa-
tion. SIGCSE ’21. Virtual Event, USA: Association for Computing Machinery, 2021,
pp. 509–515. isbn: 9781450380621. doi: 10 . 1145 / 3408877 . 3432454. url: https :
//doi.org/10.1145/3408877.3432454.
[43] Total Course Points. 2021. url: https://total-course-points.readthedocs.io/
en/latest/.
[44] UC Berkeley’s Data Science Major Takes Off. 2018. url: https://data.berkeley.
edu/news/uc-berkeleys-data-science-major-takes.
[45] Hanbang Wang. Hacking Gradescope Autograder. 2019. url: https : / / www . seas .
upenn.edu/~hanbangw/blog/hack-gs/.
[46] Yifan Wu, Joseph M. Hellerstein, and Arvind Satyanarayan. “B2: Bridging Code and
Interactive Visualization in Computational Notebooks”. In: Proceedings of the 33rd
Annual ACM Symposium on User Interface Software and Technology. UIST ’20. Vir-
tual Event, USA: Association for Computing Machinery, 2020, pp. 152–165. isbn:
9781450375146. doi: 10.1145/3379337.3415851. url: https://doi.org/10.1145/
3379337.3415851.BIBLIOGRAPHY 32
[47] Katherine Ye et al. “Penrose: From Mathematical Notation to Beautiful Diagrams”.
In: ACM Trans. Graph. 39.4 (July 2020). issn: 0730-0301. doi: 10.1145/3386569.
3392375. url: https://doi.org/10.1145/3386569.3392375.
[48] Yelp Open Dataset. 2021. url: https://www.yelp.com/dataset.
[49] Matei Zaharia et al. “Spark: Cluster Computing with Working Sets”. In: Proceedings
of the 2nd USENIX Conference on Hot Topics in Cloud Computing. HotCloud’10.
Boston, MA: USENIX Association, 2010, p. 10.
[50] Tianyi Zhang et al. “Enabling Data-Driven API Design with Community Usage Data:
A Need-Finding Study”. In: Proceedings of the 2020 CHI Conference on Human Fac-
tors in Computing Systems. CHI ’20. Honolulu, HI, USA: Association for Computing
Machinery, 2020, pp. 1–13. isbn: 9781450367080. doi: 10.1145/3313831.3376382.
url: https://doi.org/10.1145/3313831.3376382.You can also read