Performance evaluation of titanium oxide deposited by electrophoresis in photoelectrodes of dye-sensitized solar cells
←
→
Page content transcription
If your browser does not render page correctly, please read the page content below
ISSN 1517-7076 artigos e12951, 2021

Performance evaluation of titanium oxide
deposited by electrophoresis in
photoelectrodes of dye-sensitized solar cells

                                                       Antonio Paulo Santos Souza 1, Natália Macêdo Cavalcante 2,
                                                    Francisco Nivaldo Aguiar Freire 2, Ana Fabíola Leite Almeida 2

1
  Department of Engineering and Materials Science, Ceara Federal University - UFC, Avenue Humberto Monte-Pici,
Block 729, CEP: 60455-900, Fortaleza, Ceara, Brazil.
2
  LAFFER - Thin Films Laboratory in Renewable Energy, Mechanics Engineering Department, Ceara Federal University
- UFC, Avenue Humberto Monte-Pici, Block 715, CEP: 60455-900, Fortaleza, Ceara, Brazil.
e-mail: antonio.souza@fisica.ufc.br, nataliacav@gmail.com, nivaldo@ufc.br, anfaleal@yahoo.com.br

ABSTRACT
Nanoparticles of TiO2 have been the main semiconductor applied in Dye-sensitized solar cells (DSSCs). In
this work, solar cells were developed from the electrophoretic deposition of anatase titanium dioxide (TiO 2)
films on conductive glasses. The electrophoretic deposition was perfomed with a constant voltage of 80V for
2 minutes and, after drying, the films were sintered at three different temperatures: 450 °C, 550 °C and 600
°C. In the assembly of the cells, the titanium dioxide films were sensitized by Ruthenizer 535-bisTBA dye
(N719) and an electrolyte containing the iodide / tri-iodide redox pair and a commercial transparent platinum
counter electrode were used. TiO2 films were characterized by scanning electron microscopy, dispersive en-
ergy spectroscopy and X-ray diffraction and photo-electrochemical techniques. The energy conversion rates
were 0.2646% for the sintered film at 450 °C, 0.1209% for the sintered film at 550 °C and 0.1137% for the
film sintered at 600 °C.
Keywords: Dye-sensitized solar cells. Electrophoresis. Titanium dioxide. Film. Mesoporous. Photoanode.

1. INTRODUCTION
The crystalline titanium dioxide (TiO2), which is a semiconductor with energy gap in the ultraviolet region
[1-3], owns excellent optical and electrical properties and to this day is vastly studied for numerous applica-
tions such as pigment [4], photocatalysis [5], gas sensor [6], sunscreen [7] and dye-sensitized solar cell
(DSSC) [8] due to its unique optoelectronic features. Dye-sensitized solar cells are considered one of the
most promising of the new generation of cells, due to the low cost of manufacture compared to silicon cells,
and their development is in continuous progress [9]. These cells are conventionally build with a nanoporous
layer of a semiconductor material of large gap, usually TiO2 [7], ZnO [10, 11] or SnO2 [12], covered by a
layer of photoexcited dye, generally the dyes with Ruthenium (II) poly pyridine complex. [13, 14] The work
electrode is connected to a counter electrode of catalytic material (Platinum, gold or activated coal) through
an electrolyte with a iodide/triiodide redox pair (usually 3I-/I3-) which holds good stability and reversibility.
[15, 16] Highly porous layers of titanium dioxide can be produced by a number of techniques such as doctor
blade [10], electrospinning [17], sputtering [18], micro-plasma oxidation [19] and electrophoretic deposition
[8]. Because of the combinations of the high versatility of its use with different materials and cost-
effectiveness, the electrophoretic deposition (EPD) technique, with a wide range of novel applications in the
processing of advanced ceramic materials and coatings, has recently gained increasing interest in academia
and industrial sector. [20, 21] In EPD, charged powder particles, dispersed or suspended in a liquid medium
are attracted and deposited onto a conductive substrate of opposite charge under the application of a DC elec-
tric field.[22, 21] In EPD, charged powder particles, dispersed or suspended in a liquid medium are attracted
and deposited onto a conductive substrate of opposite charge under application of a DC electric field. [22, 21]
     Given the above, the present work aims to evaluate the performance of solar cells sensitized by the dye
N719, which use a TiO2 film, deposited by the electrophoresis technique and treated with different sintering
temperatures, as the photoanode. Measurement of the crystalline structure of the films by X-ray diffraction
simultaneously with the calcination process. In addition: to characterize the semiconductor oxide films by

    Autor Responsável: Antonio Paulo Santos Souza     Data de envio: 20/05/2020    Data de aceite: 30/09/2020

    10.1590/S1517-707620210001.1251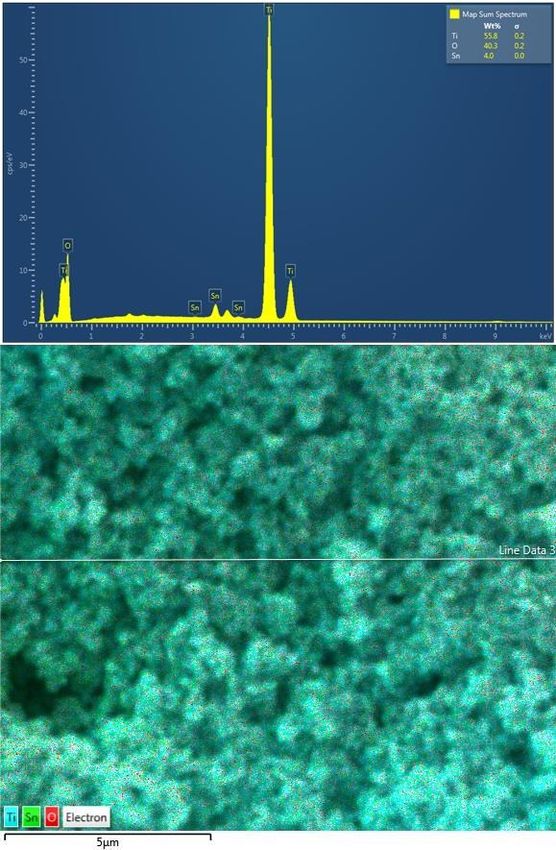
SOUZA, A.P.S.; CAVALCANTE, N.M.C.; FREIRE, F.N.A. et al., revista Matéria, v.26, n.1, 2021

means of Scanning Electron Microscopy (SEM); Dispersive Energy Spectroscopy (EDS) and current-voltage
(J-V) density plots.

2. MATERIALS AND METHODS
All chemicals (reagent grade: Sigma-Aldrich, Dynamics and Vetec) were used as received, without further
purification processes. All solutions were prepared with deionized water.

2.1 Preparation of the electrodes with TiO2
The method for the preparation of the electrodes with commercial TiO 2 nanoparticles is known [8, 23-25].
Initially, a larger area of the FTO surface received the TiO 2 nanoparticles by the electrophoretic process. Fol-
lowing, from this area, it was limited an effective area, which, would be, afterwards, used on the fabrication
of the studied devices.

2.2 Equipment and experimental techniques
2.2.1 Scanning Electron Microscopy (SEM) and Energy-dispersive x-ray spectroscopy (EDS)
The SEM and EDS measures were done by the scanning electron microscope (Inspect S50 – FEI) with an
EDS detector connected. The measurement conditions were: working distance (WD) of 11.7 mm and accel-
erating voltage of 20 kV.

2.2.3 X-Ray Diffraction (XRD)
X-ray diffraction measures for phase identification were performed on a Bruker D8 Advance device, with
CoKα1 (λ = 0.1789 nm) as the radiation source and using a voltage of 40kV, a current of 40mA and an angu-
lar variation of 20°-75°. A thermal chamber was attached to this equipment so that the measurements could
be monitored simultaneously with the gradual increase in temperature.

2.2.4 Photoelectrochemical characterization of the solar cells.
For all the assembled DSSCs, electric measurements were made by two electrodes potentiostat using 100
mW/cm2 light source of Led white-neutral. The electrical parameters and current-voltage (JSC - VOC) density
curves, in addition to the parasitic resistances, were obtained based on the circuit model proposed by VI-
TALL et al. [26] in order to obtain the efficiencies of the cells. All data of the curves (J-V) are shown in Ta-
ble 5.
      All the measurements were performed to environment temperature on a dye-sensitized solar cell, using
the N719 dye, supplied by Solaronix. The light source was a triple LED array driven by the output current of
400mA of the Autolab LED Driver. The output of the LED Driver is controlled by the DAC164 of the Au-
tolab, directly from the software. All the measurements were carried out with the NOVA software. The cells
were fixed to distance 13 cm of the light source.

2.2.5 Electrophoretic Deposition
All the films holding the nanostructures were deposited in a conductive glass (FTO- SOLEMS®) [27] with
resistance varying between 50.0 –70.0 Ω/cm2. The substrates were previously cleaned using the following
solvents: deionized water, acetone and isopropyl alcohol, in this sequence. The conductive substrates were
kept immersed for 15 minutes on ultrasonic bath, for each solvent.
      For the deposition of the TiO2 film on the glass substrate with FTO, an electrophoresis source with a
maximum voltage of 300 V and a maximum current of 700 mA of the Kasvi brand was used. A suspension
was prepared containing 0.04 g of TiO2 anatase from the Sigma-Aldrich® brand dispersed in a solution con-
taining 10 ml of acetone and 30 ml of isopropyl alcohol. Then, a solution was prepared with 0.18 g of resub-
limated iodine and 50 ml of acetone. The suspension and solution were mixed and subjected to magnetic stir-
ring and ultrasonic vibration for 20 minutes.
     Equation 1 shows that the reaction of iodine with acetone has hydrogen ions as one of the products and,
according to SOUZA et al. (2018) [15], the presence of H+ ions increases the conductivity of the suspension.
SOUZA, A.P.S.; CAVALCANTE, N.M.C.; FREIRE, F.N.A. et al., revista Matéria, v.26, n.1, 2021

CH3−CO−CH3 (aq) + 2I2 (aq) ↔ ICH2−CO−CH2I + 2H+ (aq) + 2I- (aq)                                                  (1)

      The positive electrode used the conductive glass with FTO mentioned above and the counter electrode
used a commercial platinum substrate with a distance of 3 cm between them. Electrophoretic deposition was
carried out with a constant voltage of 80V for 2 minutes. Figure 1 shows the process illustration for the elec-
trophoresis deposition. At the end of the deposition, drying was carried out at 100 °C. After this procedure,
the TiO2 films were sintered at three different temperatures: 450 °C, 550 °C and 600 °C, with a heating rise
of 30 °C/ min. Therefore, the samples remained at the respective temperatures for a period of 30 minutes.
      Several studies have shown that the sintering temperature for an optimal degree of crystallinity of the
TiO2 film deposited on FTO is around 450 ° C. This optimal pattern of crystallinity is associated with greater
efficiency of dye-sensitized solar cells. [28-31]
    The samples containing a TiO2 anatase film sintered at different temperatures were called sample 450,
sample 550 and sample 650 for the sintering temperatures of 450 °C, 550 °C and 600 °C respectively (Table
1).

Table 1: Samples of TiO2 anatase films sintered at different temperatures.
           SAMPLE 450                               SAMPLE 550                                SAMPLE 600
         Sintered at 450 °C                      Sintered at 550 °C                         Sintered at 600 °C

Figure 1: Illustration of the electrophoretic deposition.

Lastly, the deposited films by electrophoresis were used as photoanodes of dye-sensitized solar cells as de-
tailed as follows.

2.2.6 Assemble of the dye sensitized solar cells
After thermal treatment, the samples with the TiO2 nanostructures also were under ethanol solution (3x10⁻⁴
mol L-1) of the “Ruthenizer 535-bisTBA” (N719) [32] dye for 24 hours. After, the films were washed in eth-
anol to extract the dye concentrated in the surface, due to an incomplete adsorption. After drying at room
temperature, the electrodes were placed in touch through a commercial [32] redox pair electrolyte (io-
dide/triiodide) with an counter electrode [32] also commercial containing a thin platinum layer deposited on
FTO. The commercial selant [32] was used to avoid the leaking of the electrolyte from the cell.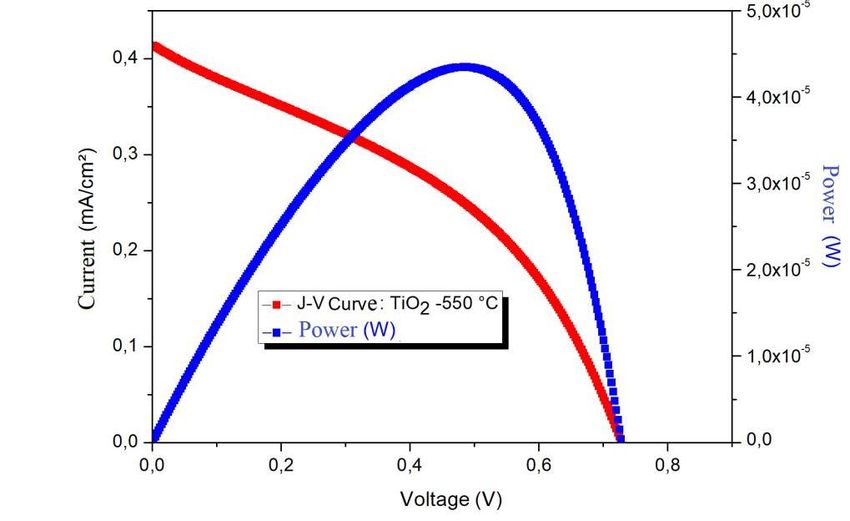
SOUZA, A.P.S.; CAVALCANTE, N.M.C.; FREIRE, F.N.A. et al., revista Matéria, v.26, n.1, 2021

3 RESULTS AND DISCUSSION

3.1 Morphological analysis with MEV/EDS
TiO2 films were analyzed morphologically using the scanning electron microscopy technique.
       Figure 2 shows the surface morphology of TiO2 films with heat treatment of 450 °C (A), 550 °C (B) and
600 °C (C). It is possible to observe that the samples have similar crystalline surfaces, with the presence of
pores. The film with a sintering temperature of 450 °C appears to be more porous than the other two films.
       ZOUHI et al. [33] mathematically analyzed the effect of TiO2 porosity in a DSSC and concluded that an
increase in porosity favors the capture of light that occurs in the working electrode and, consequently, the
generation of photoexcited electrons. However, if the porosity of the film is very high, it will result in a de-
crease of the light absorption coefficient due to the decrease in the area available for the adsorption of the
dye.

Figure 2: SEM images of TiO2 film surfaces for sintering temperature of 450 °C (A), 550 °C (B) and 600 °C (C).

       In order to avoid the formation of cracks on the surface of the films at the end of the electrophoretic
deposition process, a hot air gun was used to evaporate the excess solvent. It was observed that the solvent
evaporated rapidly at a temperature of 100 °C. According to SOUZA [34], cracks cause a discontinuity of the
film resulting in a reduction in conductivity.
       Dispersive energy spectroscopy offers information on the relative proportions of the elements found in
the analyzed area. Therefore, (SEM) scanned film areas of each sample generated spectroscopies and images
of the mapping areas, as shown in Figures 3, 4 and 5, corresponding to samples 450, 550 and 600 respective-
ly.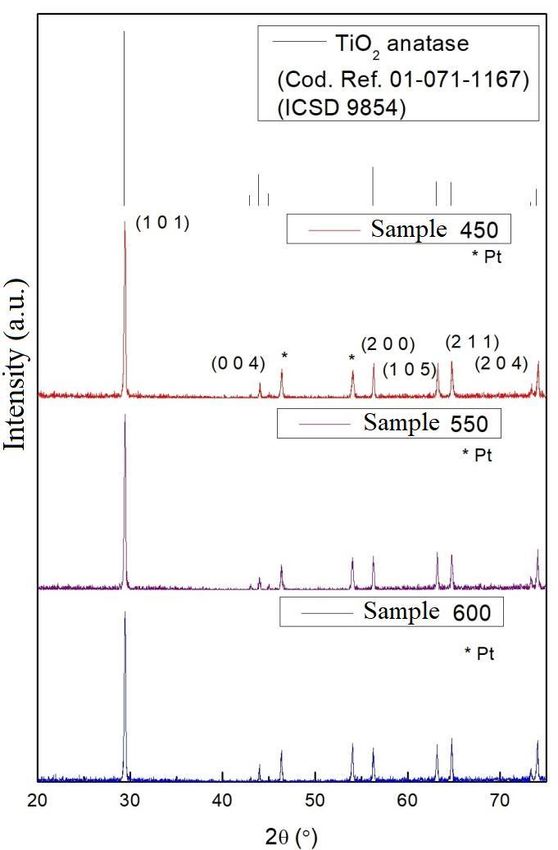
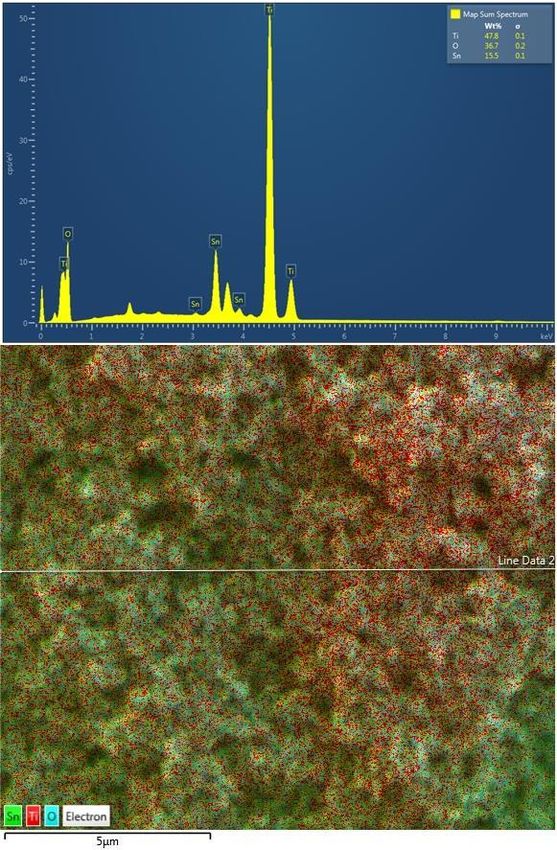
SOUZA, A.P.S.; CAVALCANTE, N.M.C.; FREIRE, F.N.A. et al., revista Matéria, v.26, n.1, 2021

Figure 3: EDS from sample 450 with the respective mapping area.

Figure 4: EDS of sample 550 with the respective mapping area.
SOUZA, A.P.S.; CAVALCANTE, N.M.C.; FREIRE, F.N.A. et al., revista Matéria, v.26, n.1, 2021

Figure 5: EDS of sample 600 with the respective mapping area.

      For sample 450 the mass ratio of titanium (Ti) is 56.5%, 55.8% for sample 550 and 47.8% for sample
600. These values confirm the deposition of the TiO2 film by electrophoresis on the substrate of FTO. The
spectra confirm, in addition to titanium, the presence of oxygen (O) and tin (Sn), the latter being due to the
substrate used in the deposition. These results reveal that in the three samples there was no identification of
impurities present in the film.
      The reduction in titanium percentages as the sintering temperature increases may indicate that the areas
mapped in samples 550 and 600 have irregularities in the film. As a consequence,the thicknesses of the films
in these regions are smaller, which makes it possible to identify elements of Sn and O present in the sub-
strate.

3.2 X-ray diffraction analysis (XRD)
The XRD results for samples 450, 550 and 600 are shown in Figure 6. As the same materials were used for
all samples, the peak intensities for the TiO2 diffractogram are similar and observed in the crystallographic
directions (101), (004), (200), (105), (211) and (204) which, according to HOSSAIN et al. [35], indicate the
anatase phase. This measurement showed that the electrophoresis deposition method and the thermal treat-
ment did not alter the crystalline structure of the material, maintaining its most active phase (anatase). This is
due to the fact that the minimum temperature for the transition from anatase to rutile phase is between 700 °C
- 900 °C according to FAZLI et al. [36].
      In order to avoid fusing the FTO substrate to the sample holder, it was necessary to deposit a TiO 2 film
on a platinum substrate. Thus, in the XRD results (Figure 6) peaks of tin oxide are not observed as it is nor-
mally found in films deposited on FTO. The platinum peaks identified with the (*) were obtained due to the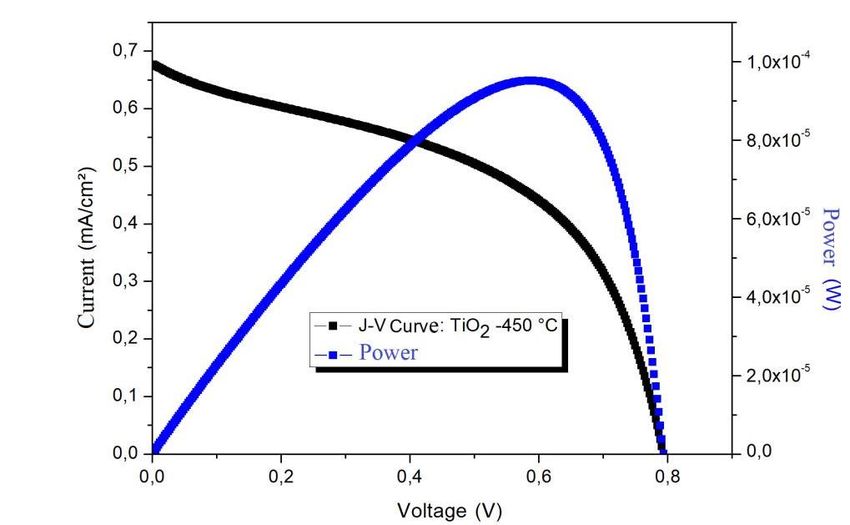
SOUZA, A.P.S.; CAVALCANTE, N.M.C.; FREIRE, F.N.A. et al., revista Matéria, v.26, n.1, 2021

substrate used. It is worth noting that only in the X-ray diffraction measurement a different substrate was
used, in the other characterization techniques the substrate used was glass with FTO.

Figure 6: X-ray diffractograms of TiO2 samples.

       The crystallographic directions of the TiO2 peaks and the platinum peaks, described in sample 450, are
also similar in the other samples. This happens because there are no significant structural changes during heat
treatment.
       The crystallite size of the films can be calculated from the equation of Debye-Scherrer [35] given by:

                                                                                                                     (2)

       Where L is the size of the crystallite in nm, K is the Scherrer constant, λ is the wavelength of the ra-
diation used, β is the width at half height of the diffraction peak (FWHM) in radians and θ is the Bragg angle
in radians. The parameters FWHM and θ can be obtained from the XRD data of the peaks and the values of
0.9 and 0.1789 nm are used for K and λ respectively.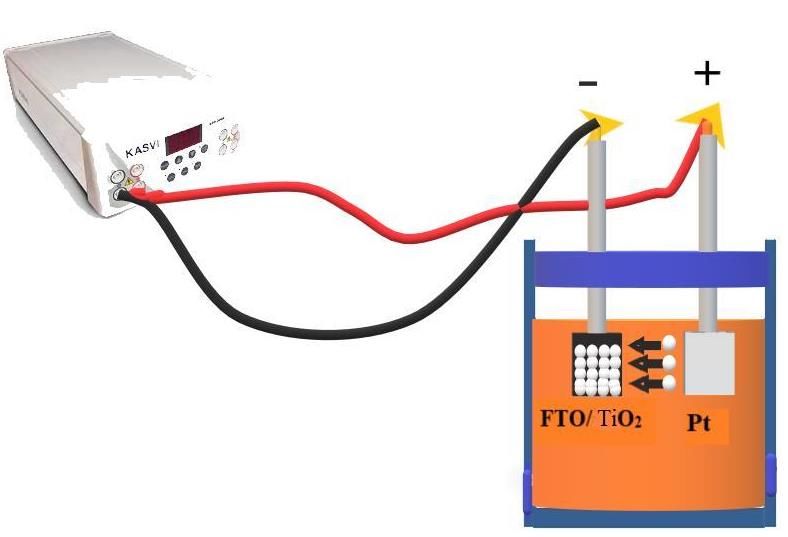
SOUZA, A.P.S.; CAVALCANTE, N.M.C.; FREIRE, F.N.A. et al., revista Matéria, v.26, n.1, 2021

       To obtain the values of 2θ and FWHM, the software X'Pert Higschore Plus was used, where it was
possible to open the data file obtained from the DRX. In the software it is possible to obtain the list of peaks
with the parameter values. The parameters and crystallite size of the peaks of each sample are summarized in
Tables 2, 3 and 4.

 Table 2: Parameters FWHM, θ and crystallite size of sample 450, sintered at 450 °C
        PEAKS                       2Θ (°)                             FWHM (°)                              L (NM)
         (101)                     29.4558                                0.1872                              50.95
         (004)                     44.0315                                0.2496                              39.87
         (200)                     56.3365                                0.1872                              55.90
         (105)                     63.2887                                0.1872                              57.89
         (211)                     64.7503                                0.1560                              70.02
         (204)                     74.1301                                0.1872                              61.76

 Table 3: Parameters FWHM, θ and size of crystallites in sample 550, sintered at 550 °C
        PEAKS                       2Θ (°)                              FWHM (°)                              L (NM)

         (101)                     29.4484                                0.1872                              50.95
         (004)                     43.9975                                0.2496                              39.86
         (200)                     56.2450                                0.1848                              56.60
         (105)                     63,2072                                0.1560                              69.43
         (211)                     64.7503                                0.1872                              58.35
         (204)                     74.0667                                0.1560                              74.08

 Table 4: FWHM, θ and crystallite size parameters of sample 600, sintered at 600 °C
        PEAKS                       2Θ (°)                            FWHM (°)                               L (NM)
         (101)                     29,5001                                0.1248                              76.44
         (004)                     43.9917                                0.1872                              53.15
         (200)                     56.2396                                0.2496                              41.91
         (105)                     63.1920                                0.1872                              57.86
         (211)                     64.7431                                0.2184                              50.01
         (204)                     74.0396                                0.1560                              74.07

     Tables 2, 3 and 4 show that some peaks suffered a small reduction in θ with the increase in the sintering
temperature, which is not possible to observe visually in the results of the diffractograms. The crystallite siz-
es of sample 450 vary between 39.87 nm and 70.02 nm, of sample 550 vary between 39.86 nm and 74.08 nm
and sample 600 vary between 41.91nm and 76.44nm. Thus, the sintering temperature of the films slightly
influences the size of the crystallites and consequently the surface area of the TiO2 films.
     The size of the crystallites of the film increases slightly with the increase in the sintering temperature
[37] causing a decrease in the surface area of the film [15].
SOUZA, A.P.S.; CAVALCANTE, N.M.C.; FREIRE, F.N.A. et al., revista Matéria, v.26, n.1, 2021
3.3 Photovoltaic properties of cells
Lastly, all the photovoltaic devices showed in Figures 7, were assembled and characterized following the
procedures on section 2.2.6 and 2.2.4, respectively.
The graphs of the current-voltage density plots are shown in Figures 8, 9 and 10. The photovoltaic pa-
rameters obtained for the three cells were compared and are summarized in Table 5.
Figure 7: Assembled photovoltaic devices.
Figure 8: J-V curve of sample 450.
Figure 9: J-V curve of sample 550.SOUZA, A.P.S.; CAVALCANTE, N.M.C.; FREIRE, F.N.A. et al., revista Matéria, v.26, n.1, 2021
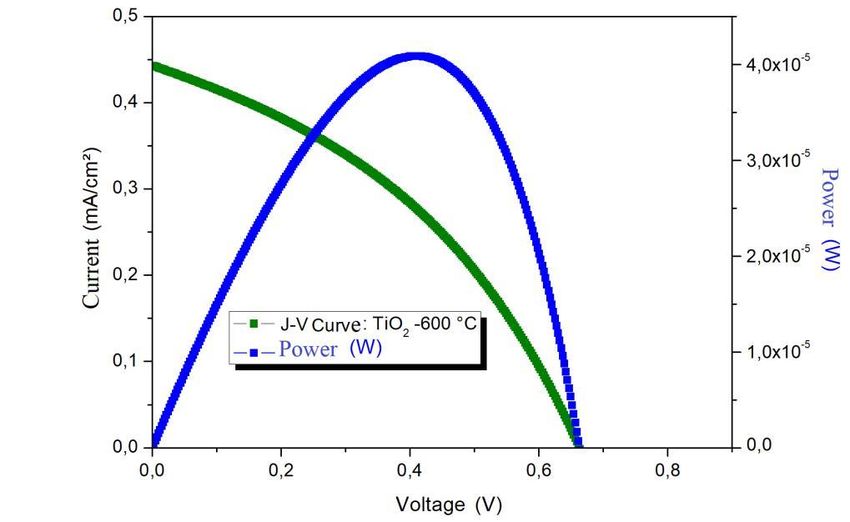
Figura 10: Curva J-V da amostra 600.
The Cells efficiencies with samples 450, 550 and 650 were calculated according to Equation 3. The pa-
rameters RS and RSH correspond to the resistances in series and in parallel, respectively, assigned to the cir-
cuit that models the photovoltaic cells.
(3)
Where, Voc is the open circuit voltage, Jsc is short-circuit current, it is the fill factor and is the
radiation power incident on the cell.
Table 5: Photovoltaic parameters for TiO2 cells.
Cells JSC (mA/cm²) VOC (V) RS (Ω.cm²) RSH (Ω.cm²) FF η (%)
450 0.68 0.79 174.41 2143.93 0.4928 0.27
550 0.41 0.73 530.43 2870.79 0.4016 0.12
650 0.44 0.66 579.57 3592.63 0.3868 0.11
The short circuit current density (JSC) decreased with the increase in the sintering temperature of the
film and the highest value was obtained by the cell that had the highest efficiency. The amount of electrons
generated by the dye determines the current generated. Therefore, the greater the amount of dye adsorbed on
the film, the greater the generation of electrons and consequently the current density will, also, be greater.
[36] Cell with the sample 450 was the one with the highest current density value, indicating that the TiO 2
film sintered at 450 °C possibly obtained the highest amount of adsorbed dye. This result is in accordance
with the values of the calculation of the sizes of crystallites performed previously, which found that sample
450 had a greater surface area and consequently a greater adsorption of dye.
According to NONO [38], the open circuit potential (VOC) depends on the ratio between the amount of
electrons injected into the semiconductor and the amount of electrons that undergo recombination on the
electrode or electrolyte surface. Table 5 shows that for the highest sintering temperature, the lowest V OC val-
ue was obtained, which indicates that in this cell a greater load recombination may have occurred, resulting
in a lower efficiency.SOUZA, A.P.S.; CAVALCANTE, N.M.C.; FREIRE, F.N.A. et al., revista Matéria, v.26, n.1, 2021
The fill factor (FF) decreases as the sintering temperature increases. One of the main factors that influ-
ence the value of the FF is the series resistance (R S) inside the cell that will directly affect the electron trans-
fer process. SOUZA et al. [15], SEQUEIRA [39] and NUNES [40], also observed in their experiments that
solar cells that had higher Rs values, had lower FF values.
The energy conversion efficiencies obtained for the cells were 0.2664% for the cell containing sample
450, 0.1209% for the cell containing sample 550 and 0.1137% for the cell containing sample 600.
According to CHANG et al. [41], the efficiency of the cell is also affected by the uniformity of the film
thickness, and the non-uniformity results in reduced efficiencies due to recombination of charges.
Other studies have also reported dye-sensitized solar cells with efficiencies of less than 1% such as that
made by CHIANG, LEE and HSU [42] and AZIZI et al. [43]. CHIANG, LEE and HSU [42] assembled cells
with titanium dioxide deposited by electrophoresis and doctor blade on ITO substrates and obtained efficien-
cies of 0.0473% and 0.1327%, respectively. AZIZI et al. [43] deposited a TiO2 film by electrophoresis on an
FTO substrate, which underwent heat treatment at 450 ° C. In assembling the cells, different natural dyes
were used and the efficiencies obtained varied between 0.007% and 0.09%.
The low efficiency found in this work was caused by high values of resistance in series (Rs) with reduc-
tion in the conductivity of the cell. This problem can be reduced with the chemical treatment of the films with
TiCl4. The electrical conductivity has been improved at the interfaces between particles in the TiO 2 coating
and between conducting glass and the TiO2 film through TiCl4 treatment. [44-50]
4. CONCLUSIONS
The electrophoresis dispersion and deposition process proved to be a promising technique in the construction
of porous films for application in DSSCs. The XRD analyzes of all samples indicated similarity in the
crystallographic directions that correspond to the anatase phase of TiO2, confirming that the electrophoresis
deposition method and the heat treatment did not alter the crystalline structure of the material. It was verified
through the analysis of XRD data the influence of the sintering temperature on the size of the crystallites,
which suggests that the size of the crystallites increases slightly with the increase of the sintering
temperature. The result of this reduction in the surface area of the film may cause a lesser injection of
electrons for the semiconductor oxide, due to the lower amount of dye adsorbed on the surface of this oxide.
The film sintered at 450 °C showed smaller crystallites, which contributed to increasing the efficiency of this
cell.
SEM analysis revealed that all films had crystalline surfaces with the presence of pores. The film
sintered at 450 °C showed greater porosity compared to the other two. The EDS spectra showed that all films
contained only titanium and oxygen, confirming that the electrophoresis deposition technique was efficient.
There was a reduction in the mass proportions of titanium and an increase in the proportions of tin as the
sintering temperature increased, indicating a possible variation in the thickness of the film.
From the parameters obtained from the current-voltage plots it was possible to calculate the efficiency
of the cells. The cell with TiO2 film sintered at 450 °C presented the highest efficiency value, 0.2664%. This
greater efficiency is due to the fact that the film had larger surface area, which results in greater dye
adsorption and greater electron generation. In order to optimize the photovoltaic capacity of solar cells
sensitized by dyes with TiO2 films deposited by electrophoresis, it is suggested to carry out analyzesSOUZA, A.P.S.; CAVALCANTE, N.M.C.; FREIRE, F.N.A. et al., revista Matéria, v.26, n.1, 2021 involving post-treatment with TiCl4 of the electrophoretically deposited films, in addition to the variation of deposition parameters and sintering temperature. 5. ACKNOWLEDGMENTS The authors would like to acknowledge the Brazilian research agency Coordenação de Aperfeiçoamento de Pessoal de Nível Superior (CAPES) for the financial support, the Laboratório de Filmes Finos e Energias Renováveis- LAFFER for the assistance throughout the research and, also, the Analytical Central-UFC/CT- INFRA/MCTI-SISNANO/Pró-Equipamentos CAPES. 6. BIBLIOGRAPHY [1] JOSE, R., THAVASI, V., “Ramakrishna, Metal oxides for dye-sensitized solar cells”, Jornal of the. American Ceramic Society. v.92, pp. 289-301, 2009. [2] HU, Y., TSAI, H.L., HUANG, C.L., “Effect of brookite phase on the anatase-rutile transition in titania nanoparticles”, Jornal of the European Ceramican. Society. v.23, pp. 691–696, 2003. [3] PAN, H., GU, B., ZHANG, Z. “Phase-dependent photocatalytic ability of TiO2: a first principles study”, Jornal of Chemical Theory and Computation, v.5, pp. 3074-3078, 2009. [4] VIEIRA, F.T.G., MELO, D.S., LIMA, S.J.G., et al., “The influence of temperature on the color of TiO2:Cr pigments”, Materials Research Bulletin, v.44, pp. 1086-1092, 2009. [5] ZHUANG, J., DAI, W., TIAN, Q. et al., “Photocatalytic degradation of RhB over TiO2 bilayer films: effect of defects and their Location”, Langmuir: American Chemical Societ, v.26, pp. 9686–9694, 2010. [6] SEO, M.H., YUASA, M., KIDA, T. et al., “Detection of organic gases using TiO2 nanotube-based gas sensors”, Procedia Chemistry: Jornal, v.1, pp. 192-195, 2009. [7] LABILLI, J., FENG, J., BOTTA, C., et al.,“Aging of TiO2 nanocomposites used in sunscreen Dispersion and fate of the degradation products in aqueous environment”, Environmental. Pollution: Jornal, v.158, pp. 3482-3489, 2010. [8] GRINIS, L., DOR, S., OFIR, A., et al., “Electrophoretic deposition and compression of titania nanoparti- cle films for dye-sensitized solar cells”, Jornal Photochemitry. Photobiology. A: Chem, v.198, pp. 52-59, 2008. [9] HILLHOUSE, H.W., BEARD, M.C. “Solar cells from colloidal nanocrystals: fundamentals, materials, devices, and economics”, Current Opinion in Colloid Interface Sci:Jornal, v.14, pp. 245-259, 2009. [10] CHEN, Z.H., TANG, Y.B., LIU, C.P. et al.,“Vertically aligned ZnO nanorod arrays sentisized with gold nanoparticles for schottky barrier photovoltaic cells”,The Jornal of Physical Chemistry C, v.113, pp. 13433- 13437, 2009. [11] MARTINSON, A.B.F., GOES, M.S., FABREGAT-SANTIAGO, F., et al., “Electron Transport in Dye- Sensitized Solar Cells Based on ZnO Nanotubes: Evidence for Highly Efficient Charge Collection and Ex- ceptionally Rapid Dynamics”, The Jornal of Physical Chemistry A, pp. 4015-4021, v.113, 2009. [12] KAY, A., GRATZEL, M. “Dye-Sensitized Core-Shell Nanocrystals: Improved Efficiency of Mesopo- rous Tin Oxide Electrodes Coated with a Thin Layer of an Insulating Oxide”. Chemistry of Materials, pp. v. 14, 2930-2935, 2002. [13] MENDE, S., BACH, U., BAKER, H., et al., Organic dye for highly efficient solid-state dye-sensitized solar cells. Advanced Materials. v.17, p.813, 2005. [14] CHANG, Y.J., CHOW, T.J. “Highly efficient triarylene conjugated dyes for sensitized solar cells”. Journal of Materials Chemistry. v.21, p.9523, 2011. [15] SOUZA, A.P.S., FERREIRA, O.P., NUNES, V.F., et al.,“Performance Evaluation of Titanate Nanotubes and Nanoribbons Deposited by Electrophoresis in Photoelectrodes of Dye-Sensitized Solar Cells”, Materials Research, [s.l.], v. 21, n. 4, 28 maio 2018. [16] O'REGAN, B., MICHAEL, G.. “A low-cost, high-efficiency solar cell based on dyesensitized colloidal TiO2 films”. Nature, v.353, p.737-740, 1991.
SOUZA, A.P.S.; CAVALCANTE, N.M.C.; FREIRE, F.N.A. et al., revista Matéria, v.26, n.1, 2021

[17] SONG, M.Y., KIM, D.K., JO, S.M. et al., “Enhancement of the photocurrent generation in dye-
sensitized solar cell based on electrospun TiO2 electrode by surfasse Treatment”, Synthstic Metals:Jornal,
v.155, pp. 635-638, 2005.
[18] HOSSAIN, M.F., BISWAS, S., TAKAHASHI, T. et al., “Investigation of
sputter-deposited TiO2 thin film for the fabrication of dye-sensitized solar cells”, Thin Solid Films, v. 516,
pp. 7149-7154, 2008.
[19] WANG, S., WU, X., QIN, W. et al.“TiO2 films prepared by micro-plasma oxidation
method for dye-sensitized solar cell”, Electrochimical Acta, v.53, pp.1883-1889, 2007.
[20] ZHITOMIRSKY, I. “Cathodic electrophoretic deposition of ceramic and organoceramic materials –
fundamental aspects”, Advances in Colloid and Interface Science, v.97, pp.279-317, 2002.
[21] HEAVENS, N. “Electrophoretic deposition as a processing route for ceramics”. In: Binner GP, editor.
Advanced ceramic processing and technology, v. 1, p. 255-83, 1990.
[22] BESRA, L., LIU, M.. “A review on fundamentals and applications of electrophoretic deposition
(EPD)”. Progress in Materials Science. v.52, pp.1-61, 2007.
[23] MOSKALEWICZ, T., CZYRSKA-FILEMONOWICZ, A. Microstructure of nanocrystalline TiO2
films produced by electrophoretic deposition on Ti–6Al–7Nb alloy. Surface and Coatings Technology. v. 21,
pp. 7467-7471, May 2007.
[24] HAMADANIAN, M., JABBARI, V., GRAVAND, A., et al., Band gap engineering of
TiO2 nanostructure-based dye solar cells (DSCs) fabricated via electrophoresis. Surface and Coatings Tech-
nology. v. 206, Issue 22, pp. 4531-4538, 25 June 2012.
[25] KIMURA, T., TAKENAKA, T., FUJITSU, S., et al., Preparation of TiO2 Thin Film for Dye Sensitized
Solar Cell Deposited by Electrophoresis Method. v. 248, pp. 133-136, Aug. 2003.
[26] VITTAL, R., HO KC. “Zinc oxide based dye-sensitized solar cells”: A review. Renewable and Sustaina-
ble Energy Reviews., v.70, pp.920-935, 2017.
[27] SOLEMS L’ÉNERGIE LUMIÉRE®, Transparent conductive oxides (TCO) thin films on glass, FT-
TCO en/ 2015-1, p.1-2. www.solems.com.
[28] LIU, J., LI, Y., ARUMUGAM, S., et al., Investigation of Low Temperature Processed Titanium Dioxide
(TiO2) Films for Printed Dye Sensitized Solar Cells (DSSCs) for Large Area Flexible Applications. Materials
Today: Proceedings. v.5, pp.13846-13854, (2018).
[29] THE-VINH NGUYEN HYUN-CHEOL LEE O-BONG YANG. The effect of pre-thermal treatment of
TiO2 nano-particles on the performances of dye-sensitized solar cells. Materiais de energia solar e células
solares. v. 90, pp. 967-981, may, 2006.
[30] SOUZA, A.P.S, ALMEIDA, A.F.L.,CONEGERO, L.S., et al., Photoelectrodes with titanate nanotubes
sensitized by mesoporphyrin derivative from cashew nut shell. Matéria (Rio J.), ISSN 1517-7076, v.24, n.1.
2019.
[31] ITO, S., TAKEUCHI, T., KATAYAMA, T., et al., Conductive and Transparent Multilayer Films for
Low-Temperature-Sintered Mesoporous TiO2 Electrodes of Dye-Sensitized Solar Cells, Chemistry of Mate-
rials. v.15, n. 14, pp.2824-2828, 2003.
[32] SOLARONIX®, Dye Solar Cells for Real-Innovative Solutions for Solar Professionals.
http://www.solaronix.com/documents/solaronix_materials.pdf, p.8-37, Switzerland, 2012.
[33] ZOUHRI, K., ALSADI, J., FERREIRA, L., et al., “Numerical method of the TiO2 porosity effect on dye
sensitized solar cell exergy efficiency”. Solar Energy, v. 155, p.920-933, out. 2017.
[34] SOUZA, A.P.S. “Produção e Caracterização de Células Solares Fotossensibilizadas por Corante Base-
adas em Filmes Finos de Titanatos e Óxidos Metálicos Nanoestruturados”.Tese de Doutorado-Departamento
de Pós-Graduação em engenharia e Ciência de Materiais-Universidade Federal do Ceará. Fortaleza, 2019.
[35] HOSSAIN, M.K., MOTRUZA, A.A., SEN, S.K., et al., “A comparative study on the influence of pure
anatase and Degussa-P25 TiO2 nanomaterials on the structural and optical properties of dye sensitized solar
cell (DSSC) photoanode”. Optik, v. 171, p.507-516, out. 2018.
[36] FAZLI, F.I.M., AHMAD, M.K., LOGO, C.F., et al.,“Dye-sensitized solar Cell using pure anatase TiO2
annealed at different temperatures”. Optik, v. 140, p.1063-1068, jul. 2017.
SOUZA, A.P.S.; CAVALCANTE, N.M.C.; FREIRE, F.N.A. et al., revista Matéria, v.26, n.1, 2021

[37] ZHOU, M., YU, J., LIU, S., et al., “Effects of calcination temperatures on photocatalytic activity of
SnO2/TiO2 composite films prepared by an EPD method”. Journal of Hazardous Materials, v. 154, n. 1-3,
p.1141-1148, jun. 2008.
[38] NONO, R.S. Preparação de filmes de TiO2 para aplicação em células solares de corante. 2005. 75 f.
Dissertação (Mestrado) - Curso de Química, Departamento de Química Inorgânica, Universidade Estadual de
Campinas, Campinas, 2005.
[39] SEQUEIRA, S.I.H. Células solares sensibilizadas por novos corantes derivados de cumarinas. 2012. 89
f. Dissertação (Mestrado) - Curso de Engenharia da Energia e do Ambiente, Universidade de Lisboa, Lisboa,
2012.
[40] NUNES, V.F. Síntese e caracterização de células solares de ZnO sensibilizadas por corante. 2018. 56 f.
Dissertação (Mestrado) - Curso de Engenharia Mecânica, Universidade Federal do Ceará, Fortaleza, 2018.
[41] CHANG, H., SU, H.T, CHEN, W.A, et al., Fabrication of multilayer TiO2 thin films for dye-sensitized
solar cells with high conversion efficiency by electrophoresis deposition”. Solar Energy, v. 84, n. 1, pp.130-
136, jan. 2010.
[42] CHIANG, W.T., LEE, P.T., HSU, R.Q. “Study on Preparation of Flexible Semiconductor Electrode for
Dye-sensitized Solar Cells by EPD”. Manufacturing Science And Technology, v. 3, n. 4, pp.170-176, dez.
2015.
[43] AZIZI, T., TOUIHRI, A.E., KAROUI, M.B., et al., “Comparative study between dye-synthesized solar
cells prepared by electrophoretic and doctor blade techniques”. Optik, v. 127, n. 10, pp.4400-4404, maio
2016.

[44] SEDGHI, A., MIANKUSHKI, H.N.. “Influence of TiCl4 Treatment on Structure and Performance of
Dye-Sensitized Solar Cells Jpn”. Jornal of Applicated Physical. v.52, p. 075002, 2013.
[45] NATH, N.C.D., SUBRAMANIAN, A., HU, R.Y., et al., “Effects of TiCl4 Post-Treatment on the Effi-
ciency of Dye-Sensitized Solar Cells”. Journal of Nanoscience and Nanotechnology, v. 15, pp. 8870-8875,
2015. doi:10.1166/jnn.2015.11528.
[46] KABIR, F., BHUIYAN, M.H., Md ROBIUL HOSSAIN, et al., “Effect of combination of natural dyes
and post-TiCl4 treatment in improving the photovoltaic performance of dye-sensitized solar cells”. Comptes
Rendus Chimie: Jornal. doi.org/10.1016/j.crci.2019.08.002, v.22, pp. 659-666, Issues 9-10, September-
October 2019.
[47] ADHIKARI, S.G., SHAMSALDEEN, A., ANDERSSON, G.G.. “The effect of TiCl4 treatment on the
performance of dye-sensitized solar cells”. Jornal of Chemistry and Physcal. doi.org/10.1063/1.5125996.
v.151, pp.164704, 2019.
[48] SOMMELING, P.M., O'REGAN, B.C., HASWELL, R.R., et al., “Influence of a TiCl4 Post-Treatment
on Nanocrystalline TiO2 Films in Dye-Sensitized Solar Cells”. Jornal of Physical and Chemistry B,
doi.org/10.1021/jp061346k. v.110, pp.19191-19197, 2006.
[49] MURAKAMI, T.N., MIYADERA, T., FUNAKI, T. et al., “Adjustment of Conduction Band Edge of
Compact TiO2 Layer in Perovskite Solar Cells Through TiCl4 Treatment”. ACS Applied Materi-
als&Interfaces, doi: 10.1021/acsami.7b07496. v.9, pp.36708-36714, 2017.
[50] YAHAV, S., RÜHLE, S., GREENWALD, S., et al., ”Strong Efficiency Enhancement of Dye-Sensitized
Solar Cells Using a La-Modified TiCl4 Treatment of Mesoporous TiO2 Electrodes”. The Journal of Physical
Chemistry C, doi: 10.1021/jp2042679. v.115, pp.21481-21486, 2011.

ORCID
Antonio Paulo Santos Souza                  https://orcid.org/0000-0001-8518-0503
Natália Macêdo Cavalcante                   https://orcid.org/0000-0002-2064-5581
Francisco Nivaldo Aguiar Freire             https://orcid.org/0000-0001-5449-2635
Ana Fabíola Leite Almeida                   https://orcid.org/0000-0002-8867-5453
You can also read