PIER WORKING PAPER 20-011 HUMAN MOBILITY RESTRICTIONS AND THE SPREAD OF THE NOVEL CORONAVIRUS (2019-NCOV) IN CHINA
←
→
Page content transcription
If your browser does not render page correctly, please read the page content below

The Ronald O. Perelman Center for Political
                                                  Science and Economics (PCPSE)
                                                  133 South 36th Street
                                                  Philadelphia, PA 19104-6297
                                                  pier@econ.upenn.edu
                                                  http://economics.sas.upenn.edu/pier

                        PIER Working Paper
                                      20-011

    Human Mobility Restrictions and the
     Spread of the Novel Coronavirus
          (2019-nCoV) in China

   HANMING FANG                    LONG WANG                           YANG YANG
University of Pennsylvania        Shanghai Tech University   The Chinese University of Hong Kong

                                    March 23, 2020

                             https://ssrn.com/abstract=3559382
Human Mobility Restrictions and the Spread of the
          Novel Coronavirus (2019-nCoV) in China†
                 Hanming Fang‡                Long Wang§              Yang Yang¶

                                         March 23, 2020

   †
     We are grateful to Jere Behrman, Xi Chen, Ming Li, Xincheng Qiu, Yao Zeng for useful comments and
suggestions. All remaining errors are our own.
   ‡
     Department of Economics, University of Pennsylvania, Ronald O. Perelman Center for Political Sci-
ence and Economics, 133 S. 36th Street, Philadelphia, PA, United States, 19104; and the NBER. Email:
hanming.fang@econ.upenn.edu.
   §
     School of Entrepreneurship and Management, ShanghaiTech University, 393 Middle Huaxia Road, Shang-
hai, 201210, China. Email: wanglong@shanghaitech.edu.cn.
   ¶
     CUHK Business School, The Chinese University of Hong Kong, 12 Chak Cheung Street, Hong Kong
SAR, China. Email: zoeyang@cuhk.edu.hk.
Human Mobility Restrictions and the Spread of the Novel Coronavirus
                      (2019-nCoV) in China

                                       Abstract

    We quantify the causal impact of human mobility restrictions, particularly the
lockdown of the city of Wuhan on January 23, 2020, on the containment and delay
of the spread of the Novel Coronavirus (2019-nCoV). We employ a set of difference-
in-differences (DID) estimations to disentangle the lockdown effect on human mobil-
ity reductions from other confounding effects including panic effect, virus effect, and
the Spring Festival effect. We find that the lockdown of Wuhan reduced inflow into
Wuhan by 76.64%, outflows from Wuhan by 56.35%, and within-Wuhan movements
by 54.15%. We also estimate the dynamic effects of up to 22 lagged population inflows
from Wuhan and other Hubei cities, the epicenter of the 2019-nCoV outbreak, on the
destination cities’ new infection cases. We find, using simulations with these estimates,
that the lockdown of the city of Wuhan on January 23, 2020 contributed significantly
to reducing the total infection cases outside of Wuhan, even with the social distancing
measures later imposed by other cities. We find that the COVID-19 cases would be
64.81% higher in the 347 Chinese cities outside Hubei province, and 52.64% higher in
the 16 non-Wuhan cities inside Hubei, in the counterfactual world in which the city
of Wuhan were not locked down from January 23, 2020. We also find that there were
substantial undocumented infection cases in the early days of the 2019-nCoV outbreak
in Wuhan and other cities of Hubei province, but over time, the gap between the offi-
cially reported cases and our estimated “actual” cases narrows significantly. We also
find evidence that enhanced social distancing policies in the 63 Chinese cities outside
Hubei province are effective in reducing the impact of population inflows from the epi-
center cities in Hubei province on the spread of 2019-nCoV virus in the destination
cities elsewhere.

Keywords: Human Mobility, Lockdown, Social Distancing, 2019-nCoV, COVID-19,
Disease Outbreak
JEL Codes: I18, I10.
1     Introduction
    Human mobility contributes to the transmission of infectious diseases that pose serious
threats to global health. Indeed, in response to pandemic threats many countries consider
and impose measures that restrict human mobility flows as one of their response plans
(Bajardi et al., 2011; Wang and Taylor, 2016; Charu et al., 2017). However, restrictions
on human mobility are controversial not only because of their negative economic impacts,
but also because of the uncertainty about their effectiveness in controlling the epidemic.
Even if restricting human movement could lead to improvements in disease control and
reductions in health risks, it is empirically challenging to quantify the impact of human
mobility on the spread of infectious diseases, and to understand the detailed spatial patterns
of how the infectious disease spreads. Both granular disease occurrence data and human
mobility data (Charu et al., 2017) are hard to obtain; moreover, it is difficult to disentangle
the impact of human mobility from other potential contributing factors in the spread of
epidemics (Ferguson et al., 2006; Hollingsworth et al., 2006). In this paper, we exploit the
exogenous variations in human mobility created by lockdowns of Chinese cities during the
outbreak of the Novel Coronavirus (2019-nCoV), and utilize a variety of high-quality data
sets, to study the effectiveness of an unprecedented cordon sanitaire of the epicenter of
COVID-19, and provide a comprehensive analysis on the role of human mobility restrictions
in the delaying and the halting of the spread of the COVID-19 pandemic.1
    The fast-moving 2019-nCoV that infected 266,073 people and claimed 11,184 lives as
of March 21, 2020 is deteriorating into one of the worst global pandemics.2 The virus
emerged in the city of Wuhan in the Hubei Province of China in early December of 2019,
spread mainly through person-to-person contact (Chan et al., 2020), and rapidly reached
more than 183 countries as of March 21, 2020.3 Currently, there are no licensed vaccines or
specific therapeutics to combat COVID-19. The lockdown of 11 million people in Wuhan
from January 23, 2020 represents by then the largest quarantine in public health history,
and offers us an opportunity to rigorously examine the effects of the city lockdown and
understand the relationship between human mobility and virus transmission.
    Specifically, this paper studies five research questions. First, how does the lockdown of the
city of Wuhan amid the Novel Coronavirus outbreak affect population movement? Second,
how do population flows among Chinese cities, particularly outflows from Wuhan and other
    1
      Throughout the paper, we use 2019-nCoV as the official name for the Novel Coronavirus according to
the World Health Organization, and use COVID-19 as the name of the disease caused by 2019-nCoV.
    2
      Source: https://www.who.int/emergencies/diseases/novel-coronavirus-2019
    3
      With a population of over 11 million, Wuhan is the largest city in Hubei, the most populous city in
Central China, and the seventh most populous city in China. The city is also a major transportation hub,
with dozens of railways, roads and expressways passing through and connecting to other major cities, and
home to 82 colleges and more than 1 million college students.

                                                   1
cities in Hubei province, affect virus infection in the destination cities? Third, is there
evidence of, and if so, what is the magnitude of, undocumented cases of COVID-19 cases
in Wuhan and other cities in Hubei province during the early stages of the epidemic? And
how does the extent of undocumented infection cases evolve over time? Fourth, how many
COVID-19 cases elsewhere in China were prevented by the unprecedented Wuhan lockdown?
Fifth, are social distancing policies in destination cities effective in reducing the spread of
the infections? We utilize reliable datasets on population migration among pairs of Chinese
cities and the within-city population movements of each city at the daily level from Baidu
Migration, and the city-level daily numbers of confirmed COVID-19 cases, recovered patients,
and death tolls from the Chinese Center for Disease Control and Prevention (CCDC) during
a sample period of January 1-February 29, 2020, covering 22 days before and 38 days after
the city lockdown on January 23, 2020, as well as the matched data from the same lunar
calendar period in 2019.
    We first employ various difference-in-differences (DID) estimation strategies to disen-
tangle the effect of Wuhan lockdown on human mobility reductions from other confounding
effects including panic effect, virus effect, and the Spring Festival effect–the Spring festival of
the Chinese New Year is on January 25, 2020 (Table 2). We find that the lockdown of Wuhan
reduced inflow into Wuhan by 76.64%, outflows from Wuhan by 56.35%, and within-Wuhan
movements by 54.15%. We also estimate the dynamic effects of up to 22 lagged population
inflows from Wuhan and other Hubei cities, the epicenter of the 2019-nCoV outbreak, on the
destination cities’ new infection cases (Figure 4). We discover that the estimated effects of
the different lags of inflows from Wuhan and Hubei both show a clear inverted U -shape with
respect to the lags, with the largest impact on the newly confirm cases today comes from the
inflow population from Wuhan or other cities in Hubei about 12 to 14 days earlier. We find,
using simulations with these estimates, that the lockdown of the city of Wuhan on January
23, 2020 contributed significantly to reducing the total infection cases outside of Wuhan,
even with the social distancing measures later imposed by other cities. We find that the
COVID-19 cases would be 64.81% higher in the 347 Chinese cities outside Hubei province,
and 52.64% higher in 16 non-Wuhan cities inside Hubei, in the counterfactual world in which
the city of Wuhan were not locked down from January 23, 2020. We also find that there
were substantial undocumented infection cases in the early days of the 2019-nCoV outbreak
in Wuhan and other cities of Hubei province, but over time, the gap between the officially
reported cases and our estimated “actual” cases narrows significantly. We also find evidence
that imposing enhanced social distancing policies in the 63 Chinese cities outside Hubei
province is effective in reducing the impact of population inflows from the epicenter cities in
Hubei province on the spread of 2019-nCoV virus in the destination cities elsewhere.
    By providing a rigorous estimation of the impact of within and cross-city migration on

                                                2
the spread of the 2019-nCoV virus in China, our study contributes to fast-growing literature
on 2019-nCoV infection, mostly in the medical and public health fields. Huang et al. (2020)
describe high rates of respiratory distress, intensive care admission, and abnormal findings
on chest computed tomography (CT) in the first 41 patients hospitalized from December
16 to January 2 in Wuhan, as well as a 15% death rate. Chan et al. (2020) investigate
a family cluster and confirm the human-to-human transmission of this Novel Coronavirus
within hospitals and families. The basic reproduction number (R0) for COVID-19 in 12
studies has a mean of 3.28 and a median of 2.79 (Liu et al., 2020) (compared to 3 for SARS
(WTO, 2003)). This study is also related to disaster-induced migration, which has often
occurred during flooding (Gray and Mueller, 2012), drought (Munshi, 2003), earthquake (Lu
et al., 2012), and other destructive climatic phenomena.
    Given that the 2019-nCoV has rapidly spread worldwide due to human travel and caused
severe illness and significant mortality, it is therefore essential to understand the impact of
various control measures on human mobility and the virus transmission. Qiu et al. (2020)
apply machine learning tools and use exogenous temperature, wind speed, and precipitation
in the preceding third and fourth weeks as the instruments to show that the massive lock-
down and other control measures significantly reduced the virus transmission. Their results
highlight that the population outflow from the outbreak source city poses higher risks to
the destination cities than other social and economic factors, such as geographic proximity
and similarity in economic conditions. Our results are also in line with the results of the
latest modeling exercises, which mostly rely on model calibrations of various parameters,
such as generation time, incubation period, detection rates, and changes in travel flow. Us-
ing the Global Epidemic and Mobility model, Chinazzi et al. (2020) project the impact of
travel limitation on the national and international spread of the 2019-nCoV. The study finds
that only 24.4% of infected cases were reported as of February 1, and the Wuhan lockdown
reduced the cases by 10% in cities outside Wuhan by January 31. The study most closely
related to ours is Li et al. (2020), which shows that contagious but undocumented COVID-19
cases facilitated the geographic spread of the epidemic in China. Using a networked dynamic
meta-population model and Bayesian inference, Li et al. (2020) find that 86% of all infec-
tions were undocumented before the Wuhan lockdown and reported infections would have
been reduce by 78.7% in China, without transmission from undocumented cases between
January 10 and January 23. Lai et al. (2020) build a travel network-based susceptible-
exposed-infectious-removed (SEIR) model to simulate the outbreak across cities in mainland
China. They use epidemiological parameters estimated from the early stage of outbreak in
Wuhan to parameterize the transmission before the non-pharmaceutical interventions (NPI)
were implemented. The NPIs they consider include travel bans and restrictions, contact
reductions and social distancing, early case identification and isolation. Through their sim-

                                              3
ulations, they find that the NPIs deployed in China appear to be effectively containing the
COVID-19 outbreak, but the efficacy of the different interventions varied, with the early
case detection and contact reduction being the most effective. Moreover, deploying the NPIs
early is also important to prevent further spread. Relative to our study, it is important to
point out that in their simulations, they assumed that the pattern of population movements
was the same in years when there were no outbreaks and interventions. To the best of our
knowledge, this paper is the first to provide a causal interpretation of the impact of city
lockdown on human mobility and the spread of 2019-nCoV, and to clearly disentangle the
lockdown effects from other potential contributing factors such as panic and virus effect, as
well as the seasonal Spring Festival effect (see Section 3).
    The remainder of the paper is structured as follows. In Section 2, we describe the
data sets used in our analysis. In Section 3, we present different difference-in-difference
estimation strategies to separate the lockdown effect, panic effect, virus (deterrence) effect,
and the Spring Festival effect on population movements in China. In Section 4, we estimate
the distributed lag effects of inflows from the epicenter cities of the 2019-nCoV outbreak
on destination cities’ daily infection cases. In Section 5, we study how the enhanced social
distancing policies, or “lockdown” policies, in the destination cities’ impact the effects of the
population inflows from the epicenter cities. In Section 6, we conclude.

2       Data and Descriptive Statistics
Population Migration Data. We obtain inter-city population migration data from Baidu
Migration, a travel map offered by the largest Chinese search engine, Baidu.4 . The Baidu
Migration data set covers 120,142 pairs of cities per day for 364 Chinese cities between
January 12 and March 12 in 2019, and between January 1 and February 29 in 2020. Note
that, by the lunar calendar, the data covers the same period of 24 days before and 36 days
after the Spring Festivals, respectively for year 2019 and year 2020. The daily inter-city
migration data consist of 2,977,899 city-pair observations each year. In addition, Baidu
provides the daily within-city mobility data for each city in the sample period, which is a
panel consisting of 21,655 city-day level observations each year.
    The Baidu Migration data is based on real-time location records for every smart phone
using the company’s mapping app, and thus can precisely reflect the population movements
between cities.5 For each of the 364 cities, Baidu Migration provides the following informa-
    4
       Baidu Migration uses Baidu Maps Location Based Service (LBS) open platform and Baidu Tianyan to
calculate and analyze the LBS data, and provides visual presentation to show the trajectory and character-
istics of the population migration. Source: http://qianxi.baidu.com/
     5
       Baidu has been the dominant search engine in China because all Google search sites have been banned
in mainland China since 2010.

                                                    4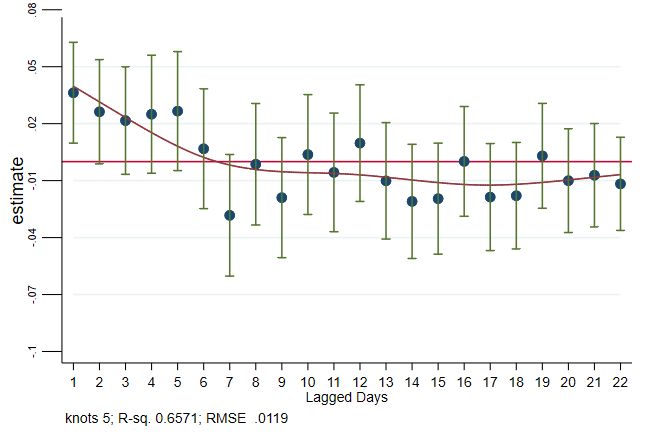
tion: (1). the top 100 origination cities (OC) for the population moving into the city and
the corresponding percentages of inflow population that originated from each of the top 100
OC; (2). the top 100 destination cities (DC) for the population moving out of the city, and
the corresponding percentages of the outflow population that go into each of the top DC. In
the data, the cumulative percentages of the inflow population from the top 100 origination
city, and the cumulative percentages of the outflow population into the top 100 destination
cities, reach 97% per city on average. This ensures that the Baidu Migration data capture
near complete inflows and outflows for each of the 364 cities in the data.
    In addition, the Baidu Migration data provides three migration intensity indicators: the
daily in-migration index (IMI) of a city, the daily out-migration index (OMI) of a city,
and the daily within-city migration index (WCMI). The intensity indicators are consistent
across cities and across time. To convert the index to the number of people, we use the
actual number of inflow population into Shanghai by airplanes, trains and buses/cars, and
the number of within-Shanghai trips using subways, buses and expressways, collected by the
National Earth System Science Data Center for the period of February 6 to February 22,
2020. Using this data, we estimate that one index unit in the IMI and OMI corresponds
to 90,848 person movements, and one index unit in WCMI corresponds to 2,182,264 person
movements. We are thus able to calculate the number of daily inflow and outflow migrants
in each city-pair, as well as the number of within-city population movements.6
    Table 1 presents the summary statistics of the population flows at the city-pair-day level
and city-day level. It shows drastic declines in the average inflows, average outflows, and
average within-city migration in 2020, compared to a sample period in 2019 (matched by
the lunar calendar date). The plummeting of the migration statistics due to the Wuhan
lockdown is also depicted in Figure 2. The three figures on the top show the inflows into
Wuhan, outflows from Wuhan and within-Wuhan flows, for year 2020 (solid line) and year
2019 (dashed line), matched by the lunar calendar; and the bottom shows the corresponding
figures for the national city averages. The first vertical line indicates the date of January
20, 2020 when experts confirmed that 2019-nCoV could transmit from human to human;
and the second vertical line indicates the date of January 23, 2020 when Wuhan was locked
down. It is clear that while the flows in 2020 tracked that of 2019 well until January 20,
the 2020 level dropped to a fraction of their corresponding 2019 levels, particularly after the
lockdown of Wuhan.

                                         [Table 1 About Here]
                                        [Figure 2 About Here]
   6
     It is important to emphasize here that the mobility data is about the movement of people from one city
to another based on geo-location services of the smartphones; as such a person flowing out of city A to city
B is not necessarily a resident of city A, but he/she must have been to city A before moving to city B.

                                                     5
Outbreak Data. COVID-19 daily case counts are collected from China CDC, which pro-
vides daily updates on confirmed, dead, and recovered COVID-19 cases in each city.7 From
January 11 to February 29, 2020, the data covers 77,105 laboratory-confirmed COVID-19
cases, 2,778 death cases, and 39,392 recovered cases in 296 cities in China. Panel B of Table
1 presents the summary statistics of COVID-19 data, and Figure 3 plots the trends of daily
statistics of COVID-19separately for the epicenter city of Wuhan, for other cities in Hubei
Province, and for cities outside of Hubei.8
    There are many possible reasons for us to treat the officially reported numbers of con-
firmed cases in Wuhan and other cities of Hubei with more caution, and to treat them
differently from the data of cities outside of Hubei. As the epicenter of COVID-19, the
health care systems in Wuhan and other cities in Hubei were overwhelmed by the sheer
number of patients who needed laboratory testing, especially in the early phases of the virus
outbreak. As such, the over-extended medical system in Wuhan and other cities in Hubei
might have caused delays in the testing of the patients who contracted COVID-19; and be-
cause of the delay, some patients who contracted COVID-19 might have self-recovered, or
might have died, before being officially tested; and some who were infected with the virus
might be asymptomatic. There is also a possibility that government officials in the epicen-
ter cities had incentives to downplay the severity of the outbreak, at least initially. These
considerations impact how we use the outbreak data in Section 4.

3       The Impact of Wuhan Lockdown on Population Move-
        ments
    The incubation period of 2019-nCoV is long in comparison with SARS; moreover, the
virus can transmit while the person is still asymptomatic, which increases the probability a
person with the Novel Coronavirus will travel and unknowingly spread the virus to others.9
To suppress the spread of 2019-nCoV, the central government of China imposed an unprece-
dented lockdown in Wuhan starting from 10 am of January 23, 2020, and in other Hubei
cities several days later. As of February 29, 2020, 80 cities in 22 provinces issued different
    7
      Source: http://2019nCoV.chinacdc.cn/2019-nCoV/
    8
      The spike of confirmed cases observed on February 12 in Hubei Province is. for the most part, the result
of a change in diagnosis classification for which 13,332 clinically (rather than laboratory) confirmed cases
were all reported as new cases on February 12, 2020, even though they might have been clinically diagnosed
in the preceding weeks. Also on February 12, 2020, a new Communist Party Secretary of Hubei province
was appointed who started his position on the next day.
    9
      The range of the incubation period for 2019-nCoV is estimated to be 2-14 days, or even as long as 24
days. The median incubation period is about 5 days, see Lauer et al. (2020). In contrast, the incubation
period for SARS is 2-7 days. In addition, SARS transmits only after showing symptoms.

                                                      6
levels of lockdown policies.10 Table A1 in the Appendix provides the detailed information
about the various forms of population mobility control in different cities. We also plot the
geographic distributions of sample cities and cases in Figure 1.
[Figure 1 About Here]
3.1 Empirical Challenges
There are several confounding factors in our attempt to causally quantify the impact
of lockdown on human mobility, and on the spread of infectious viruses. First, the virus
outbreak happens right before the Spring Festival of the Chinese Lunar New Year, which
causes the largest annual human migration every year.11 Second, the virus itself, even in
the absence of a mandatory lockdown, may lead to curtailed human movement as people
attempt to avoid exposure to the virus in the journeys and public spaces. We refer to this
deterrence effect as the virus effect. Third, for the city of Wuhan and other cities in Hubei
that are close to Wuhan, there is also the possibility of a panic effect, in reaction to the virus.
The panic effect can lead to an increase in the population outflow from the epicenter of the
virus outbreak, and a decrease of the population inflow to the epicenter, particularly the city
of Wuhan. The panic effect is likely to peak when the government officially confirmed on
January 20, 2020 that the Novel Coronavirus can transmit from person-to-person. In our
analysis below, we create a specific pre-lockdown period Before2,t , which includes the three-
day period between January 20 and January 22, 202, to capture the panic effects.12 Note
that while the virus effect applies to movement into and out of all cities, the panic effect is
more specific to the cities in the epicenter, especially Wuhan, and can have a positive effect
on outflows, and a negative effect on inflows.
10
Within hours of the Wuhan lockdown, travel restrictions were imposed on the nearby cities of Huanggang
and Ezhou, and were eventually imposed on all 14 other cities in Hubei, affecting a total of about 57 million
people. On February 2, the city of Wenzhou implemented a partial lockdown in which only one person per
household was allowed to exit once every two days, and most of the highway exits were closed. Following
Wenzhou, another six cities, Hangzhou, Zhumadian, Ningbo, Haerbin, Fuzhou, and Zhengzhou also launched
similar partial lockdowns on February 4. In another 56 cities, surveillance and tighter controls applied to
each neighborhood. In the provinces of Liaoning and Jiangxi, as well as major cities such as Shenzhen,
Guangzhou, Nanjing, Ningbo, Chengdu and Suzhou, checkpoints have been set up to control the inflow
population.
11
The migration across China, which officially begins from about two weeks before, and ends about three
weeks after, the Lunar New Year is often referred to as Chunyun (meaning Spring movement). In 2019,
approximately 3 billions trips were made during Chunyun, see https://www.cnn.com/travel/article/
lunar-new-year-travel-rush-2019/index.html.
12
The large outflow from Wuhan is possible because many people in Wuhan are migrant workers and
college students with hometowns elsewhere.
73.2 Effects of Various Factors on Inter-City Population Mobility
We first examine the impact of city lockdown on inter-city population mobility, including
inflow and outflow, between a city pair (i, j). To disentangle the contributions of these
confounding factors on human mobility, we exploit many unique sources of variations in the
data, and employ several DID estimation strategies by comparing different treatment and
control groups. The DID specification can be described as follows:
Ln(Flowi,j,t ) =α + β1 · Treat ∗ Before1,t + β2 · Treat ∗ Before2,t
(1)
+ β3 · Treat ∗ Aftert + µi,j + θt + i,j,t
where i, j, and t respectively index the destination city, origination city, and date; the
dependent variable, Ln(Flowi,j,t ), is the logarithmic population flows received by city i from
city j at date t. The definition of Treat varies by specific DID designs, and we will be
explicit about its definition below. The city-pair fixed effect µi,j is included to absorb the
city-specific and the city-pair specific heterogeneities that may contaminate the estimation
of our interested coefficient β3 . We also control for the date-fixed effect θt to eliminate the
time-specific impact, including the Spring Festival travel effect. The standard errors are
clustered at the daily level.
In Equation (1), we include two pre-lockdown period indicators: Before1,t is a dummy
that takes value 1 for the period from January 11 to January 19, 2020 (4 to 11 days before
the Wuhan lockdown), which can be used to examine the parallel trend assumption in the
DID analysis; Before2,t is a dummy that takes value 1 for the period from January 20 to
January 22, 2020, three days before the unprecedented Wuhan lockdown, but after the official
announcement that the Novel Coronavirus can spread from person to person.13 Before2,t
allows us to capture the panic effect. Finally, Aftert is a dummy that takes value 1 for the
sample period after the Wuhan lockdown, between January 23 and February 29, 2020. The
omitted benchmark period is from January 1 to January 10, 2020.
13
On January 20, 2020, an expert at China CDC confirmed that the Novel Coronavirus can spread from
human to human. The confirmation highlighted the increasing risk of an epidemic. Prior to the January 20
announcement, the experts’ assessment of the virus was that it was “preventable and controllable,” and “at
this time, there is no evidence of person to person transmission.”
83.3 Effects of Various Factors on Within-City Population Mobility
We also estimate the effect of lockdown on the within-city population movement utilizing
the city-level data and a variety of DID specifications:
Ln(WithinCityFlowi,t ) =α + β1 · Treat ∗ Before1,t + β2 · Treat ∗ Before2,t
(2)
+ β3 · Treat ∗ Aftert + µi + θt + i,t
where i and t index the city and date. Ln(WithinCityFlowi,t ) is the logarithmic within-city
population mobility measure for city i at date t. Similar to Equation (1), Treat will be
defined according to the DID design. Before1,t , Before2,t and Aftert are defined in the same
way as in Equation (1). We include the city fixed effects µi and date fixed effects θt . The
standard errors are clustered at the daily level.
3.4 Estimation Results.
[Table 2 About Here]
In Table 2, we report the results from three sets of regressions specified according to
Equation (1) for inter-city inflows (Panel A) and outflows (Panel B), and according to Equa-
tion (2) for within-city movement (Panel C). We implement three models that differ in the
estimation sample, and the definition of the variable Treat.
Model 1: Wuhan 2020 vs. 284 Unlocked Cities in 2020. The estimation sample
used in the regressions reported in Column (1) is the 2020 data for Wuhan and 284 cities
that were never locked down during the Coronavirus outbreak.14
In Panel A when we examine the inflow population, Treat takes value 1 if the destination
city i is Wuhan; in Panel B when we examine the outflow population, Treat takes value 1 if
the origination city j is Wuhan. The control group consists of 284 cities that are not subject
to any mobility restrictions. In Panel C when we examine the within-city mobility, Treat
takes value 1 if city i is Wuhan. We interpret the coefficient estimate of Treat ∗ Before2,t
as measuring the panic effect of Wuhan relative to the unlocked cities; and the coefficient
estimate of Treat ∗ Aftert as measuring the lockdown effect.15 The coefficient estimate of
Treat ∗ Before1,t allows us to examine whether the parallel trend assumption for DID is
14
Recall that Baidu Migration data covers 364 Chinese cities, 80 cities implemented some level of mobility
restrictions (see Table A1).
15
If the virus effect is stronger in Wuhan than in the unlocked control cities, then the coefficient estimate
of Treat ∗ Aftert also includes the excess virus effect on the population in Wuhan over the average virus effect
experienced by the population in the control cities.
9satisfied. It is important to note that the possibly time-varying Spring Festival effects and
the virus effects are both absorbed in the day fixed effects.
Based on the coefficient estimate of the term Treat ∗ Aftert , we find that Wuhan’s lock-
down reduces the inflow population to Wuhan by 88.06% (= 1 − exp(−2.215)), the outflow
population from Wuhan by 74.44% (= 1 − exp(−1.364)), and within-city population move-
ments in Wuhan by 73.79%(= 1 − exp(−1.339)), relative to all other unlocked cities in the
post-lockdown period in 2020. In Panel C, we also find that the coefficient of Treat∗Before2,t
is significantly negative at -0.323, suggesting that the official confirmation of the person-to-
person transmission reduces the within-city movement in Wuhan by 27.6% from Jan 20 to
Jan 22 in 2020. This points to a panic effect for the within-city population flow in Wuhan,
but we do not observe a significant panic effect for inter-city flows in and out of Wuhan in
Model 1.
Model 2: Wuhan 2020 vs. Wuhan 2019. Model 1 could be criticized on the ground
that Wuhan may not be comparable to the 284 unlocked cities – after all, these 284 cities that
never imposed any mobility restrictions in the COVID-19 outbreak could be very different
from Wuhan. In Model 2, we compare the population movements of Wuhan in 2020 to itself
in the same matched lunar calendar period in 2019, during which Wuhan is free of lockdown
and Coronavirus outbreak. Thus, the estimation sample in Model 2 is the daily inflows into
and outflows out of Wuhan, as well as the daily within-city movements in Wuhan for years
2019 and 2020.
Under Model 2, in Panel A when we examine the inflow population, Treat takes value
1 if the destination city i is Wuhan and year is 2020; in Panel B when we examine the
outflow population, Treat takes value 1 if the origination city j is Wuhan and the year is
2020. The control group is Wuhan 2019. In Panel C when we examine the within-city
mobility, Treat takes value 1 if the year is 2020. Under Model 2, the coefficient estimate
of Treat ∗ Before2,t measures the panic effect related to the virus outbreak in Wuhan; and
the estimate of Treat ∗ Aftert measures the sum of the lockdown effect and the virus effect.
The coefficient estimate of Treat ∗ Before1,t still allows us to examine whether the parallel
trend assumption for DID is satisfied. The day fixed effects absorb the possibly time-varying
Spring Festival effects. Notice that the interpretation of the coefficient estimate of the term
Treat ∗ Aftert differs from that in Model 1 because of the differences in the treatment and
control groups.
Under Model 2, the estimated coefficients on Treat ∗ Aftert , which, as we explained
above, capture both the lockdown and the virus effects, remain negative, and economically
and statistically significant in all panels. The estimates suggest that the lockdown of Wuhan,
together with the deterrence effect of the virus (the virus effect), on average reduces the
10inflow population into, outflow population from, and within-city movements in Wuhan by
91.97% (= 1 − exp(−2.522)), 72.39% (= 1 − exp(−1.287)), and 69.49% (= 1 − exp(−1.871)),
respectively, relative to the same lunar calendar days in 2019. We also find that the coefficient
on Treat ∗ Before2,t is significantly positive in Panel B and significantly negative in Panel C,
suggesting that the official confirmation of person-to-person spread of COVID-19 creates a
panic effect, causing an increase of outflow from Wuhan of 107.09% (= exp(0.728) − 1), and
a decrease of within-city movements in Wuhan of 24.19% (= 1 − exp(−0.277)), during the
three days after the announcement but before the city lockdown. However, we do not observe
a statistically significant panic effect for the population inflow into Wuhan, suggesting that
people in other cities were not yet sufficiently concerned about the virus outbreak in Wuhan
and did not avoid traveling to Wuhan, even after the official confirmation of the person-
to-person transmission. Finally, we should also point out that the coefficient estimates for
Treat ∗ Before1,t are all statistically insignificant, which suggests that the parallel trend
assumption for the DIDs are plausible.
Model 3: Wuhan 2020 vs. Seven Other Lockdown Cities 2020. In Model 2, the
coefficient estimates of Treat ∗ Aftert provide us with an estimate of the sum of the lockdown
and the virus effects. In order to isolate the lockdown effect from the virus effect, we consider
Model 3, where the estimation sample consists of data of the city of Wuhan and seven other
cities that went into partial lockdown on February 2 and February 4, 2020, 12 to 14 days
after the lockdown of Wuhan, in an effort to curtail the spread of the virus.16 As we show
in Table A2 in the Appendix, these seven cities are more comparable to Wuhan than other
unlocked cities in terms of the epidemic situation and other economic indicators, and thus
provide a reasonable control group to partial out the virus effect. In particular, it is much
more plausible than in Model 1 (where the control cities are cities that were never locked
down) to assume that the deterrence effect of the virus on human mobility in the seven cities
is similar to that in Wuhan.
The estimation sample for Model 3 consists of data from Wuhan and the seven cities for
the period between January 1 and February 2, 2020. Note that during this period, none of
the seven control cities were locked down yet, even though they were soon eventually locked
down. The definition for Treat variables are as follows. In Panel A, Treat takes value 1 if
the destination city i is Wuhan; in Panel B, Treat takes value 1 if the origination city j is
Wuhan; in Panel C, Treat takes value 1 if city i is Wuhan. The control group consists of the
16
These seven cities are: Wenzhou, which was partially lockdown from February 2, 2020; and Ningbo,
Zhumadian, Hangzhou, Zhengzhou, Haerbin, and Fuzhou, which were partially locked down on February 4,
2020. As summarized in Table A1 in the Appendix, partial lockdown includes “closed-off management” on
highways, railways and public transport systems; and sets up checkpoints to control the inflow population,
and implements surveillance and tighter controls in each neighborhood.
11seven cities.
Under Model 3, the coefficient estimate of Treat ∗ Before2,t measures the panic effect
related to the virus outbreak in Wuhan relative to the seven control cities; and the estimate
of Treat∗Aftert measures the lockdown effect only. The coefficient estimate of Treat∗Before1,t
still allows us to examine whether the parallel trend assumption for DID is satisfied. The
possibly time-varying Spring Festival effects and the virus effects are both absorbed in the
day fixed effects.
We find that the Wuhan lockdown significantly reduces the inflow into, outflow from,
and within-city movements in Wuhan by 76.64% (= 1 − exp(−1.454)), 56.35% (= 1 −
exp(−0.829)), and 54.16% (= 1 − exp(−0.780)), respectively. We interpret these as the pure
lockdown effect on population mobility related to Wuhan.
Summary. Based on our preferred estimation models, which are models 2 and 3, Table
3 summarizes our estimates of the panic effect, the virus effect, and the lockdown effect on
inflows into, outflows from Wuhan, and within-city population movements in Wuhan.
[Table 3 About Here]
In Table 3, the lockdown effects are directly calculated from the corresponding coefficient
estimates of Treat ∗ After from Model 3 discussed above; the panic effects are from the
coefficient estimates of Treat ∗ Before2 in Model 2. For the virus effect, we recognize that
the coefficient estimates of Treat ∗ After in Model 2 incorporate both the lockdown and the
virus effects. Thus we calculate the virus effect on inflows into Wuhan to be exp(−2.522 −
(−1.454)) − 1 = −65.63%, on the outflows from Wuhan to be exp(−1.287 − (−0.829)) − 1 =
−36.75%, and on the within-city flow in Wuhan to be exp(−1.871−(−0.780))−1 = −54.15%.
Because our models assume that the different effects enter exponentially in explaining the
flows — recall the natural log specifications in Equations (1) and (2— when we would like
to calculate the impact of two or more effects on the population flows, we should not simply
add the individual effects. For example, the joint impact of the panic and virus effects on
outflows out of Wuhan is (1 + 107.09%) ∗ (1 − 36.75%) − 1 = 30.98%, instead of the simple
sum of 107.09% − 36.75% = 70.34%.
124 Quantify the Impact of Lockdown on the National
Spread of COVID-19
4.1 Inter-city Flow and the 2019-nCoV Transmission
We now examine the impact of human mobility on the transmission of 2019-nCoV. Con-
sidering that almost all the new COVID-19 cases outside the city of Wuhan were confirmed
after the Wuhan lockdown while almost all inter-city population flows occurred prior to the
Wuhan lockdown (see Figures 2 and 3), we investigate the imported infections by specifi-
cally looking at the impact of population inflows from cities in the epicenter of the Novel
Coronavirus outbreak, namely, Wuhan and other cities in Hubei province, on the new cases
in the destination cities.
Recognizing that 2019-nCoV has a long incubation period, we estimate a dynamic dis-
tributed lag regression model taking into account that inflows from Wuhan with different
lags may have differential impacts on the current new cases in the destination cities. Most
of the medical literature states that the 2019-nCoV virus has a median incubation period
of five days, and some can have an incubation period of 14 days or more (see Lauer et al.
(2020), e.g.). Luckily, our data allows us to incorporate the possibility that contact with an
infected person from Wuhan or other cities in Hubei can result in confirmed infections in the
destination city for up to 22 days.
The analysis focuses on the daily new confirmed COVID-19 cases in the post-Wuhan
lockdown period from January 23 to February 29, 2020, for cities i that are outside of Hubei
province. Specifically, we run the following regression:17
22
X
Ln(1+NewCasei,t ) = α + β1κ · Ln (Inflowi,WH,t−κ )
κ=1
22
! (3)
X X
+ β2κ · Ln Inflowi,j,t−κ + µi + θt + it ,
κ=1 j6=i,j6=WH,j∈HB
where i indexes the cities outside of Hubei, and t ∈ {23, ..., 60} indicate the date.18 κ ∈
{1, ..., 22} indicates the time lapsed from the inflows from Wuhan or other Hubei cities till
the current date t. Ln(1+NewCasei,t ) is the logarithm of the number of new confirmed
P
cases in city i at date t. Inflowi,WH,t−κ and j6=i,j6=WH,j∈HB Inflowi,j,t−κ are the inflows from
Wuhan, and the inflows from the 16 other cities in Hubei to city i, respectively, κ days prior
17
Our log-log specification is based on the classical susceptible-infectious-removed (SIR) model in epi-
demiology.
18
Date t = 23 indicates the date of January 23, 2020, and t = 60 the date of February 29, 2020.
13to the focal date t. We control for destination city fixed effects µi and date fixed effects θt .
Note that, in this regression we include only cities outside of Hubei Province for two
reasons. First, Wuhan and other cities in Hubei province are the epicenter of the Novel
Coronavirus outbreak, and we are interested in how population outflows from these cities
to other cities outside Hubei affect the destination cities’ COVID-19 cases. Second, the
confirmed COVID-19 cases in Wuhan and other cities in Hubei province are likely to be
inaccurate for the following reasons. First, as widely reported, the health care systems in
Wuhan and other cities in Hubei were totally overwhelmed by the sheer number of COVID-
19 patients. This made it impossible to conduct laboratory tests on all patients, which can
lead to delayed confirmation of infected patients. Second, during the delay some of the
infected may have healed on their own, or have died before being confirmed. Third, local
government officials may face strong incentives to under-report the number of infected cases.
In Section 4.2, we will evaluate the possible downward biases of the officially reported cases
in Wuhan and other cities in Hubei based on our estimates. In contrast, the confirmed cases
in other cities are likely to be accurate, as their numbers are not large enough to overwhelm
their local health care system; and the incentives to under-report are much weaker in cities
outside of Hubei.
The estimated coefficients β1κ and β2κ in Equation (3) respectively represent the impact of
the inflows from Wuhan and other cities in Hubei κ ∈ {1, ..., 22} days ago on the destination
cities’ new cases today. They are respectively plotted in the top and bottom panels of Figure
4. We also fit a spline smoothed curve of the estimated effects of the different lags of inflows
from Wuhan and Hubei, which both show a clear inverted U -shape with respect to the lags.
Interestingly, both graphs show that the largest impact on the newly confirm cases today in
Chinese cities outside Hubei comes from the inflow population from Wuhan or other cities
in Hubei about 12 to 14 days ago. The pattern exhibited in Figure 4 is consistent with the
hypothesis that the incubation period of the 2019-nCoV is up to 12 to 14 days, but also
consistent with a shorter incubation period coupled with secondary infections.
[Figure 4 About Here]
4.2 Estimating the “Actual” Number of Infection Cases in Wuhan
and Other Cities in Hubei
Anecdotal evidence suggests the official statistics of COVID-19 cases in Wuhan may have
been under-reported due to the shortages of testing equipment and other medical resources.
With the estimated dynamic effects as shown in Figure 4, which is estimated under the
plausible assumption that the reported cases outside Hubei Province are reliable, we can
estimate the “actual”’ number of infection cases in Wuhan and other cities in Hubei.
14To estimate the “actual” number of infection cases in Wuhan using the estimated Equa-
tion (3), we technically need to impute a value for InflowWH,WH,t−κ , that is “inflows from
Wuhan to Wuhan.” We proxy these inflows by the daily within-Wuhan population movement
from January 1 to February 29, i.e., by WithinCityFlowWH,t−κ . Similarly, to estimate the
“actual” number of infection cases in other cities in Hubei, we need to replace the inflow
from city j to itself by the corresponding daily within-city-j population movements.
We need to make an additional assumption about the city fixed effects. Recall that cities
in Hubei province were not included in the estimation sample for Equation (3), as such there
are no city fixed effects estimated for cities in Hubei. Luckily, it is plausible to assume that
the city fixed effects in Hubei is the average of the city fixed effects of all Chinese cities outside
Hubei. According to World Bank’s (respectively, IMF’s) method of estimating per capita
GDP, Hubei’s per capita GDP in 2018 was USD 10,067 (respectively, USD 10,054), and the
average per capita GDP of mainland China was USD 9,769 (respectively, USD 9,750). Hubei
is not only geographically and demographically in the center of mainland China, it is also
economically the average of China. Thus we believe it is defensible to proxy the fixed effects
of Hubei cities by the average of the city fixed effects outside of Hubei.
[Figure 5 About Here]
In Figure 5, we plot the estimated daily new cases according to the above-described
method using the estimated Equation (3), as well as the corresponding cumulative cases
for Wuhan (Panel A) and 16 other cities of Hubei (Panel B) for the period of January 23
to February 29, 2020. We also plotted the corresponding daily and cumulative officially
reported (i.e., documented) cases.
We find a persistent gap between the estimated and reported laboratory-confirmed cases
in Wuhan before February 11, 2020, just before the announcement of a new Party Secre-
tary for Hubei province on February 12, 2020. The estimated “actual” number of infection
cases is 2.48 times the reported cases during the first 20 days after the Wuhan lockdown,
on average. In particularly, we estimate that on January 23, 2020, the day of the Wuhan
lockdown, 42.17% of our estimated infections in Wuhan were undocumented in the sense
that the number of officially reported cases on that day was only 57.83% of our estimated
infection cases. This gap widened over time, possibly as a result of the overwhelmed health
care system, and peaked at 80.03% on January 26. The proportion of undocumented in-
fections started to decline gradually afterward, when more medical support and resources
were mobilized across China to support Wuhan. As of February 29, we estimate that there
were 54,689 total COVID-19 infections in Wuhan, which is 11.33% higher than the official
reported statistics for Wuhan — a total of 49,122 cases. The 11.33% discrepancy can be
plausibly be explained by the unaccounted for self-healing and death that might have oc-
curred during the early periods of the outbreak between January 23 and early February.
15Thus, we are led to conclude that the almost all infection cases in Wuhan were able to be
treated over time as the stress on the health system was relieved, and moreover, the official
statistics were mostly accurate, as can be seen from the left figure on the daily new cases in
Panel A in Figure 5.
It is useful to note that the general pattern of the undocumented COVID-19 infections in
Wuhan before and after the lockdown based on our estimates is consistent with that reported
in Li et al. (2020). They use a networked dynamic meta-population model and Bayesian
inference to estimate the proportion of undocumented infections in the epicenter of the
outbreak, as well as the respective inflection rates for documented and undocumented cases.
They estimate that 86% of all infection cases as of January 23, 2020 were undocumented.
Our interpretation of these undocumented cases is broader than the asymptomatic cases (i.e.
COVID-19 cases that do not show symptoms); we believe that some of the undocumented
cases were due to the lack of ability to test the rapidly increasing infection cases in the early
period of the outbreak. Most of the undocumented cases become documented over time as
the care capacity was strengthened in Wuhan.
In the bottom panel of Figure 5, we plot our estimated daily new confirmed cases and
total infection case for 16 cities (other than Wuhan) in Hubei province, together with the
officially reported series. We find that in the 16 cities, infections were more seriously under-
reported in the first week after the Wuhan lockdown when our estimated infected cases are
1.87 times of the reported cases. Our estimate reveals a very high rate of undocumented
infections on the first day of Wuhan lockdown: 79.8%. The gap narrowed gradually with
more medical resources provided and more stringent control measures implemented in those
cities. By the end of our study period on February 29, 2020, the estimated “actual” number
of infections is 17,999 cases in 16 other cities in Hubei, which is 17.4% higher than the offi-
cially reported cumulative cases (15,330). Again, the discrepancy between the estimated and
officially reported cumulative cases can at least be partially attributed to the unaccounted
for self-healing and death that might have occurred during the early periods of the outbreak.
4.3 How Many COVID-19 Cases Were Prevented by the Wuhan
Lockdown?
Locking down Wuhan, a city of 11 million residents, was an unprecedented measure to
contain the spread of the Novel Coronavirus. An important policy-relevant question is, then,
how many COVID-19 cases were actually prevented by the Wuhan lockdown in China? To
answer this question, we must estimate the counterfactual number of COVID-19 cases that
would have occurred in other cities in the absence of Wuhan lockdown, which would, in turn,
16require a counterfactual estimate of the outflows from Wuhan to other Chinese cities, had
there been no lockdown of Wuhan. In Section 3, we provided the estimates of how panic
effect and virus effect will separately affect the outflows from Wuhan to other cities in China,
separate from the lockdown effect. These effects are summarized in Table 3. It suggests that,
in the absence of the Wuhan lockdown, the virus effect and panic effects would have led to a
36.75% decrease and a 107.09% increase in the outflow population from Wuhan, respectively.
Based on these effects, Therefore, in the absence of Wuhan lockdown, we would expect that
the outflows from Wuhan in days after January 23 – the date of Wuhan lockdown – to be
Reducton from Virus Effect Increase from Panic Effect
z }| { z }| {
(1 − 0.3675) ∗ (1 + 1.0709) = 1.31 (4)
times higher than the normal outflows from Wuhan to other cities.
We use the daily level of outflows from Wuhan to a city in 2019 on the same lunar calendar
day as a measure of the normal outflow, and multiple the number by 1.31 to obtain the daily
counterfactual inflows from Wuhan to the city, had there been no lockdown of Wuhan from
January 23, 2020. Using this estimation method, we find that on average, the estimated
counterfactual outflows from Wuhan to 16 other cities in Hubei between January 23 and
February 29, 2020 would be 16,568,984, a level that is 5.97 times the actually observed
inflow population observed in the data in 2020 (with the lockdown), which is 2,774,793;
similarly, the average inflows from Wuhan to the 347 other cities outside Hubei in China
would be 2,274,455, 3.14 times the actual inflow population to those cities during the same
period in 2020, which is 723,574.19
We denote the counterfactual inflows from j = Wuhan into city i at date s ∈ {23, ..., 60}
from the above calculation as Inflow ^ i,WH,s . We assume that the Wuhan lockdown did not
impact the population movements within other cities, and population flows among other
cities. We also assume that all the control measures implemented by other cities after the
Wuhan lockdown remain in place. Thus the parameter estimates of the dynamic lag effects
of inflows from Wuhan and other cities in Hubei, estimated in Equation (3), remain valid
as an epidemiological diffusion equation that is not affected by human mobility restrictions
that result from the Wuhan lockdown; the lockdown only affected the human flows.
With these considerations in mind, we simulate the counterfactual number of COVID-19
cases, had there been no Wuhan lockdown, on date t ∈ {23, ..., 60} (i.e., from January 23 to
19
Recall that outflows from Wuhan are not just residents of Wuhan; any travelers who entered Wuhan
for whatever reason and then leave Wuhan would be included in the Wuhan outflows measured by Baidu
Migration data.
17February 29, 2020) in cities i outside Hubei province by the following equation:
22 22
!
X X X
Ln(1+NewCase
^ i,t ) = α̂+ β̂1κ ·Ln Inflow
^i,WH,t−κ + β̂2κ ·Ln Inflowi,j,t−κ +µ̂i
κ=1 κ=1 j6=i,j6=WH,j∈HB
(5)
where β̂1κ and β̂2κ are coefficient estimates obtained from regressions specified in Equation
(3) and reported in Figure 4, and and µ̂i are the estimated city fixed effects from the same
regression. Note that in predicting the counterfactual COVID-19 cases without Wuhan
lockdown, we use the counterfactual inflows from Wuhan to city i for days after January 23
^
Inflow i,WH,s discussed previously.
We are also interested in predicting the counterfactual cases in other non-Wuhan cities
in Hubei province using the same method as that described above, with two differences.
First, since Hubei cities are not included in the estimation of Equation (3), we do not have
the city fixed effects for the Hubei cities. As we argued in Section 4.2, it is plausible to
assume that the fixed effects of Hubei cities are the average of city fixed effects of the cities
outside Hubei. We maintain this assumption as well in this counterfactual exercise. Second,
following the same strategy of Section 4.2, for a non-Wuhan city j in Hubei province, we use
the within-city-j population movement at date t to proxy for the inflow to city j from city
j when we implement Equation (5) for non-Wuhan Hubei cities.
In Figure 6, we present the counterfactual estimates of COVID-19 cases had there been
no Wuhan lockdown (in solid curve), and the officially reported cases (in dashed curve) for
cities outside Hubei province (Panel A) and non-Wuhan cities of Hubei (Panel B). The left
figure in each panel depicts the model’s counterfactual prediction and the actual of daily
infection cases, and the right figure depicts the evolution of cumulative cases from January
23 to February 29, 2020.
The gap between the estimated counterfactual number of infection cases (the solid curve)
and the officially reported cases (the dashed curve) on the right figure represent the number
of COVID-19 cases prevented by the Wuhan lockdown. As of February 29, 2020, the officially
reported number of COVID-19 in the 347 cities outside Hubei province was 12,626, but our
counterfactual simulation suggests that there would have been 20,810 cases, had there been
no Wuhan lockdown. Similarly, the officially reported number of COVID-19 cases in the
16 non-Wuhan cities in Hubei was 15,330 by February 29, 2020, but our counterfactual
simulation suggests that the number of infection cases would have been 23,400, had there
been no Wuhan lockdown. That is, the COVID-19 cases would be 64.81% higher in 347
cities outside Hubei, and 52.64% higher in 16 other cities in Hubei as of February 29, in
the counterfactual world in which the city of Wuhan were not locked down from January
23, 2020. Our findings thus suggest that the lockdown of the city of Wuhan from January
1823, 2020 played a crucial role in reducing the imported infections in other Chinese cities and
halts the spread of 2019-nCoV virus.
Our model also allows us to project when the new infection cases would have peaked in
other cities in the absence of Wuhan lockdown. As shown by the solid curves in the left
figures of each panel, our model projects that in the absence of Wuhan lockdown, the new
daily infection cases in the 16 non-Wuhan cities in Hubei would have peaked on February 2,
the 9th day after the lockdown of Wuhan, at a level of 1,466 daily new cases; and elsewhere
in China, it would have peaked on February 3, 2020, the 10th day after the lockdown of
Wuhan, at a level of 1,082 daily new cases. We also find that the estimated daily new cases
in the counterfactual world gradually converge to the reported daily cases from February 22,
suggesting that the social distancing measures implemented elsewhere in China would have
worked eventually to contain the spread of 2019-nCoV virus, even if the city of Wuhan was
not locked down on January 23 2020, but the initial onslaught on the medical system in all
cities in China would have been much more severe, and the total number of infection cases
elsewhere would have been significantly higher.
[Figure 6 About Here]
5 Effect of Social Distancing on Virus Transmission in
Destination Cities
As the 2019-nCoV virus spread throughout the world, many countries are also imple-
menting lockdown measures, and mandate social distancing as a policy response to contain
the spread of the virus. Up to now, our analysis has focused on the events of the lockdown
of Wuhan – the epicenter of the Novel Coronavirus outbreak, it would also be interesting to
study the impact of lockdowns and/or the social distancing measures in the destination cities
in reducing and containing the spread of virus. Indeed, Chinazzi et al. (2020) point out that
travel restrictions to and from Mainland China impact the global pandemic of the COVID-
19 only if transmission within the community is simultaneously reduced by 50% or more,
which suggests that social distancing at the destination cities is crucial in preventing the
possibly asymptomatic transmission from the source city. Moreover, quantifying the effect
of social distancing on virus transmission is especially relevant to the stage of pre-epidemic
community spread when a person who is not known to have traveled to affected countries,
or to have had contact with an infected person becomes infected.
As shown in Table A1 in the Appendix, within the few weeks after the Wuhan and Hubei
lockdowns, various human mobility restrictions were imposed on 63 other Chinese cities
outside Hubei. As described in Table A1, the “lockdowns” in destination cities varied in their
19You can also read