Plummeting anthropogenic environmental degradation by amending nutrient N input method in saffron growing soils of north west Himalayas - Nature
←
→
Page content transcription
If your browser does not render page correctly, please read the page content below
www.nature.com/scientificreports
OPEN Plummeting anthropogenic
environmental degradation
by amending nutrient‑N input
method in saffron growing soils
of north‑west Himalayas
Anil Sharma1*, Sarvendra Kumar1, Shakeel Ahmad Khan2, Amit Kumar2, Javid Iqbal Mir1,
Om Chand Sharma1, Desh Beer Singh1 & Sanjay Arora3
Nitrous-oxide emission and nitrate addition from agriculture to earth’s environment are two main
agriculture related anthropogenic causes of environmental degradation that needs greater attention.
For addressing the aforesaid issue, new techniques/practices need to be developed and implemented.
The present investigation, which was focused on this issue, resulted in developing a new mode of
nitrogen (N) placement, i.e. ‘mid rib placement upper to corms in two splits (MRPU-2S)’, that could
reduce nitrous oxide N emission by around 70.11% and, nitrate N leaching and runoff by around 68.26
and 67.09%, respectively, over conventional method, in saffron growing soils of northwest Himalayas.
Besides plummeting environmental degradation, MRPU-2S further resulted in enhancing saffron yield
by 33.33% over conventional method. The findings of the present investigation were used to develop
new empirical models for predicting saffron yield, nitrate N leaching and nitrous-oxide N emission. The
threshold limits of nitrate N leaching and nitrous oxide N emission have also been reported exclusively
in the present study.
Pessimistic modification in the intrinsic composition of nature, by various human induced activities and prac-
tices, results in anthropogenic environmental degradation. This occurs when the earth’s natural resources are
depleted, due to human interference, and the environment is compromised in the form of pollution in the soil,
water and air. Along with industries and transportation, agriculture is considered as one of the major causes of
pollution that can corrupt environment considerably. Fertilizers, especially nitrogenous fertilizers, and pesti-
cides are known to be the major culprits, amongst agricultural inputs, responsible for such pollution. Every year,
about 67.84 million tons of nitrogen is applied to agricultural lands worldwide1. Most of this nitrogen escapes
the agricultural system2 and become pollutants3. Nitrogen when applied in an agricultural field encounters five
major processes viz. taken up by crop, fixes in soil as reserve, leaches from the root zone, escapes to atmosphere
as gas and moves as surface r unoff2,4,5. Later three of these five processes are considered as the main contribu-
tor to environmental deterioration. These processes are responsible for nitrate pollution, in ground and surface
water bodies, and nitrous oxide emission (N2O) which is one of the greenhouse gases (GHGs) responsible for
global warming.
Contamination of surface and ground water by leached nitrate from agricultural fields is a global phenom-
enon that has impelled social and political pressure to trim down nitrate leaching leading to contamination of
water6 and consequent environmental degradation. As per global e stimates7 around 50% of the total nitrogen
(N) lost (that constitutes approximately 10–20% of applied N)8 of the nitrogen applied to the agricultural fields
is lost by leaching9,10, and becomes a part of ground water. About 50% of the world’s drinking water11 and 40%
of agricultural irrigation water12 is supplied by ground water. The ground water resources also maintain surface
water bodies like lakes, rivers and w etlands13. So, leached as well as surface runoff nitrate N is diffused to these
water resources and poses threat to ground as well as surface water quality g lobally14,15. The Environmental
Protection Agency (EPA) has since adopted the 10 mg L −1 standard as the maximum contaminant/permissible
1
ICAR-Central Institute of Temperate Horticulture, Old Air Field, KD Farm, Rangreth, Jammu and Kashmir 191132,
India. 2ICAR- Indian Agriculture Research Institute, New Delhi, India. 3ICAR-Central Soil Salinity Research Institute,
Regional Research Station, Lucknow, UP 226002, India. *email: magotra_anil@rediffmail.com
Scientific Reports | (2021) 11:2488 | https://doi.org/10.1038/s41598-021-81739-x 1
Vol.:(0123456789)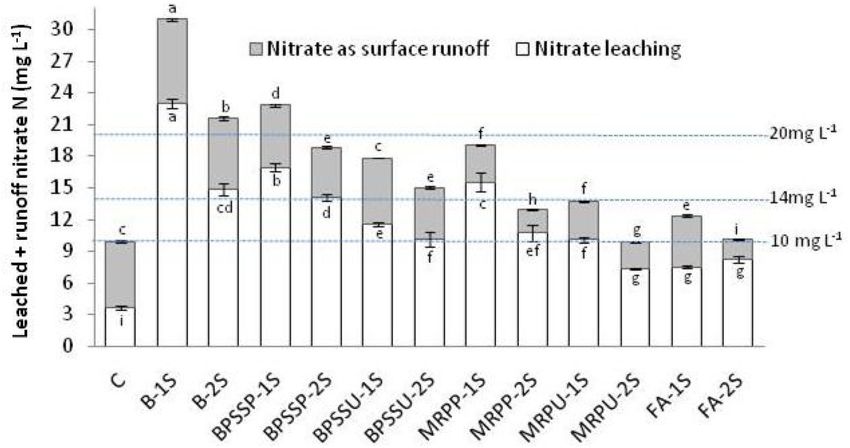
www.nature.com/scientificreports/
level (MCL) for nitrate–nitrogen in water. Higher concentrations than the MCL can cause severe public health
risk16,17, which at present is a big global concern.
Nitrogen fertilization in agricultural soils is not merely accountable for nitrate pollution, but also for the
greatest amount of nitrous oxide ( N2O) emissions among all the anthropogenic s ources18,19. Agriculture is a
major contributor20,21 that accounts for about 60% of N2O emissions worldwide22 and inefficient use of exter-
nally added N, by crops, is considered responsible for this e mission23. Nitrous oxide emission during the last
few decades has increased and its levels in the atmosphere have amplified, which is not good, as it contributes
to global temperature c hange2, crop pest infestation24 and human health risks25.
The aforesaid nitrogen losses, in agricultural crops, and their pollution potential has persuaded research-
ers to identify easily adaptable management practices that ensure enhanced N use efficiency and reduction in
its losses that cause environmental deterioration. Amongst these agricultural crops N management of Saffron
(Crocus sativus), one of the most expensive agricultural crops of the world26, as its approximate price ranges from
US$500 to US$5,000 per pound, needs greater consideration. India is the second largest producer of Saffron after
Iran27 and in India it is grown only in cold humid regions of North West Himalayas. In the last few decades a
decrease in area and productivity of this crop has been noticed. Along with others, declining soil f ertility27 and
inefficient nutrient, especially N, management are deemed as the factors responsible for this decline. The major
problem in the current mode of N application practice (broadcasting/surface application) is its low nutrient N
use efficiency as a substantial amount of nitrogen gets wasted as N losses7. Low nitrogen use efficiency results
in low biomass production, whole of which is incorporated in the soil, which further leads to low soil organic
carbon stocks and hence low saffron yield in sequential years. Besides the said mode leaves a substantial amount
of fertilizer for weeds. Further, there is a need of rainfall or assured irrigation (in case of broad casting) to move
N into the root zone otherwise nutrient remain on soil surface making it unavailable to the plant root system.
So for efficient N management, right placement of nutrient in the soil is a key component for escalating plant
utilization and curtailing nutrient N losses responsible for environmental degradation. Even if not in all but in
few of the important agricultural crops grown worldwide, the right nutrient N placement mode is standard-
ized and followed, then it will help not only in enhancing use efficiency of external N supplied but will reduce
environmental degradation due to N too.
Keeping in view the above-mentioned facts, it becomes obligatory to alleviate nitrogen losses leading to envi-
ronmental/ecological degradation. This can be done by introducing agricultural practices that enhance N use
efficiency of crop plants28–30 and right mode of N application/placement and its rate are a few of such options. But
as rate of N application for the crop has already been standardized/recommended, so the present investigation
was aimed to standardize/evaluate input method/mode of application of the recommended dose of nutrient N,
with the hypothesis that mode of application can be the reason and may have a significant influence on N losses
and use efficiency. So, in present investigation, for the very first time, the effect of various modes of nitrogen
applications/placement, conventional as well as introduced/amended, was investigated and their impacts on
environment i.e. nitrate pollution, nitrous oxide emission and saffron production was revealed. Although the
present investigation was carried out in saffron growing soils only, but the information/recommendation gener-
ated from it can be applied in other soils too.
Results
Nitrogen losses, as nitrate leaching and surface runoff, and its pollution potential. Influence
of various nutrient-N input methods on its losses in the form of nitrate, leading to environmental pollution
was revealed (Fig. 1). Nitrate N leaching was well below the maximum permissible limit (MPL) of 10 mg L −1,
in four treatments reflecting their negligible pollution potential due to nitrate N leaching. Least nitrate N leach-
ing (3.6 mg L−1) was noticed in the control where as in other three treatments, i.e. MRPU-2S, FA-1S and FA-2S,
nitrate N leaching amounted to 7.3, 7.5 and 8.2 mg L−1, which were statistically at par with each other. Nitrate
N leaching in conventional method 1 (BS-1S) was 23 mg L −1 and was well above the MPL, thus leading to very
−1
high polluting potential (> 20 mg L −1), the other treat-
). In ‘high polluting potential category’ (> 14 ≤ 20 mg L
ments were B-2S (conventional method II), MRPP-1S and BPSSP-1S with values of nitrate N leaching being 14.8,
15.5 and 16.9 mg L −1, respectively. Nitrate N leaching in remaining treatments was in ‘low pollution potential
category’ (> 10 ≤ 14 mg L−1).
So far as nitrate N addition through surface runoff is concerned, it ranged between 1.9 to 7.9 mg L−1. As
ground water also contributes to surface water bodies and vice-versa, so cumulative nitrate N addition, due to
leaching and surface runoff was also studied (Fig. 1). Cumulatively, other than control (9.9 mg L−1 nitrate N
leaching) only one treatment MRPU-2S was below MPL with value being 9.9 mg L−1, thus having negligible
pollution potential. Both the conventional methods were cumulatively in very high polluting potential category
with values being 30.9 and 21.6 mg L −1.
Nitrogen losses, as nitrous oxide emission, and its global warming potential (GWP). A sig-
nificant influence of various N input methods on N2O–N emission and consequently global warming potential
(GWP) was observed (Fig. 2). Highest N2O–N emission amounting to around 0.75 kg ha−1 was noticed in B-1S
(conventional I) treatment followed by BPSSP-1S treatment (0.57 kg ha−1) which was at par with MRPP-1S
and BS-2S (conventional method II) with emission values for the later two being 0.52 and 0.51 kg ha−1, respec-
tively. Least emission, which was statistically as low as in control (0.21 kg ha−1) was observed in MRPU-2S that
amounted to around 0.25 kg ha−1. The global warming potential of N 2O also followed similar trends (statisti-
cally also). Highest GWP was observed in B-1S (706 kg CO2 eq. ha−1) and least GWP due to N2O emission was
observed in MRPU-2S (234.90 kg CO2 eq. ha−1) which was at par with control (200.06 kg CO2 eq. ha−1).
Scientific Reports | (2021) 11:2488 | https://doi.org/10.1038/s41598-021-81739-x 2
Vol:.(1234567890)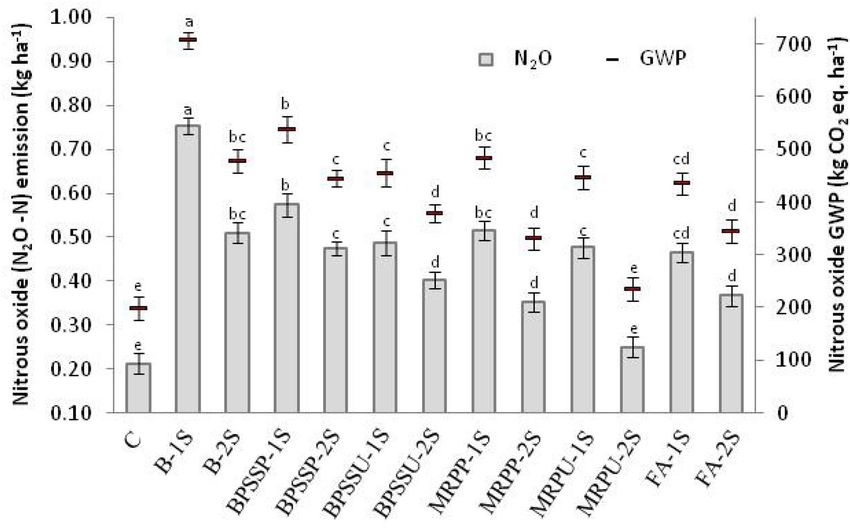
www.nature.com/scientificreports/
Figure 1. Nitrogen losses (as leaching and surface run off) and their cumulative pollution potential, as effected
by various N input methods in saffron growing cold humid region of North West Himalayas (Maximum
permissible limit (MPL), as per Environmental Protection Agency (EPA) guidelines, of Nitrate N in ground
water/water bodies = 10 mg L−1; Negligible polluting potential (≤ 10 mg L−1); Low polluting potential
(> 10 ≤ 14 mg L−1); High polluting potential (> 14 ≤ 20 mg L−1); Very high polluting potential (> 20 mg L−1)).
Figure 2. Nitrogen loss (as N2O–N) and its global warming potential as effected by various N input methods in
saffron growing soils of cold humid region of North West Himalayas.
Nitrogen use and accumulation efficiency. Nitrogen use (NUE) and accumulation (NAE) efficiency
also got affected by various N input methods (Table 1). Highest nitrogen use and accumulation efficiency were
observed in MRPU-2S treatment which was to the extent of 23.9 and 33.7%, respectively, and was statistically
significant over other treatments. MRPP-2S and MRPU-1S were next with values for NUE being 21.6 and 21.0%
and NAE being 31.4 and 30.8%.
Relationship of nitrogen losses with NUE and NAE. A linear, but negative relation of NUE and NAE
with Nitrate N leaching as well as Nitrous oxide emission was observed (Fig. 3). On the basis of these relation-
ships empirical models to calculate and quantify nitrate leaching and nitrous oxide emission, from relatively
easily determinable NUE and NAE, were developed which are presented as Eqs. (1)–(4).
On the basis NUE
Scientific Reports | (2021) 11:2488 | https://doi.org/10.1038/s41598-021-81739-x 3
Vol.:(0123456789)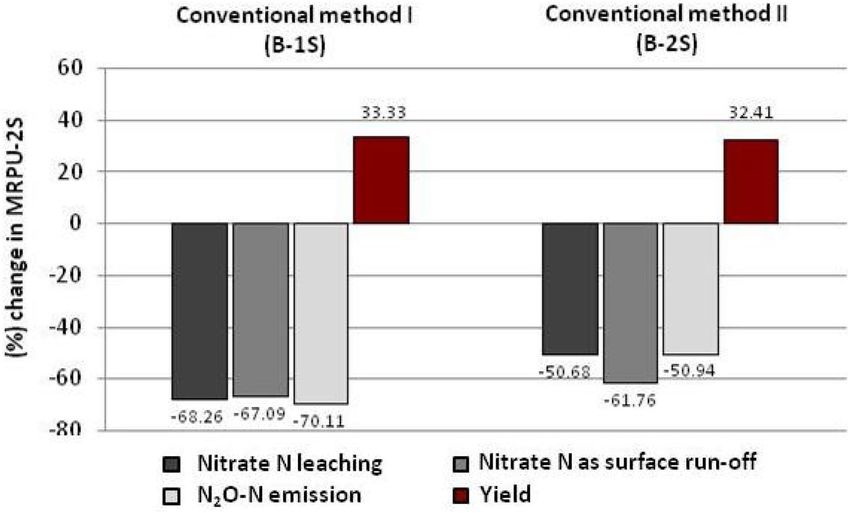
www.nature.com/scientificreports/
Treatment Yield (kg h
a−1) Crocin (mg g−1) Safranal ( mg g−1) NUE (%) NAE (%)
C 1.16 (± 0.006) g
16.71 (± 0.074)g
0.14 (± 0.015)c – –
B-1S 1.44 (± 0.003)ef 25.57 (± 0.089)b 0.29 (± 0.015)a 12.8 (± 0.76)e 22.6 (± 0.46)e
e f c d
B-2S 1.45(± 0.064) 18.36 (± 0.058) 0.16 (± 0.012) 16.5 (± 0.04) 26.3 (± 0.39)d
f i b d
BPSSP-1S 1.38 (± 0.043) 12.43 (± 0.072) 0.21 (± 0.012) 15.9 (± 0.34) 25.7 (± 0.06)d
ef cd bc d
BPSSP-2S 1.42 (± 0.006) 21.86 (± 0.048) 0.19 (± 0.015) 17.4 (± 0.95) 27.2 (± 0.88)d
c g c cd
BPSSU-1S 1.61(± 0.012) 16.70 (± 0.015) 0.13 (± 0.009) 18.8 (± 1.13) 28.6 (± 0.78)cd
c d c c
BPSSU-2S 1.62 (± 0.003) 21.50 (± 0.030) 0.16 (± 0.010) 19.7 (± 0.33) 29.4 (± 0.29)c
MRPP-1S 1.78 (± 0.012)b 10.79 (± 0.184)j 0.29 (± 0.018)a 17.2 (± 0.71)d 27.0 (± 0.67)d
MRPP-2S 1.80 (± 0.007)b 19.21 (± 0.110)e 0.22 (± 0.015)b 21.0 (± 0.20)b 30.8 (± 0.80)b
MRPU-1S 1.83 (± 0.006)b 17.00 (± 0.127)g 0.20 (± 0.015)bc 21.6 (± 0.26)b 31.4 (± 0.63)b
MRPU-2S 1.92 (± 0.012)a 26.64 (± 0.039)a 0.30 (± 0.012)a 23.9 (± 1.01)a 33.7 (± 0.74)a
FA-1S 1.53 (± 0.006)d 22.00 (± 0.381)c 0.28 (± 0.015)a 18.3 (± 0.11)cd 28.1 (± 0.45)cd
FA-2S 1.57 (± 0.006)cd 14.57 (± 0.170)h 0.19 (± 0.015)bc 17.2 (± 0.19)d 27.0 (± 0.09)d
Table 1. NUE, NAE, yield, crocin and safranal content as affected by various N input methods in saffron
growing cold humid region of North West Himalayas.
Figure 3. Relationship between Nitrogen losses and (a) nutrient use and (b) nutrient accumulation efficiency in
saffron growing cold humid region of North West Himalayas.
Scientific Reports | (2021) 11:2488 | https://doi.org/10.1038/s41598-021-81739-x 4
Vol:.(1234567890)www.nature.com/scientificreports/
Nitrate N leaching mg L−1 = −1.253 ∗ NUE + 35.48, (1)
N2 O − N emission kg ha−1 = −0.036 ∗ NUE + 1.14. (2)
On the basis NAE
Nitrate N leaching mg L−1 = −1.254 ∗ NAE + 47.79, (3)
N2 O − N emission kg ha−1 = −0.036 ∗ NAE + 1.50. (4)
Correlation analysis was performed to understand the relationship between NUE and N losses. Results
revealed that NUE was negatively and significantly related to gaseous (r = − 0.852**) and leaching (r = − 0.798**)
N losses, however no significant relationship of NUE with N losses as surface runoff was observed.
Saffron yield and apocarotenoid contents. Various N input methods affected saffron yield and its
apocarotenoid contents too (Table 1). A significantly higher yield of 1.92 kg ha−1 was observed in MRPU-2S
treatment. Treatments MRPU-1S, MRPP-2S and MRPP-1S were next with a yield of 1.83, 1.80 and 1.78 kg ha−1,
respectively. Least yield was noticed in BPSSP-1S (1.38 kg ha−1) which was at par with B-1S (conventional
method I) (1.44 kg ha−1) and BPSSP-2S (1.42 kg ha−1).
The results also showed a significant variation among various N input methods with respect to apocarotenoid
contents (Table 1). MRPU-2S had the highest total concentration of both crocin (26.64 mg g−1 of stigmas) and
safranal (0.30 mg g−1).
Saffron yield as influenced by nitrogen losses. Besides degrading environment, N losses affected saf-
fron yield too (Fig. 4). It was observed that during the initial losses of N, whether through nitrate N leaching or
N2O–N emission, yield showed a slight increase, and then static and decreased thereafter.
It was observed that up to 12 mg L−1 nitrate leaching yield showed a slight increase, then remained somewhat
static up to 13.9 mg L−1 and after that decreased. It means if nitrate leaching exceeds 13.9 mg L−1, a decrease in
yield starts and its extent can be quantified by a polynomial empirical model given as Eq. (5). Almost similar
trends in saffron yield in relation to N 2O–N emission were also observed. It was revealed that yield increased
up to 0.38 kg ha−1 N2O–N emission, remained static between 0.38 to 0.45 kg ha−1 and decreased thereafter. This
further suggests that when N 2O–N emission goes above 0.45 kg ha−1 it affects saffron yield negatively. The extent
of the decrease can be quantified from the polynomial empirical model presented as Eq. (6).
2
Saffron yield kg ha−1 = −0.003 ∗ NO3 − leaching in mg L−1
(5)
+0.078 ∗ NO3 − leaching in mg L−1 + 1.16
2
Saffron yield kg ha−1 = −2.29 ∗ N2 O − N emission kg ha−1
(6)
+1.93 ∗ N2 O − N emission kg ha−1 + 1.21
The threshold values of Nitrate leaching (13.9 mg L−1) and Nitrous oxide emission (0.45 kg ha−1 N2O–N) after
which yield starts decreasing have been reported exclusively in the present study.
Change in nitrogen losses, leading to environmental degradation, and saffron yield in com‑
parison to conventional N input methods. Data analysis revealed that N application through MRPU-
2S resulted in significant reduction in N losses (Fig. 5). In the aforesaid treatment nitrate leaching, nitrate as
surface runoff and nitrous oxide N emission reduced by 68.26, 67.09 and 70.11% over conventional method I
(B-1S) that is practiced by most of the saffron growers. In case of conventional method II i.e. B-2S, these N losses
reduced by 50.68% (as nitrate leaching), 61.76% (as surface runoff) and 50.94% (as nitrous oxide N emission)
in MRPU-2S treatment. Impact of N input through MRPU-2S on saffron yield was also determined and it was
observed that yield in this treatment increased over both the conventional methods to an extent of 33.33 and
32.41% in conventional method I (B-1S) and conventional method II (B-2S), respectively.
Clay minerals and nitrate leaching. Soils from four locations, representative of major saffron growing
areas of cold humid south western Himalayas were studied for clay mineralogy with the hypothesis that clay
minerals do have their influence on nitrate leaching from soils. The X-ray diffractograms of the soil clays clearly
exhibited the dominance of illite in these soils. After analyzing the relationship of nitrate leaching with illitic clay
minerals (Fig. 6), a linear but negative relation was observed which can be understood from the Eq. (7).
Nitrate leaching mg L−1 = −0.35 ∗ Illite (%) + 36.13. (7)
Scientific Reports | (2021) 11:2488 | https://doi.org/10.1038/s41598-021-81739-x 5
Vol.:(0123456789)www.nature.com/scientificreports/
Figure 4. Effect of Nitrogen losses, (a) Nitrate leaching (b) N2O–N emission, on saffron yield in saffron
growing cold humid region of North West Himalayas.
Discussion
Cumulatively low nitrate addition and hence negligible pollution potential in MRPU-2S can be attributed to
the correct placement of N fertilizer, as correct placement often improves the efficiency by which plants take up
nutrients and thus can protect both surface and ground water quality31. Rib or band placement reduces potential
erosion losses and thus reduces surface runoff. More surface losses can also be attributed to low to medium infil-
tration rate (16 mm h −1) of these soils. More leaching losses in conventional methods may be because of the high
nitrification rate followed by the oxidation of the nitrite to nitrate in these treatments. It was further observed
that when N was applied in two splits the losses were less which means that N input was meeting plant demand
as was applied at critical stages32. It was further established that when N was placed midrib upper to the corms
it was efficiently taken up by plants as in single sided placement and parallel placement a significant portion of
it could not be taken up by plants and got removed as leaching (as a significant part of nitrogen moves to offside
from where the roots are relatively far).
Low N2O–N emission in MRPU-2S can be attributed to decrease in volatilization losses of fertilizer N due to
its incorporation in soil31. When fertilizer N is placed closer to the roots, the plant is likely able to use the nutrient
more efficiently, especially at earlier stages when plant roots are small and localized33. More N2O–N emission
means more concentration of this gas in the atmosphere and hence more contribution to the greenhouse effect
and consequently more global warming potential.
Localized placement of N in the root zone, in MRPU-2S, resulted in maximum uptake of nitrogen34 that fur-
ther resulted in high NUE and NAE in this treatment. While in conventional and other methods, although the
extent was varied, the N losses were more and hence less uptake resulted in low NUE. Moreover deep placement
Scientific Reports | (2021) 11:2488 | https://doi.org/10.1038/s41598-021-81739-x 6
Vol:.(1234567890)www.nature.com/scientificreports/
Figure 5. Per-cent change in nitrogen losses leading to environmental pollution, and saffron yield in MRPU-2S
method over conventional (practiced) method in saffron growing cold humid region of North West Himalayas.
Figure 6. Nitrate N leaching as influenced by illite content in saffron growing cold humid region of North West
Himalayas.
of N fertilizer saves N fertilizer and increase N UE35. Low NUE because of inappropriate applications of nitrogen
(N) fertilizer have also been noticed by other researchers too36,37. Inappropriate N fertilization results in great
N losses, and thus environmental problems, such as groundwater and surface water contamination, greenhouse
gas increases, and soil quality degradation19,38.
Further a linear but negative relation of NUE and NAE with both nitrate N leaching and nitrous oxide N
emission can be because of the reason that as N losses increases, less nitrogen retains in the soil for plant roots
and thus plants cannot optimize N utilization because of a lesser amount of uptake and accumulation.
More saffron yield in MRPU-2S can be attributed to more NUE and reduced nitrogen losses of this treatment
when compared to others. In existing N application practice (broadcasting) there exists three main disadvantages
viz. underutilization of N by plant roots as it moves laterally over long distance, weed growth gets stimulated
and N gets fixed due to its exposer to large masses of soil. With correct N management, in present case ‘N
application’, saffron can produce w ell39. So far no such study has been attempted in saffron crop but somewhat
similar results have been reported in a previous study in Canada in wheat crop, where wheat yield was greater
with subsurface N treatments than with surface N broadcast40,41. Researchers also reported that wheat grain
yield after broadcast application was significantly lower than with deep banding of N f ertilizer42. Uptake of N by
weeds in surface broadcast of basal fertilizer may result in low y ields43 in conventional methods. More amount
Scientific Reports | (2021) 11:2488 | https://doi.org/10.1038/s41598-021-81739-x 7
Vol.:(0123456789)www.nature.com/scientificreports/
of apocarotenoid in MRPU-2S treatment, compared to others can again be attributed to high N uptake as N
plays its role in metabolism.
A polynomial relationship of yield with N losses was observed. A slight initial increase in saffron yield with
increasing N losses can be attributed to the high rate of initial N mineralization that results in temporary high
uptake and decrease thereafter. A few regression models for estimating yield have already been given b y44,45, but
most of these models are based on other parameters like weather or crop growth parameters. The N management
practice suggested in the present investigation will influence NUE and consequently N losses and ultimately
yield. So these regression models can be of great significance for saffron yield anticipation.
Observance of lower N losses in MRPU-2S in comparison to conventional method can be due to N fertilizer
input/placement at deeper soil depths, in MRPU-2S, that have relatively low soil temperature and total organic
carbon levels compared to the soil surface and shallow depths, and thus expose fertilizer to reduced soil micro-
bial activity and hence reduce soil N2O–N emissions and nitrate N leaching46. An increase in yield in MRPU-2S
can be attributed to high NUE of the said treatment. These findings hold up our assumption that by escalating
saffron yields through amending N input method, the negative ecological impacts associated with saffron crop
can also be reduced and less N will be available for losses.
The illitic nature of saffron growing soils could be attributed to micaceous parent material of these s oils47.
Further a linear but negative relationship of illite with nitrate N leaching was noticed. This could be attributed to
immobilization of nitrogen as N H4+ ion, as it displaces K+ ion from diurinal cavities of illitic clay minerals because
48,49
of somewhat close ionic r adii , especially in illitic/micaceous clay minerals. This further results in a reduced
nitrification rate followed by a decrease in oxidation of the nitrite to nitrate and hence reduced leaching of nitrate.
Conclusions
Growers cannot control natural factors like soil properties and climatic conditions, that affect N losses, but
anthropogenic N losses leading to environmental degradation can be reduced by efficient nutrient management
practices. Mode of N fertilizer placement is one of these. After scrutinizing the results of present investigation, it
can be concluded that nitrogen placement in mid rib upper to corms in two splits, resulted in reduced N losses
responsible for environmental pollution and subsequently enhanced yield too. Besides, the soils with more illitic
clay minerals encountered less N losses due to leaching, which mean illite dominating soils should be encour-
aged for saffron cultivation in cold humid regions of northwest Himalayas. Empirical models developed will be
of great significance for researchers, planners and policy makers as these can predict and quantify yield as well
as N losses. Further, the researchers working in related field, especially in developing countries, will also have
to consider the fact that instead of going to expensive mitigation options lets us first amend, consolidate and
extend the easily controllable management practices that can reduce N losses (as leaching, surface runoff or as
nitrous oxide emission) responsible for ecological degradation.
Materials and methods
Life cycle of saffron is seven to ten years with varying yield in successive years50, and in present investigation an
average of five years data was considered with the assumption that saffron yield within first five to six years is eco-
nomically reasonable26. Geographically the study/concerned area extends from 32° 30′ to 34° 30′ N latitude and
74° to 75° 30′ E (Fig. 7). Agro climatically the region falls under temperate zone. The soils are slightly acidic with
high organic carbon content (1.27%), medium available nitrogen (291 kg ha−1) and phosphorus (13.88 kg ha−1),
and high available potassium (358 kg ha−1) status. Average available sulfur, calcium and magnesium are around
11, 994 and 260 mg kg−1. The infiltration rate of the soils is 16 mm h −1 and bulk density is 1.4 g cc−1. Texturally
the soils are clay loam with electrical conductivity of 0.19 dS m −1.
Experimental details. Present investigation was carried out through 5 year experimentation, from the
year 2012 to 2017 with a set of thirteen N fertilizer placement/application methods (conventional as well as
introduced), to reveal the impact of various modes of N fertilization on environment as well as yield of saffron.
Thirteen N fertilization treatments were-Control (C), Broadcasting in one split (conventional method I) (B-1S),
Broadcasting in two splits (conventional method II) (B-2S), Band placement single sided parallel to corm in one
split (BPSSP-1S), Band placement single sided parallel to corm in two splits (BPSSP-2S), Band placement single
sided upper to corm in one split (BPSSU-1S), Band placement single sided upper to corm in two splits (BPSSU-
2S), Midrib placement parallel to corm in one split (MRPP-1S), Midrib placement parallel to corm in two splits
(MPPP-2S), Midrib placement upper to corm in one split (MRPU-1S), Midrib placement upper to corm in two
splits (MRPU-2S), Foliar application in one split (FA-1S) and Foliar application in two splits (FA-2S). The macro
nutrients were applied as per recommended dose of N:P:K (90:100:120 kg ha−1)51,52 in all the treatments except
in control, where no N was applied. In general, the saffron growers of the area either apply no nitrogen or rec-
ommended nitrogen (90 kg ha−1) through broadcasting. No nitrogen leads to decrease in yield and broadcasting
leads to nitrogen losses, low nitrogen use efficiency and subsequently decrease in yield, although not as much as
in cases where no nitrogen is applied.
Field experiment with these thirteen treatments was carried out at experimental site A having latitude 33°
58′ 54.58″ N, longitude 74° 48′ 3.49″ E and altitude 1640 m amsl, whereas the clay mineralogical and nitrate
leaching studies were carried out at four different sites where conventional mode of N application was followed.
All the treatments were replicated thrice in micro plots of size 6 sq m (3 m × 2 m) with randomized complete
block design. The distance between the rows and corms was kept at 15 and 10 cm, respectively. The corms were
sown at a depth of 15 cm in raised beds. Placement of fertilizers was done with exclusively designed V shaped
single sided Pickaxe (Tungroo). The saffron corms have a characteristic of moving a little upward every year, so
the placement was adjusted as per it. Nitrogen was applied through Urea.
Scientific Reports | (2021) 11:2488 | https://doi.org/10.1038/s41598-021-81739-x 8
Vol:.(1234567890)www.nature.com/scientificreports/
Figure 7. Location of the research/study area.
HPLC analysis for apocarotenoid quantification. All the saffron samples were dried under uniform
conditions using saffron dryer to nullify the effect of drying conditions on the concentration of apocarotenoid53,54.
For apocarotenoid analysis, extraction of saffron stigma was made with methanol (100 ml) in a micro-centrifuge
tube for five minutes on ice, and then 100 ml of Tris–HCl was added and incubated for ten minutes on ice. After
centrifugation at 3000g for 5 min at 4 °C, the precipitate was collected and the pellet was reground in 400 ml
acetone and again incubated on ice for ten minutes. The mixture was again centrifuged at 3000g at 4 °C for five
minutes. The process was repeated till the disappearance of colour of the pellet. After pooling and evaporation of
the supernatants, the dried residues obtained were stored at − 80 °C until high performance liquid chromatog-
raphy (HPLC) analysis. Samples extracted were then dissolved in HPCL grade methanol at a concentration of
100 mg L−1 and filtered through 0.2 µm syringe filters. Filtered sample (20 µl) was then injected in HPLC coupled
to a photodiode array (PDA) d etector53. With an injection volume of 20 μL and a flow rate of 1 ml min−1 with
a run time of 35–40 min, the separation was done. Each sample was run in triplicate. Safranal and crocin were
detected at wavelengths of 310 and 440 nm, respectively. The standards for respective apocarotenoid were also
detected at the same wavelengths55. Chromatographic separation was performed on C18 (250 mm × 4.6 mm),
5 µm column using a solvent system comprising of 75% acetonitrile and 25% methanol in an isocratic mode. The
mobile phase was filtered through a 0.45 μm membrane filter before analysis. Quantification of apocarotenoid
was done by considering the respective peak areas of standards at particular retention time versus concentration
and the values were expressed in mg g−1 of saffron stigmas.
Gas collection and N2O analysis. The closed chamber technique was used to collect gas samples for
N2O determination56,57. Air tight chambers, open from one end, of dimension 30 l × 30b × 90 h cm were made
of 8 mm thick glass. These were inverted over hollow steel cubical channels (15 cm in height with 5 cm open
cubic channel at the top, filled with water), and inserted 10 cm in the soil to make the system air tight. These
chambers were installed in all the plots. Gas samples were obtained using a 50 ml syringe having a hypodermic
needle through 3-way stopcock fitted over each syringe to make it a irtight58. In order to measure N
2O N fluxes,
the volume of the chambers was recorded. Nitrous oxide N concentration in gas samples was analyzed by gas
chromatography technique. Mean emission of N2O on the sampling days was interpolated linearly in succes-
sion to measure total N2O emission during the entire cropping season. A linear trend in N2O emission during
the no sampling days was c onsidered22. The gas sampling started during the first week of April, with fifteen day
intervals, up to last week of November with the assumption that N 2O emission during the remaining months is
Scientific Reports | (2021) 11:2488 | https://doi.org/10.1038/s41598-021-81739-x 9
Vol.:(0123456789)www.nature.com/scientificreports/
non-significant due to low temperature. Frequency of sampling was increased to four times in a fortnight during
the events of N fertilization.
The global warming potential (GWP) on a 100-year time horizon was determined for all the modes of N
fertilization using the equation developed by the Intergovernmental Panel on Climate Change (IPCC)59.
Nitrous oxide GWP kg CO2 eq. ha−1 = N2 O emission kg ha−1 ∗ 298.
a−1) = N2O–N (kg ha−1)*3.143).
(Where N2O emission (kg h
Leachate, runoff collection and nitrate analysis. Real soil column technique was used to collect lea-
chate and runoff. The soil was dug from four sides in a square pattern and a square column with 14 cm side
length was exposed. Glass chamber with sharp edges at the bottom, having ‘mm’ marking, was inverted over the
exposed column and was pushed down gently with slow thumping. Because of the sharp edges (at the bottom)
of the glass chamber, it goes gently downward and covers the whole exposed soil column. The soil column is
cut from the bottom gently with least soil disturbance and taken to the lab for leaching and runoff studies. The
glass chamber filled with soil column is put over a sieve, having a cone with filter paper in it. The cone opens
in a Leachate collection flask. A running chamber of 2 cm thickness is attached to the glass column to collect
the runoff. The running chamber is connected with a tube that opens in the runoff collection flask. The water
is added to soils as per the recommended schedule (in mm) and fertilization (weight basis) is made as per the
O3- concentration
treatments. The leachate and runoff are collected in the flasks and the liquid is analyzed for N
by Phenol Disulphonic Acid Method60.
XRD analysis and quantification of clay minerals. Clay minerals were studied using X-ray diffraction
technique61. Quantification of clay minerals was done by taking into account the peak area of XRDs at different
d-spacing.
Nitrogen use, accumulation efficiency and statistical analysis. Nitrogen concentration in corms
and the shoot was determined by Dumas total combustion method62. All plant tissue samples (leaf as well as
corm samples) were washed, oven-dried, ground, and analyzed for Nitrogen by the Dumas total combustion
method. Nitrogen use efficiency (NUE) was determined by using the formula.
NUE (%) = [{Nitrogen in shoot + corm (g k g−1) in treated plant—Nitrogen in control plant (g k g−1)} / Nitrogen
applied (kg ha−1)] × 100.
Whereas Nitrogen accumulation efficiency (NAE) was determined by the formula.
NAE (%) = [Nitrogen in shoot + corm (g kg−1)/ Nitrogen applied (kg h a−1)] × 100.
Statistical analyses were done using SPSS 16 software and MS Excel.
Received: 21 April 2020; Accepted: 14 December 2020
References
1. Liu, J. et al. A high-resolution assessment on global nitrogen flows in cropland. Proc. Natl. Acad. Sci. USA 107(17), 8035–8040
(2010).
2. Fagodiya, R. K., Pathak, H., Kumar, A., Bhatia, A. & Jain, N. Global temperature change potential of nitrogen use in agriculture:
A 50 year assessment. Sci. Rep. 7, 44928 (2017).
3. Sutton, M. A. et al. Too much of a good thing. Nature 472(7342), 159–161 (2011).
4. Fagodiya, R. K. et al. Simulation of maize (Zea mays L.) yield under alternative nitrogen fertilization using info-crop maize model.
Biochem. Cell. Arch. 17(1), 65–71 (2017).
5. Pathak, H., Jain, N., Bhatia, A., Kumar, A. & Chatterjee, D. Improved nitrogen management: A key to climate change adaptation
and mitigation. Indian J. Fert. 12, 151–162 (2016).
6. Padilla, F. M., Gallardo, M. & Manzano, F. A. Global trends in nitrate leaching research in the 1960–2017 period. Sci. Total. Environ.
1(643), 400–413 (2018).
7. Chatterjee, A. Extent and variation of nitrogen losses from non-legume field crops of conterminous United States. Nitrogen. 1,
34–51 (2020).
8. Smil, V. Nitrogen in crop production: An account of global flows. Glob. Biogeochem. Cycles. 13, 647–662 (1999).
9. Raun, W. R. & Johnson, G. V. Improving nitrogen use efficiency for cereal production. Agron. J. 91, 357–363 (1999).
10. Asghari, H. R. & Cavagnaro, T. R. Arbuscular mycorrhizas enhance plant interception of leached nutrients. Funct. Plant Biol. 38,
219–226 (2011).
11. WWAP-World water Assessment Program. The United Nations world water development report 3: Water in a changing world
2009: UNESCO and London: Earthscan (2009).
12. Siebert, S., Burke, J., Faures, J.M., Frenken, K., Hoogeveen, J., Doll, P. & Portmann, F.T. Hydrology and earth system sciences
discussion. Groundwater use for irrigation—A global inventory. pp 3977–4021 (2010).
13. Zhou, Z. A global assessment of nitrate contamination in groundwater. Internship report. IGRAC. 2, 1–27 (2015).
14. Haller, I., McCarthy, P., O’Brein, T., Riehle, J. & Stuhldreher, T. Nitrate pollution of ground water 2014: Alpha Water System INC
(2014).
15. Wadell, J. T. & Weil, R. R. Effects of fertilizer placement on solute leaching under ridge tillage and no tillage. Soil Tillage Res. 90,
194–204 (2006).
16. Sousa, M. R., Rudolph, D. L. & Frind, E. O. Threats to groundwater resources in urbanizing watersheds: The waterloo Moraine
and beyond. Can. Water Resour. J. 39, 2 (2014).
17. Uhlman, K. & Artiola, J. Nitrate contamination potential in Arizona groundwater: Implications of drinking water wells (The University
of Arizona Cooperative Extention, Arizona, 2011).
18. Bhatia, A., Jain, N. & Pathak, H. Methane and nitrous oxide emissions from Indian rice paddies, agricultural soils and crop residue
burning. Greenhouse Gas Sci. Technol. 2, 1–16 (2013).
19. Reay, D. S. et al. Global agriculture and nitrous oxide emissions. Nat. Clim. Change. 2(6), 410–416 (2012).
Scientific Reports | (2021) 11:2488 | https://doi.org/10.1038/s41598-021-81739-x 10
Vol:.(1234567890)www.nature.com/scientificreports/
20. Smith P., Bustamante, M., Ahammad, H., Clark, H., Dong, H. & Elsiddig, E.A. Agriculture, forestry and other land use (AFOLU).
In: Climate Change 2014: Mitigation of Climate Change. Contribution of Working Group III to the Fifth Assessment Report of
the Intergovernmental Panel on Climate Change [Edenhofer, O., R. PichsMadruga,Y. Sokona, E. Farahani, S. Kadner, K. Seyboth,
A. et al. (eds.)]. Cambridge University Press, Cambridge, United Kingdom and New York, NY, USA (2014).
21. Tian, H. et al. Global methane and nitrous oxide emissions from terrestrial ecosystems due to multiple environmental changes.
Ecosyst. Health Sustain. 1(1), 1–20 (2015).
22. Bhatia, A. et al. Methane and nitrous oxide emissions from soils under direct seeded rice. Int. J. Agric. Stat. Sci. 9, 729–736 (2013).
23. Bhattacharyya, R. et al. Aggregate associated N and global warming potential of conservation agriculture based cropping of maize-
wheat system in the north-western Indo-Gangetic plains. Soil Tillage Res. 182, 66–77 (2018).
24. Mina, U., Kumar, R., Gogoi, R., Bhatia, A., Harit, R.C., Singh, D., Kumar, A. & Kumar, A. Effect of elevated temperature and carbon
dioxide on maize genotypes health index. Ecol. Indicat.. (2017).
25. Coyne, M. S. & Ren, W. Managing nitrous oxide emissions in agricultural fields. Plant Soil Sci. Res. Rep. 9, 2 (2017).
26. Khanali, M., Movahedi, M., Yousefi, M., Jahangiri, S. & Khoshnevisan, B. Investigating energy balance and carbon foot print in
saffron cultivation—a case study in Iran. J. Clean. Prod. 115, 162–171 (2016).
27. Husaini, A. Challenges of climate change: Omics-based biology of saffron plants and organic agricultural biotechnology for sus-
tainable saffron production. GM Crops Food. 5, 2 (2014).
28. Gupta, D. K. et al. Economic analysis of different greenhouse gas mitigation technologies in rice-wheat cropping system of Indo-
gangetic plains. Curr. Sci. 110(5), 867–873 (2016).
29. Gupta, D. K. et al. Mitigation of green house gas emissions from rice-wheat system of the Indo-gangetic plains: Through tillage,
irrigation and fertilizer management. Agric. Ecosyst. Environ. 230, 1–9 (2016).
30. Gupta, D. K. et al. Global warming potential of rice (Oryza sativa)-wheat (Triticum aestivum) cropping system of the Indo-gangetic
plains. Ind. J. Agric. Sci. 85(6), 807–816 (2015).
31. Mahler, R.L. Fertilizer placement (CIS747). Cooperative Extension System, IAES, University of Idaho, Moscow. 83844 (2001).
32. Jones, C. Crop and fertilizer management practices to minimize nitrate leaching. Publication by Montana State University (exten-
tion) 1217SA. (2017).
33. Marble, S. C. et al. Effects of fertilizer placement on trace gas emissions from nursery container production. Hort Sci 2, 2 (2012).
34. Rees, R. M. et al. The effect of fertilizer placement on nitrogen uptake and yield of wheat and maize in Chinese loess soils. Nutr.
Cycl. Agroecosyst. 47(1), 81–91 (1996).
35. Gaihre, Y. K. et al. Nitrous oxide and nitric oxide emissions and nitrogen use efficiency as affected by nitrogen placement in lowland
rice fields. Nutr. Cycl. Agroecosyst. 110(2), 277–291 (2017).
36. Wang, S. J., Luo, S. S., Yue, S. C., Shen, Y. F. & Li, S. Q. Fate of 15N fertilizer under different nitrogen split applications to plastic
mulched maize in semiarid farmland. Nutr. Cycl. Agroecosyst. 105, 129–140 (2016).
37. Zhu, Z. & Chen, D. Nitrogen fertilizer use in China-contributions to food production, impacts on the environment and best
management strategies. Nutr. Cycl. Agroecosyst. 63, 117–127 (2002).
38. Davidson, E. A. The Contribution of manure and fertilizer nitrogen to atmospheric nitrous oxide since 1860. Nat. Geosci. 2, 659–662
(2009).
39. Mohammad, M., Amiri, M. E. & Sharghi, Y. Respond of saffron (Crocus sativus L.) to animal manure application. J. Med. Plants
Res. 6(7), 1323–1326 (2020).
40. Blackshaw, R. E., Molnar, L. J. & Janzen, H. H. Nitrogen fertilizer timing and application method affect weed growth and competi-
tion with spring wheat. Weed Sci. 52(5), 614–622 (2004).
41. Blackshaw, R. E., Semach, G. & Janzen, H. H. Fertilizer application method affects nitrogen uptake in weeds and wheat. Weed Sci.
50(1), 634–641 (2002).
42. Cochran, V. L., Morrow, L. A. & Schirman, R. D. The effect of N placement on grassweeds and winter wheat responses in three
tillage systems. Soil Tillage Res. 18(4), 347–355 (1990).
43. Bhagirath, S. C. & Abugho, S. B. Fertilizer placement affects weed growth and grain yield in dry-seeded rice (Oryza sativa L.)
systems. Am. J. Plant Sci. 4(6), 1–5 (2013).
44. Sanaeinejad, S.H. & Hosseini, S.N. In IFIP International Federation for Information Processing, Volume 293, Computer and
Computing Technologies in Agriculture II, Volume I, eds. D. Li. Z. Chunjiang, (Boston: Springer), 509–518 (2009).
45. Behdani, M. A., Al-Ahmadi, M. J. & Fallahi, H. R. Biomass prediction during life cycle of saffron (Crocus sativus) using regression
models. J. Crop Sci. Biotechnol. 19(1), 71–76 (2016).
46. Nash, P., Matavalli, P. & Nelson, K. Nitrous oxide emissions from claypan soils due to nitrogen fertilizer source and tillage/fertilizer
placement practices. Soil Sci. Soc. Am. J. 76(3), 983–993 (2012).
47. Sharma, A., Arora, S., Jalali, V. K., Verma, V. S. & Singh, B. Nonexchangeable potassium displacement in relation to potassium
availability to rainfed maize under nitrogen fertilization. Commun. Soil Sci. Plant Anal. 43(15), 2050–2061 (2012).
48. Lindgreen, H. Ammonium fixation during illite–smectite diagenesis in upper Jurassic Shale. North Sea. Clay Miner. 29, 527–537
(1994).
49. Mohanty, S. K. & Singh, T. A. Fundamentals of Soil Science (Indian Society of Soil Science, New Delhi, 2002).
50. Sepaskhah, A., Dehbozorgi, F. & Kamgar, H. A. Optimal irrigation water and saffron corm planting intensity under two cultivation
practices in a semi-arid region. Biosyst. Eng. 101, 452–462 (2008).
51. Kumar, R. & Sharma, O. C. Enhancing saffron (Crocus sativus) productivity by land configuration and corm intensity manipulation
under Kashmir condition. Indian J. Agric. Sci. 88(5), 798–804 (2018).
52. Kumar, R. & Sharma, O. C. Saffron (Crocus sativus L.) growth and yield as influenced by organic farming practices. J. Agric. Ecol.
4, 25–32 (2017).
53. Mir, J. I. et al. Morphological and biochemical variants of saffron-potential candidates for crop improvement. J. Cell Tissue Res.
16(1), 1–8 (2016).
54. Tarantilis, P. A., Tsoupras, G. & Polissiou, M. Determination of saffron components in crude plant extract using HPLC-UV-visible
PDA detection mass spectrometry. J. Chromatogr. A 699, 107–117 (1995).
55. Lozano, P., Casteller, M. R., Simancas, M. J. & Iborra, J. A quantitative HPLC method to analyse commercial saffron products. J.
Chromatogr. 830, 477–483 (1999).
56. Bhatia, A. et al. Effect of elevated tropospheric ozone on methane and nitrous oxide emission from rice soil in north India. Agric.
Ecosyst. Environ. 144, 21–28 (2011).
57. Malyan, S. K. et al. Methane production, oxidation and mitigation: A mechanistic understanding and comprehensive evaluation
of influencing factors. Sci. Tot. Environ. 572, 874–896 (2016).
58. Bhatia, A., Pathak, H., Jain, N., Singh, P. K. & Tomar, R. Green house gas mitigation in rice wheat system with leaf color chart
based urea application. Environ. Monit. Assess. 184, 3095–3107 (2012).
59. IPCC. Climate change 2013: the physical science basis. In Stocker, T.F., Qin, D., Plattner, G.K., Tignor, M., Allen, S.K., Boschung,
J., Nauels, A., Xia, Y., Bex, V., Midgley, P.M (Eds). Assessment report of IPCC, Cambridge University Press, Cambridge, United
Kingdom and New York, NY, USA. pp 1535 (2013).
60. Gupta, P.K. Soil, plant, water and fertilizer analysis. Published by AGROBIOS (INDIA). 136–148 (2007).
61. Jackson, M. L. Soil Chemical Analysis—Advance Course (University of Wisconsin, Madison, 1975).
Scientific Reports | (2021) 11:2488 | https://doi.org/10.1038/s41598-021-81739-x 11
Vol.:(0123456789)www.nature.com/scientificreports/
62. Tandon, H.L.S. Methods of analysis of soils, plants, water and fertilizers. Ed. Fertilizers development and consultation organization,
New Delhi, India. 144 (1993).
Author contributions
A.S. and S.K. conceived, designed and led the study. A.S., O.C.S. and S.K. assembled the data. A.S., S.A.K. and
A.K. carried out nitrous oxide emission studies. A.S., J.I.M. and D.B.S. analyzed the data and did the interpreta-
tions A.S. and S.A. wrote the manuscript.
Competing interests
The authors declare no competing interests.
Additional information
Correspondence and requests for materials should be addressed to A.S.
Reprints and permissions information is available at www.nature.com/reprints.
Publisher’s note Springer Nature remains neutral with regard to jurisdictional claims in published maps and
institutional affiliations.
Open Access This article is licensed under a Creative Commons Attribution 4.0 International
License, which permits use, sharing, adaptation, distribution and reproduction in any medium or
format, as long as you give appropriate credit to the original author(s) and the source, provide a link to the
Creative Commons licence, and indicate if changes were made. The images or other third party material in this
article are included in the article’s Creative Commons licence, unless indicated otherwise in a credit line to the
material. If material is not included in the article’s Creative Commons licence and your intended use is not
permitted by statutory regulation or exceeds the permitted use, you will need to obtain permission directly from
the copyright holder. To view a copy of this licence, visit http://creativecommons.org/licenses/by/4.0/.
© The Author(s) 2021
Scientific Reports | (2021) 11:2488 | https://doi.org/10.1038/s41598-021-81739-x 12
Vol:.(1234567890)You can also read