Fast Open-Source Toolkit for Water T2 Mapping in the Presence of Fat From Multi-Echo Spin-Echo Acquisitions for Muscle MRI - Frontiers
←
→
Page content transcription
If your browser does not render page correctly, please read the page content below
ORIGINAL RESEARCH
                                                                                                                                                published: 26 February 2021
                                                                                                                                            doi: 10.3389/fneur.2021.630387

                                               Fast Open-Source Toolkit for Water
                                               T2 Mapping in the Presence of Fat
                                               From Multi-Echo Spin-Echo
                                               Acquisitions for Muscle MRI
                                               Francesco Santini 1,2*, Xeni Deligianni 1,2 , Matteo Paoletti 3 , Francesca Solazzo 3 ,
                                               Matthias Weigel 1,4,5 , Paulo Loureiro de Sousa 6 , Oliver Bieri 1,2 , Mauro Monforte 7 ,
                                               Enzo Ricci 7,8 , Giorgio Tasca 7 , Anna Pichiecchio 3,9† and Niels Bergsland 10,11†
                                               1
                                                 Division of Radiological Physics, Department of Radiology, University Hospital of Basel, Basel, Switzerland, 2 Department of
                                               Biomedical Engineering, University of Basel, Allschwil, Switzerland, 3 Advanced Imaging and Radiomics Center,
                                               Neuroradiology Department, IRCCS Mondino Foundation, Pavia, Italy, 4 Translational Imaging in Neurology (ThINk) Basel,
                                               Department of Biomedical Engineering, University Hospital Basel and University of Basel, Allschwil, Switzerland, 5 Neurologic
                                               Clinic and Policlinic, Departments of Medicine, Clinical Research and Biomedical Engineering, University Hospital Basel and
                                               University of Basel, Basel, Switzerland, 6 ICube, Université de Strasbourg, Centre National de la Recherche Scientifique
                              Edited by:       (CNRS), Strasbourg, France, 7 Unità Operativa Complessa di Neurologia, Fondazione Policlinico Universitario A. Gemelli
                           Itamar Ronen,       IRCCS, Rome, Italy, 8 Dipartimento di Neuroscienze, Istituto di Neurologia, Università Cattolica del Sacro Cuore, Rome, Italy,
                Leiden University Medical      9
                                                 Department of Brain and Behavioral Sciences, University of Pavia, Pavia, Italy, 10 Department of Neurology, Buffalo
                     Center, Netherlands       Neuroimaging Analysis Center, Jacobs School of Medicine and Biomedical Sciences, University at Buffalo, The State
                       Reviewed by:            University of New York, Buffalo, NY, United States, 11 Fondazione Don Carlo Gnocchi Onlus (IRCCS), Milan, Italy
                    Dominik Weidlich,
                Technical University of
                    Munich, Germany
                                               Imaging has become a valuable tool in the assessment of neuromuscular diseases, and,
                         Doris Leung,          specifically, quantitative MR imaging provides robust biomarkers for the monitoring of
             Kennedy Krieger Institute,        disease progression. Quantitative evaluation of fat infiltration and quantification of the T2
                        United States
                                               values of the muscular tissue’s water component (wT2) are two of the most essential
                  *Correspondence:
                    Francesco Santini          indicators currently used. As each voxel of the image can contain both water and
          francesco.santini@unibas.ch          fat, a two-component model for the estimation of wT2 must be used. In this work,
      † These   authors have contributed       we present a fast method for reconstructing wT2 maps obtained from conventional
                     equally to this work      multi-echo spin-echo (MESE) acquisitions and released as Free Open Source Software.
                                               The proposed software is capable of fast reconstruction thanks to extended phase
                    Specialty section:
          This article was submitted to        graphs (EPG) simulations and dictionary matching implemented on a general-purpose
                Applied Neuroimaging,          graphic processing unit. The program can also perform more conventional biexponential
                a section of the journal
                                               least-squares fitting of the data and incorporate information from an external water-fat
                 Frontiers in Neurology
                                               acquisition to increase the accuracy of the results. The method was applied to the scans
        Received: 17 November 2020
         Accepted: 05 February 2021            of four healthy volunteers and five subjects suffering from facioscapulohumeral muscular
        Published: 26 February 2021            dystrophy (FSHD). Conventional multi-slice MESE acquisitions were performed with 17
                                Citation:      echoes, and additionally, a 6-echo multi-echo gradient-echo (MEGE) sequence was used
      Santini F, Deligianni X, Paoletti M,
   Solazzo F, Weigel M, de Sousa PL,
                                               for an independent fat fraction calculation. The proposed reconstruction software was
Bieri O, Monforte M, Ricci E, Tasca G,         applied on the full datasets, and additionally to reduced number of echoes, respectively,
Pichiecchio A and Bergsland N (2021)
                                               to 8, 5, and 3, using EPG and biexponential least-squares fitting, with and without
Fast Open-Source Toolkit for Water T2
 Mapping in the Presence of Fat From           incorporating information from the MEGE acquisition. The incorporation of external fat
 Multi-Echo Spin-Echo Acquisitions for         fraction maps increased the robustness of the fitting with a reduced number of echoes
                             Muscle MRI.
              Front. Neurol. 12:630387.
                                               per datasets, whereas with unconstrained fitting, the total of 17 echoes was necessary
      doi: 10.3389/fneur.2021.630387           to retain an independence of wT2 from the level of fat infiltration. In conclusion, the

Frontiers in Neurology | www.frontiersin.org                                           1                                         February 2021 | Volume 12 | Article 630387
Santini et al.                                                                                                                            Fast Water T2 Fitting

                                               proposed software can successfully be used to calculate wT2 maps from conventional
                                               MESE acquisition, allowing the usage of an optimized protocol with similar precision and
                                               accuracy as a 17-echo acquisition. As it is freely released to the community, it can be
                                               used as a reference for more extensive cohort studies.
                                               Keywords: MRI, neuromuscular diseases, relaxometry, free open source software, water T2 relaxation time, fat
                                               water imaging

INTRODUCTION                                                                         spin-echo sequence for the quantification, which is broadly
                                                                                     available and therefore does not require any particular sequence
Neuromuscular disorders encompass genetic and acquired                               modification or hardware. In recent years, this method has been
diseases of lower motor neurons, peripheral nerves,                                  extensively used for wT2 quantification in several studies (18–
neuromuscular junction, or skeletal muscle, generally causing                        22). Although there are small differences in the exact protocol
different degrees of motor impairment in the affected patients.                      used depending on the MR scanner vendor, the differences in the
In particular, muscular dystrophies are hereditary degenerative                      implementation of the fitting process can be more substantial.
disorders of skeletal muscles, causing progressive replacement of                        As a result of the EPG fitting, a relatively precise estimation
muscle tissue by fat. This happens through disparate pathological                    of the fat fraction is also obtained. The resulting fat fractions
processes and molecular mechanisms that are, at least to some                        approximate the results of a three-point Dixon acquisition, which
extent, disease-specific and related to the peculiar genetic defect                  has been proven to differentiate well between patients of various
that characterizes each of them (1).                                                 neuromuscular diseases and healthy subjects (16, 23). However,
    However, some of these broad pathological processes                              fat fraction estimation is not the primary quantitative target of
are shared by most muscular dystrophies. They can be                                 this method, and it can be an issue when accurate fat fraction
followed on muscle imaging as an early phase of muscle                               maps are needed, as weighting factors [such as magnetization
damage and intramuscular edema, often corresponding to                               transfer effects in multi-slice MESE acquisitions (24–26)] can
inflammatory/necrotic changes (2, 3), and subsequent stages                          bias the estimation. An alternative approach to obtain this
characterized by progressive deposition of fat and connective                        information is to use a dedicated sequence (usually based on
tissue (4–6). Different pathological processes are generally                         small flip-angle multi-echo gradient-echo imaging) for a purely
present simultaneously in the same patient or even in the same                       proton-density-weighted fat fraction estimation. This approach
muscle group.                                                                        also allows using more accurate fat models that incorporate the
    The good soft tissue characterization capabilities of MRI can                    complex chemical composition of fat (27). In practice, a typical
be exploited to quantify the status of these ongoing processes                       muscle MRI examination usually comprises a dedicated volume
in the muscle; for example, global T2 contrast can be used to                        acquisition for single muscle identification (segmentation) and
highlight edema, and fat/water separation methods can show                           for accurate fat fraction acquisition.
fat infiltration.                                                                        In this work, we build upon this concept to present a fast and
    When moving toward quantitative imaging, global T2,                              open software for wT2 fitting, which can be used as a reference
extracted by a monoexponential fitting is a sensitive disease                        implementation for reproducibility studies. The postprocessing
indicator when fat infiltration is not present. However, in                          performance is optimized by the usage of GPU processing and the
neuromuscular diseases where adipocytes significantly replaced                       creation of a dictionary (of adjustable size) of simulated signals
muscular tissue, it highly correlates with the fat content of                        incorporating slice profile information (14, 28). Additionally, this
the muscle. In this case, it is therefore rather an indicator of                     work further extends the initial concept as it implements multiple
long-term changes in the musculature, albeit an indirect one                         fitting methods for the wT2 estimation, and it can incorporate
with respect to fat fraction quantification; conversely, the T2                      the information coming from a separate fat/water acquisition (of
relaxation of the water component of the tissue (wT2) well                           arbitrary resolution and field of view) to constrain the fitting.
correlates with acute “disease activity” (7).                                        With this constraint, the possibility of reducing the number of
    Various acquisition methods have been proposed to quantify                       acquired echoes for the fitting (thus reducing the scan time) is
wT2 independently of fat infiltration (8–15). In current clinical                    also analyzed.
practice, multi-echo spin-echo (MESE) sequences are typically
used, and various types of exponential fitting (biexponential,
triexponential) are used for T2 calculation (16, 17). However,
these methods are sensitive to multiple confounding factors, such
                                                                                     MATERIALS AND METHODS
as B1 inhomogeneities.                                                               Software Implementation
    Marty et al. (14) presented a method based on an extended                        A stand-alone, command-line application was developed
phase graph (EPG) fitting that addresses many of these issues.                       in Python, using standard mathematical extension libraries
Besides, in contrast to other methods such as the ones proposed                      (NumPy, SciPy) and, for hardware acceleration, the pycuda
by Klupp et al. (12), Sousa et al. (11), or Koolstra et al. (13), the                extension for interfacing with the general-purpose graphical
EPG-based approach has the advantage of using a conventional                         processing unit.

Frontiers in Neurology | www.frontiersin.org                                     2                                   February 2021 | Volume 12 | Article 630387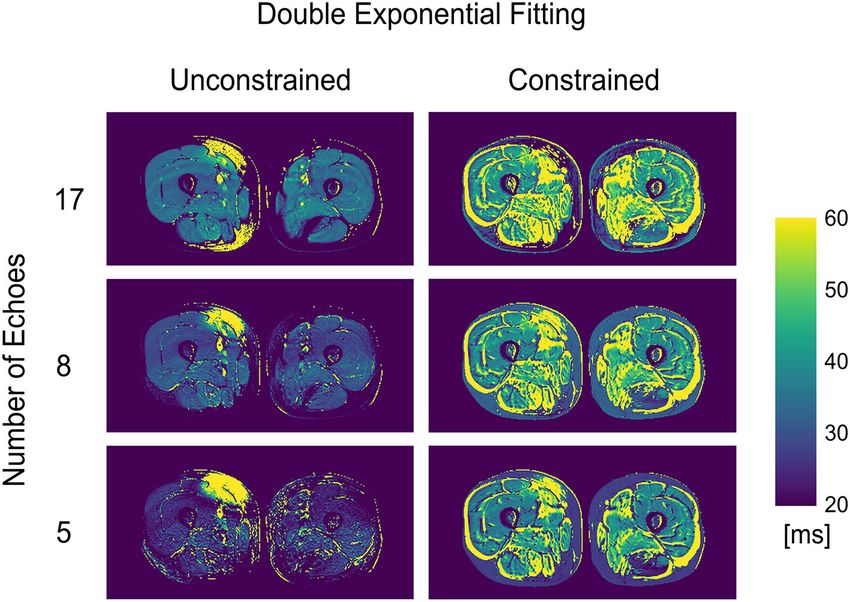
Santini et al.                                                                                                                Fast Water T2 Fitting

    The core of the application consists of a fast, GPU-accelerated       3T MR scanner (MAGNETOM Skyra, Siemens Healthcare,
implementation of signal simulation based on the extended phase           Erlangen, Germany) equipped with an 18-channel body array
graph concept (29, 30). As the method is intended for multi-echo          coil and integrated spine coil with the following acquisition
spin-echo acquisitions, a Carr-Purcell-Meiboom-Gill (CPMG)                parameters: number of echoes 17, number of slices 7, TR
(31, 32) simulation is performed at every run of the program,             4,100 ms, first TE and echo spacing 10.9 ms, bandwidth 250
adapting the timing and the number of echoes to the actual                Hz/px, matrix size 192 × 384, resolution 1.2 × 1.2 mm2 , slice
sequence parameters. The slice profile of the radiofrequency              thickness 10 mm, gap between slices 30 mm.
pulses is taken into account in the simulation, assuming                      For fat fraction quantification, a 3D multi-echo gradient-
hanning-windowed sinc pulses. The slice profile is calculated             echo (MEGE) acquisition using a custom sequence was prepared
through the application of a Shinnar-LeRoux transform (33)                with the following parameters: number of echoes 6, TR 35 ms,
and the slice width of the refocusing pulse is assumed to                 first TE/echo spacing 1.7/1.5 ms, flip angle 7◦ , bandwidth 1,050
be a factor of 1.2 larger than the excitation pulse, as per               Hz/px, matrix size 396 × 432 × 52, resolution 1.0 × 1.0 × 5.0
characteristics of the pulse sequence of the used MR scanner.             mm3 . The sequence had a monopolar readout with interleaved
For different vendors and acquisition protocols, the user can             echo spacing (even and odd echoes acquired in subsequent
provide custom slice profiles and refocusing width factors as             repetitions). The acquired images were postprocessed with the
parameters to the program. The simulation logic is directly               publicly-available algorithm FattyRiot (27) to obtain the fat
written in GPU-specific C++ language for maximum efficiency.              fraction maps.
Thanks to the high parallelization of the GPU tasks, signals
corresponding to multiple combinations of wT2, fat fraction,              Human Experiments
and B1 inhomogeneity factors can be simulated concurrently and            The acquisitions described above were performed on the thighs
placed in a dictionary, whose size can be chosen by the user. The         of 5 (three male, median age 46 y, range 29–61 y) subjects with
fat model is assumed to have a single spectral peak with a fixed          diagnosed facioscapulohumeral muscular dystrophy (FSHD),
T2 value, which can either be given a priori or estimated from the        which is a particular form of muscular dystrophy characterized by
input data. T1 values for both water and fat are assumed to be            progressive muscle wasting and fatty replacement often preceded
constant (1,400 and 365 ms, respectively), as in (14).                    by muscle edema on MRI (34), and of four subjects without a
    Subsequently, the time course of each voxel in the input              history of neuromuscular diseases (two male, median age 54.5 y,
series is compared to each entry in the dictionary by using               range 26–72 y). The acquisitions were performed according to the
the correlation metric. The parallelization of the GPU is again           local ethics regulations and informed consent was obtained from
leveraged in this step, as the correlation operation is equivalent        the participants.
to the following matrix multiplication:
                                                                          Data Analysis
                                 C=S×D                                    The computer used for the postprocessing is a current mid-range
                                                                          personal computer (Ryzen 2600, Advanced Micro Devices, Santa
where S is the signal matrix, having a separate voxel on each             Clara, CA, equipped with 32GB of RAM and a GeForce 1060
row and time in the column direction; D is the dictionary                 GPU, NVIDIA corporation, Santa Clara, CA).
matrix, having time in the row direction and dictionary entries               The proposed algorithm was applied to the MESE acquisition
in the row directions; C is the result matrix holding the signal          after generation of a dictionary containing 60 linearly spaced
correlations with the dictionary. After multiplication, the index         values for wT2 (range 20–80 ms), 20 values for B1 factor (range
of the maximum value of each column identifies the parameter              40–140%), and 101 values for the fat fraction (range 0–100%),
combination that best fits the measured signal.                           for a total of 121,200 parameter combinations. The fat T2
    The above procedure describes the unconstrained fitting.              was estimated from a subsample of the subjects (through a
When an externally derived fat fraction map is also provided, it          single-component EPG fitting in regions of subcutaneous fat)
is aligned (based on the slice orientation and position) with each        and subsequently assumed constant at 151 ms. Maps derived
slice of the original spin-echo data. The information is then taken       from EPG and double exponential fitting, with and without the
into account by restricting the maximum search to the given fat           constraint of the external proton-density-weighted fat fraction
fraction for each voxel.                                                  as calculated from the MEGE acquisition, were produced (an
    In addition to EPG fitting, the software can also perform             overview of the assumed and fitted parameters for each method is
double-exponential fitting. This fitting can neither correct for B1       given in Table 1). The fitting was repeated by discarding later spin
inhomogeneity nor slice profile and is meant to be used when the          echoes (and only retaining 8, 5, or 3) to evaluate the robustness
EPG fitting is unstable or the true slice profile is not known.           of the algorithm with respect to the number of echoes.
    The code is released under a free software license (GNU                   Regions of interest (ROIs) were manually drawn by one reader
General Public License v3) at the website: https://www.github.            bilaterally on every MESE slice over the cross section of the
com/fsantini/MyoQMRI.                                                     following muscles: Vastus Lateralis (VM), Vastus Medialis (VM),
                                                                          Rectus Femoris (RF).
Acquisition Protocol                                                          The average and standard deviation for wT2 values and
A conventional 2D multi-slice multi-echo spin-echo (MESE)                 fat fraction were extracted, and the following indicators
acquisition protocol was prepared for a commercial whole-body             were calculated:

Frontiers in Neurology | www.frontiersin.org                          3                                  February 2021 | Volume 12 | Article 630387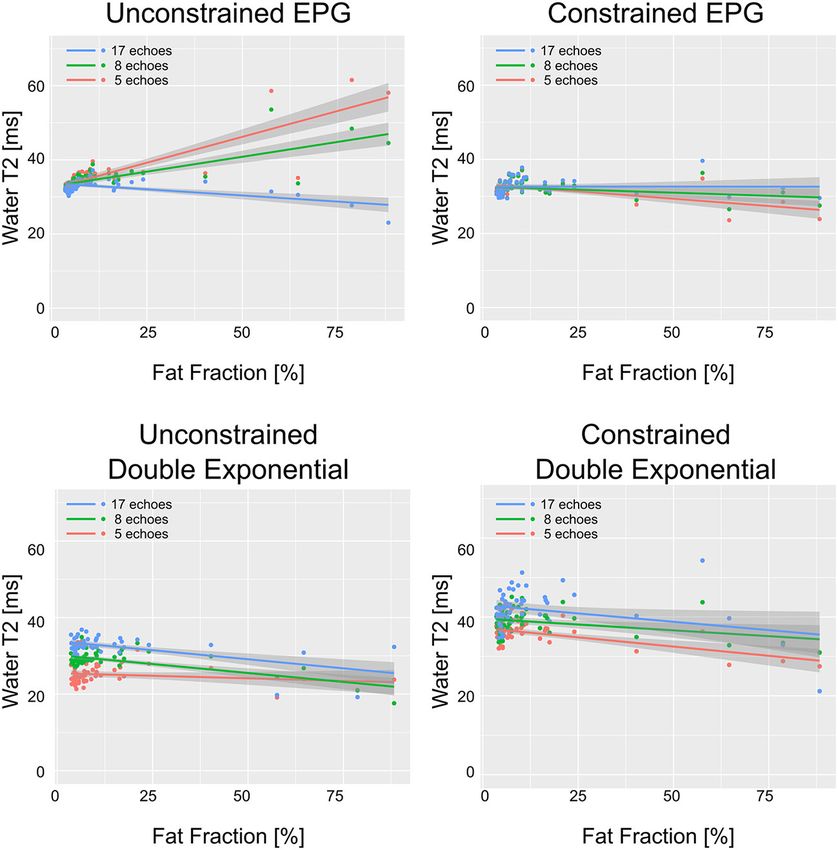
Santini et al.                                                                                                                                                    Fast Water T2 Fitting

TABLE 1 | Overview of the presented fitting methods.

Method                                                               Constrained variables                                                                        Fitted parameters

EPG unconstrained                                                    Water T1, Fat T1, Fat T2, Slice profile                                                      wT2, Fat Fraction, B1
EPG constrained                                                      Water T1, Fat T1, Fat T2, Slice profile, Fat Fraction (voxelwise from MEGE)                  wT2, B1
Double exponential unconstrained                                     Fat T2                                                                                       wT2, Fat Fraction
Double exponential constrained                                       Fat T2, Fat Fraction (voxelwise from MEGE)                                                   wT2

• Average error between fat fraction calculated from MESE and                                           However, the visualization was done on the original fat fraction
  the one deriving from MEGE (considered the “gold standard”)                                           axis (0–100%) for ease of interpretation.
  - only for nonconstrained reconstructions, calculated as:                                                In addition, correlation of repeated measurements (rmcorr
                                                                                                        function) instead of the standard Pearson coefficient was used
          ERRff = mean (FFMESE ) − mean (FFMEGE ) ,                                                     to compensate for dependence of measurements of the same
                         pop,subj,roi                       pop,subj,roi
                                                                                                        subject. In this case the subject is introduced as a variable and
                                                                                                        both wT2 and fat fraction are considered as measures.
   where           mean         represents the averaging operation over the
                 pop,subj,roi
  whole population, over all ROIs of each subject, and over the                                         Validation
  voxels of each ROI.                                                                                   In order to evaluate the absolute accuracy of the fitting method,
• Pooled standard deviation across the ROIs—this indicator                                              the same data was analyzed using the EPG wT2 fitting procedure
  is similar to an “average of the standard deviations,” and it                                         of the QMRTools software package (36). The slice profile was
  indicates the variability of the fitted wT2 values over a small                                       adapted to match the one used in the current acquisitions and
  spatial region; it is related to noise or tissue inhomogeneities                                      the fitting was applied to the full 17-echo dataset.
  due to disease activity and is calculated as follows:                                                    The same ROIs as in the previous analysis were considered,
                                        s                                                               and the average wT2 in each ROI was calculated and compared
                                                                                                        to the corresponding ROI of our method. Average and standard

                         SDpooled =          mean             sd2 (T2 )            ,                    deviation of the errors were calculated, and the agreement was
                                             pop,subj          roi
                                                                                                        visualized in a Bland-Altman plot.
   where sd2 represents the squared standard deviation over
                  roi
  each ROI.                                                                                             RESULTS
• Standard deviation of the averages over the ROIs (hereby
                                                                                                        The software fitted the MESE datasets with EPG dictionary
  termed “intrasubject standard deviation”) - this indicator
                                                                                                        matching in an average time of 2 s/slice, plus 12 s per dataset for
  relates to the variability over larger areas, for example arising
                                                                                                        the generation of the dictionary (operation performed at every
  from field inhomogeneity, and is calculated as follows:
                                                                                                        run of the program, which was faster than caching the results to
                                        s                                                           disk). The double exponential fitting was not GPU-optimized and
                 SDintrasubject =           mean         sd2        mean (T2 )                          took 390 s (6 m 30 s) per slice.
                                             pop         subj        roi                                   Exemplary outputs from an unconstrained 17-echo
                                                                                                        reconstruction for a patient and a volunteer are shown in
  This indicator was only calculated in the volunteer cohort,                                           Figure 1. No noticeable artifacts are visible in the wT2 and fat
  because patients might have variability in the wT2 values due                                         fraction maps, whereas the B1 maps show some inconsistencies,
  to their pathology.                                                                                   mostly located in the fascia, thus remaining mostly masked in
• Global average wT2 for patients and control groups, calculated                                        the other maps.
  as follows:                                                                                              WT2 maps had a homogeneous appearance with EPG
                                                                                                      matching both for 17 and 8 echoes (Figure 2). However, the
      meanT2,(patients|controls) = mean       mean (T2 )                                                unconstrained reconstruction showed a noticeable difference in
                                                   patients|controls       subj,roi                     quantitative values in areas with heavy fat infiltration, whereas

                                                                                                        the fat-fraction-constrained reconstructions appeared similar
                 sdT2,(patients|controls) =                sd                  mean (T2 )
                                                   patients|controls           subj,roi                 between 17, 8, and 5 considered echoes. The visual quality of the
                                                                                                        map was insufficient in any combination when only three echoes
Statistical analysis was performed with R (35). To quantify                                             were used for the reconstruction (Figure 2). Quantitatively,
the influence of the fat fraction on the fitting of wT2, the                                            it can be observed that a reduced number of echoes in the
correlation between the average fat fraction and the average wT2                                        unconstrained fitting has an effect on wT2 fitting when fat
for each ROI was calculated. For the calculation of the correlation                                     infiltration is present, resulting in a highly significant positive
coefficients the log-transformed fat fractions were used to                                             correlation (p < 0.001) for EPG fitting with 5 and 8 echoes
compensate for the skewness of the fat fraction distribution.                                           (correlation coefficient r = 0.73 and 0.61, respectively, Figure 3).

Frontiers in Neurology | www.frontiersin.org                                                        4                                        February 2021 | Volume 12 | Article 630387
Santini et al. Fast Water T2 Fitting FIGURE 1 | Parameter maps derived from an unconstrained 17-echo EPG dictionary matching for an FSHD patient (top row) and a healthy volunteer (bottom row). The rightmost panel is the registered fat fraction map deriving from a multi echo gradient echo acquisition (MEGE) for reference. FIGURE 2 | wT2 maps for an FSHD patient using a varying number of acquired echoes by EPG simulation with and without an external fat fraction map as a reconstruction constraint. Conversely, the correlation was significantly negative (r = −0.71, fraction was always negative and significant (p = 0.02 for the p < 0.001) for the unconstrained fitting with 17 echoes, and for constrained 8 and 17 echoes, p < 0.001 otherwise) in all cases the constrained fitting of 5 and 8, but not 17 echoes (r = −0.60, except, notably, the unconstrained fitting of five echoes (p = −0.41, −0.19; p < 0.001, p = 0.005, 0.2, respectively). 0.29), with negative correlation coefficients ranging from r = The double exponential fitting showed decreased wT2 with −0.34 for the constrained 8-echo reconstruction to r = −0.62 any number of echoes when unconstrained fitting was used, for the unconstrained 8-echo reconstruction (Figure 3). in addition to artifacts arising from B1 inhomogeneities (see According to the quantitative quality metrics (Table 2), Figure 4 and Table 2). Correlation between wT2 and the fat considering a higher number of echoes improved both the noise Frontiers in Neurology | www.frontiersin.org 5 February 2021 | Volume 12 | Article 630387
Santini et al.                                                                                                                                        Fast Water T2 Fitting

  FIGURE 3 | wT2 values over each ROI vs. fat fraction in the same ROI, for all ROIs drawn in patients and healthy volunteers. The solid lines represent the linear
  regression with shaded gray areas indicating the 95% confidence intervals.

(pooled standard deviation) and the homogeneity across the                               DISCUSSION
ROIs for each subject (intrasubject variability). For a reduced
number of echoes, the constrained reconstruction retained good                           In this work, we presented a software application that can
homogeneity down to five considered echoes for the EPG                                   quickly and reliably calculate wT2 maps in the presence of
reconstruction (3.1 ms for the constrained case vs. 6.7 for the                          spectrally inhomogeneous voxels containing both non-fatty
unconstrained). The double exponential fitting showed good                               tissue and lipids, while at the same time estimating fat fraction
homogeneity (intrasubject standard deviation ranging from 2.7                            from conventional multi-echo spin-echo acquisitions. This
to 4.6 milliseconds), but more noise (pooled standard deviation                          work follows the concept introduced by Marty et al. (14).
ranging from 5.9 to 10.5 ms).                                                            Still, it additionally provides the possibilities of performing
   The constrained reconstruction resulted in a generally higher                         double exponential (and, optionally, single exponential) fitting
pooled standard deviation due to the artifacts introduced by the                         and, more interestingly, of incorporating external fat fraction
misregistration of the images.                                                           information to improve the accuracy of the fitting. There are
   The accuracy of the wT2 values was close to the QMRTools                              no specific hardware requirements for this program; however,
implementation, showing an average difference of 0.9 ms (5.2 ms                          for better performance, a reasonable Cuda-compatible graphic
standard deviation, Figure 5).                                                           card should be used. Consumer-grade GPUs deliver good
   Concerning the fat fraction accuracy, although it is not the                          performance, but more extensive dictionaries than the one tested
primary focus of this method, the EPG matching resulted in                               in this current setup require increased memory on the device.
consistent underestimation compared to the FattyRiot algorithm,                          The code is released with a free open source license and, in
with a larger number of echoes providing results which were                              contrast to existing available implementations (36), this software
closer in average to the gold standard (from −4.2 percentage                             package is exclusively based on free software and is platform-
points (p.p.) for 17 echoes to -7.8 p.p. for eight echoes). The                          independent. This implementation can thus be considered ready
double exponential fitting provided an overestimation ranging                            to be widely used in a clinical research context and as a reference
from +3.2 p.p. for 17 echoes to +8.6 p.p. for five echoes.                               by other researchers.

Frontiers in Neurology | www.frontiersin.org                                         6                                         February 2021 | Volume 12 | Article 630387
Santini et al.                                                                                                                                                     Fast Water T2 Fitting

  FIGURE 4 | wT2 maps for an FSHD patient using a varying number of acquired echoes by double exponential fitting with and without an external fat fraction map as a
  reconstruction constraint.

TABLE 2 | Summary of results for the different fitting methods, with and without an external proton-density-weighted fat fraction (FF) constraint.

Method                FF Constraint # echoes                                                   wT2 (ms)                                                FF (%)          Global FF
                                                                                                                                                                       error (p.p.)
                                                                          Volunteers                                        Patients                 Vol. Pat.

                                                    Average Global SD Pooled SD Intrasubject SD Average Global SD Pooled SD

EPG                   No                    3         28.6         1.3           8.1              1.0            31.4         6.2           12       17.3 22.5              6.4
                                            5         34.2         1.8           5.2              1.1            37.7         7.7           8.8       2.9    8.1           −8.0
                                            8         33.8         1.8           4.4              1.0            36.1         4.9           7.6       3.2    9.8           −7.0
                                            17        33.0         1.3           3.3              0.9            32.7         2.5           4.1       4.6   12.8           −4.7
                      Yes                   3         34.5         1.5           5.9              1.5            34.5         3.6           8.9      6.4* 17.8*
                                            5         32.3         1.3           4.9              1.1            32.2         3.2           6.4
                                            8         31.9         1.4           4.9              1.3            32.4         2.6           5.9
                                            17        32.1         1.6           5.1              1.4            33.1         2.5           6.2
Double exponential No                       5         25.3         2.9           8.3              3.1            24.7         2.5          10.1      17.9 23.9              8.6
                                            8         29.4         1.7           5.8              1.8            28.4         3.1           6.7      15.1 21.9              6.2
                                            17        33.2         1.6           4.6              1.6            31.7         3.7           9.5      11.9 19.0              3.2
                      Yes                   5         36.1         2.1           6.9              2.3            35.4         3.6           8.3      6.4* 17.8*
                                            8         38.6         2.5           7.7              2.7            38.4         3.7           9.3
                                            17        41.3         3.5          10.4              3.5            41.2         6.2           14

The pooled standard deviation (SD) is associated with image noise, whereas the intrasubject SD is associated with homogeneity in different anatomical regions. The FF error with respect
to the multi-echo gradient-echo acquisition (MEGE) is given in percentage points (p.p.). Values marked with an asterisk (*) are not fitted by the algorithm but are derived from the MEGE
acquisition.

   In the comparison with an existing implementation, the                                      performing the dictionary matching. This finding highlights the
absolute wT2 values obtained by this method are close, but                                     necessity of having consistent acquisition and data processing
not identical, to the ones obtained from QMRTools, although                                    pipelines, and the necessity of characterizing a quantitative
both methods are based on the same conceptual framework.                                       method primarily in terms of reproducibility and precision. It
One explanation could be the usage of different metrics while                                  is generally true also in other fields of quantitative MRI, that

Frontiers in Neurology | www.frontiersin.org                                               7                                             February 2021 | Volume 12 | Article 630387
Santini et al. Fast Water T2 Fitting
with few echoes, suggesting that it might still be considered a
robust and straightforward approach when no other methods
are available. The constrained double exponential reconstruction,
conversely, produced results farthest from the expected values
(12, 14). An analysis of the data shows that the unconstrained
double exponential fitting consistently overestimates the fat
fraction. The possible explanation is that the longer exponential
decay due to the stimulated echoes gets assigned to the fat
component during the fitting process in the unconstrained case,
whereas fixing the fat fraction in the constrained reconstruction
produces a longer apparent exponential decay constant in what is
practically a monoexponential fitting of the residuals.
Generally, most of the obtained wT2 values negatively
correlate with fat fraction, which is in line with the previous
findings (15, 39), with the exception of the EPG matching of
FIGURE 5 | Bland Altman plot of the agreement of the wT2 values obtained the reduced echoes, showing a positive correlation, suggesting a
by the QMRTools software package and the presented software, for an
failure to separate the wT2 from fat.
unconstrained 17-echo EPG reconstruction. The bias and the 95% confidence
intervals are depicted in the plot. As an overall comparison, both fitting methods (double
exponential fitting and EPG matching) have advantages and
disadvantages. EPG matching appears accurate and precise
even when a lower number of echoes is used, especially when
the absolute values obtained are method-dependent and thus paired with an external fat fraction constraint, and it has
comparisons need to be carefully considered (37, 38). a higher insensitivity to B1 inhomogeneity, but it requires
During the optimization of the EPG matching algorithm, it precise knowledge of the acquisition parameters to obtain
appeared clear that an accurate slice profile was very important unbiased values. Double exponential fitting fails in regions of
to obtain absolute values of wT2 close to the literature. Small B1 inhomogeneity, its accuracy is poor when few echoes are
changes to the profile, or selecting a too large refocusing slice used, and the external fat fraction constraints introduces a
width factor, could introduce a bias of a few milliseconds in the bias in the obtained values. However, it requires very little
estimated values. The intersubject and intrasubject variabilities, knowledge of the acquisition parameters, and it can therefore be
however, minimally changed, so the user should be advised to chosen when the sequence characteristics are unknown. When
obtain the exact sequence characteristics and to use a coherent the full 17-echo acquisitions are used, the two fitting methods
parameter set when reconstructing multiple datasets. have similar characteristics when averaged across the muscles;
The introduction of the constrained reconstruction appears however, the sensitivity of the double exponential fitting to
beneficial for the fitting of wT2, providing reliable and B1 inhomogeneity might mask local intramuscular changes in
homogeneous results, not correlated with the amount of patients with neuromuscular disorders.
infiltration of the muscle, with considering as few as five Although not explored in the present validation for the results
acquired echoes. This is a valuable result in light of providing to be more comparable, the program assumes a constant value
better spatial coverage by the MESE sequence: reducing the for fat T2. Still, it gives the possibility of indicating it as a runtime
number of acquired echoes allows exciting multiple interleaved parameter or estimating it from the image itself. Similarly, T1
slices in a simple repetition time and thus lessen the interslice values for water and fat are fixed, although this can be assumed
gaps. However, the alignment of the fat fraction map can to have a small effect on the final result (14). Other effects like j-
introduce some artifacts if patient motion occurs between the coupling are also not explicitly introduced in the model but rather
two acquisitions. In the current implementation, no image incorporated in the assumed value of fat T2, which is dependent
registration is performed. The alignment of the MESE and MEGE on the characteristics of the MESE sequence (40).
datasets is currently only performed based on the orientation The implementation has some further limitations regarding
information provided in the image headers. Image registration the accuracy of the results. Specifically, Keene et al. demonstrated
is, however, implementable using free python libraries and could that this method can be improved by introducing a correction for
be added if needed. the chemical shift in the slice profile and a better estimation for
The EPG matching, as expected, could account for the B1 fat T2 (15). These corrections are relatively newly introduced and
inhomogeneities and therefore lead to lower artifacts in the areas not routinely used in the current studies, and thus not currently
where flip angles deviate from the nominal value in comparison implemented. However, the chemical shift correction requires
to double-exponential fitting. knowledge of the actual implementation of the pulse sequence
In general, unconstrained double exponential fitting with that might be difficult to obtain in a clinical setting. It would
reduced echoes resulted in underestimating wT2 values relative therefore result in potential loss of generalizability. Similarly, a
to other methods with unconstrained reconstruction. On the multi-peak spectral model for the fat could be incorporated into
other hand, thanks to its fewer degrees of freedom in the fitting, the algorithm, which could improve the results’ accuracy. As
it showed remarkable homogeneity across the various ROIs even this method is based on multi spin echoes, the multiple spectral
Frontiers in Neurology | www.frontiersin.org 8 February 2021 | Volume 12 | Article 630387Santini et al. Fast Water T2 Fitting
peaks do not result in different chemical shifts as in gradient-echo be preferred to a double exponential fitting, provided that the
images. The effect would only be seen in the different T2 values of characteristics of the MR sequence (especially in terms of RF
the fat components; therefore, this functionality is not currently pulses) are sufficiently known.
implemented, in line with existing spin-echo-based methods for
muscle imaging (14, 15, 17, 23). DATA AVAILABILITY STATEMENT
One limitation of this work is the relatively small number of
datasets. However, both healthy and different diseased subjects The data analyzed in this study is subject to the following
were included. While a larger subject cohort would be of interest, licenses/restrictions: Data included in this work can be
one of the goals of this study was to offer the tools for such shared upon research agreement between the Institutions.
studies and not to draw conclusions on wT2 measurements Requests to access these datasets should be directed to Anna
of dystrophic muscles. For this goal, clinical studies that focus Pichiecchio, anna.pichiecchio@mondino.it.
on more homogenous patient cohorts (grouping, for example,
the different stages of neuromuscular disease, where similar ETHICS STATEMENT
pathological changes are expected) are required.
The validation of this work was performed by comparing the The studies involving human participants were reviewed and
proposed fitting with an existing implementation of the same approved by Comitato Etico Area Referente Pavia Fondazione
concept on the same data, thus lacking an external reference IRCCS Policlinico San Matteo and Policlinico Gemelli’s Ethics
standard for the values obtained. While such an external Committe. The patients/participants provided their written
reference could be desirable, the scope of this work was not informed consent to participate in this study.
to assess the validity of MESE acquisitions for the estimation
of wT2, but only to evaluate the efficacy of the proposed AUTHOR CONTRIBUTIONS
implementation. The availability of an independent fitting
procedure allowed a direct comparison of these characteristics FSa study conception, method and software development, data
without other sources of error deriving from the physics of analysis, and manuscript drafting. XD data analysis, statistics,
different acquisition methods. and manuscript drafting. MP, FSo, and AP data acquisition
In conclusion, in this work, we have presented a fast and and patient management. MW and PS method development.
open implementation of an algorithm for the T2 mapping of MM, ER, and GT patient recruitment and clinical evaluations.
the water component of muscle tissues in the presence of fat, OB, AP, and NB study conception and supervision. All authors
based on conventional multi-echo spin-echo sequences, capable contributed to the article and approved the submitted version.
of incorporating prior knowledge of the fat fraction. Thanks
to the additional information obtained from the multi-echo FUNDING
gradient-echo images, a reduced number of echoes can be used
for the spin-echo acquisition with while retaining similar inter- This work was supported by the Swiss National Science
and intrasubject variability and similar absolute values, when and Foundation (SNSF) grant no. 172876 and by the Italian Ministry
EPG model is used. The EPG matching method is in general to of Health (RC 2017-2019 and RF-2016-02362914).
REFERENCES 7. Carlier PG. Global T2 versus water T2 in NMR imaging of fatty
infiltrated muscles: different methodology, different information
1. Mercuri E, Muntoni F. Muscular dystrophies. Lancet Lond Engl. (2013) and different implications. Neuromuscul Disord. (2014) 24:390–
381:845–60. doi: 10.1016/S0140-6736(12)61897-2 2. doi: 10.1016/j.nmd.2014.02.009
2. Tasca G, Pescatori M, Monforte M, Mirabella M, Iannaccone E, Frusciante 8. Janiczek RL, Gambarota G, Sinclair CDJ, Yousry TA, Thornton JS, Golay X,
R, et al. Different molecular signatures in magnetic resonance imaging- et al. Simultaneous T2 and lipid quantitation using IDEAL-CPMG. Magn
staged facioscapulohumeral muscular dystrophy muscles. PLoS ONE. (2012) Reson Med. (2011) 66:1293–302. doi: 10.1002/mrm.22916
7:e38779. doi: 10.1371/journal.pone.0038779 9. Mankodi A, Bishop CA, Auh S, Newbould RD, Fischbeck KH, Janiczek RL.
3. Lassche S, Küsters B, Heerschap A, Schyns MVP, Ottenheijm CAC, Voermans Quantifying disease activity in fatty-infiltrated skeletal muscle by IDEAL-
NC, et al. Correlation between quantitative MRI and muscle histopathology CPMG in Duchenne muscular dystrophy. Neuromuscul Disord. (2016)
in muscle biopsies from healthy controls and patients with IBM, FSHD and 26:650–8. doi: 10.1016/j.nmd.2016.07.013
OPMD. J Neuromuscul Dis. (2020) 7:495–504. doi: 10.3233/JND-200543 10. Schlaeger S, Weidlich D, Klupp E, Montagnese F, Deschauer M, Schoser B,
4. Monforte M, Laschena F, Ottaviani P, Bagnato MR, Pichiecchio A, Tasca G, et al. Water T2 mapping in fatty infiltrated thigh muscles of patients with
et al. Tracking muscle wasting and disease activity in facioscapulohumeral neuromuscular diseases using a T2-prepared 3D turbo spin echo with SPAIR.
muscular dystrophy by qualitative longitudinal imaging. J Cachexia J Magn Reson Imaging. (2020) 51:1727–36. doi: 10.1002/jmri.27032
Sarcopenia Muscle. (2019) 10:1258–65. doi: 10.1002/jcsm.12473 11. Sousa PL de, Vignaud A, Araújo EC de A, Carlier PG. Factors
5. Klingler W, Jurkat-Rott K, Lehmann-Horn F, Schleip R. The role of fibrosis controlling T2 mapping from partially spoiled SSFP sequence: optimization
in Duchenne muscular dystrophy. Acta Myol Myopathies Cardiomyopathies. for skeletal muscle characterization. Magn Reson Med. (2012) 67:1379–
(2012) 31:184–95. 90. doi: 10.1002/mrm.23131
6. Bonati U, Hafner P, Schädelin S, Schmid M, Naduvilekoot Devasia A, 12. Klupp E, Weidlich D, Schlaeger S, Baum T, Cervantes B, Deschauer
Schroeder J, et al. Quantitative muscle MRI: a powerful surrogate outcome M, et al. B1-insensitive T2 mapping of healthy thigh muscles
measure in Duchenne muscular dystrophy. Neuromuscul Disord. (2015) using a T2-prepared 3D TSE sequence. PLoS ONE. (2017)
25:679–85. doi: 10.1016/j.nmd.2015.05.006 12:e0171337. doi: 10.1371/journal.pone.0171337
Frontiers in Neurology | www.frontiersin.org 9 February 2021 | Volume 12 | Article 630387Santini et al. Fast Water T2 Fitting
13. Koolstra K, Webb AG, Veeger TTJ, Kan HE, Koken P, Börnert P. Water– 27. Welch EB, Smith DS, Avison MJ, Berglund J, Kullberg J, Ahlström H.
fat separation in spiral magnetic resonance fingerprinting for high temporal Fattyriot - Final Winning Entry Of The 2012 Ismrm Challenge On Water-Fat
resolution tissue relaxation time quantification in muscle. Magn Reson Med. Reconstruction. Zenodo (2015). Available from: https://zenodo.org/record/
(2020) 84:646–62. doi: 10.1002/mrm.28143 16741 (accessed October 9, 2020).
14. Marty B, Baudin P-Y, Reyngoudt H, Azzabou N, Araujo ECA, Carlier 28. Huang C, Altbach MI, El Fakhri G. Pattern recognition for rapid T2 mapping
PG, et al. Simultaneous muscle water T2 and fat fraction mapping using with stimulated echo compensation. Magn Reson Imaging. (2014) 32:969–
transverse relaxometry with stimulated echo compensation. NMR Biomed. 74. doi: 10.1016/j.mri.2014.04.014
(2016) 29:431–43. doi: 10.1002/nbm.3459 29. Weigel M. Extended phase graphs: dephasing, RF pulses, and echoes - pure
15. Keene KR, Beenakker J-WM, Hooijmans MT, Naarding KJ, Niks EH, Otto and simple. J Magn Reson Imaging. (2015) 41:266–95. doi: 10.1002/jmri.24619
LAM, et al. T2 relaxation-time mapping in healthy and diseased skeletal 30. Hennig J. Echoes—how to generate, recognize, use or avoid
muscle using extended phase graph algorithms. Magn Reson Med. (2020) them in MR-imaging sequences. Part I: fundamental and not so
84:2656–70. doi: 10.1002/mrm.28290 fundamental properties of spin echoes. Concepts Magn Reson. (1991)
16. Strijkers GJ, Araujo ECA, Azzabou N, Bendahan D, Blamire A, Burakiewicz J, 3:125–43. doi: 10.1002/cmr.1820030302
et al. Exploration of new contrasts, targets, and MR imaging and spectroscopy 31. Carr HY, Purcell EM. Effects of diffusion on free precession
techniques for neuromuscular disease – A Workshop Report of Working in nuclear magnetic resonance experiments. Phys Rev. (1954)
Group 3 of the Biomedicine and Molecular Biosciences COST Action BM1304 94:630–8. doi: 10.1103/PhysRev.94.630
MYO-MRI. J Neuromuscul Dis. (2019) 6:1–30. doi: 10.3233/JND-180333 32. Meiboom S, Gill D. Modified spin-echo method for measuring nuclear
17. Kan HE, Scheenen TWJ, Wohlgemuth M, Klomp DWJ, van Loosbroek- relaxation times. Rev Sci Instrum. (1958) 29:688–91. doi: 10.1063/1.1716296
Wagenmans I, Padberg GW, et al. Quantitative MR imaging of individual 33. Pauly J, Roux PL, Nishimura D, Macovski A. Parameter relations for the
muscle involvement in facioscapulohumeral muscular dystrophy. Shinnar-Le Roux selective excitation pulse design algorithm (NMR imaging).
Neuromuscul Disord. (2009) 19:357–62. doi: 10.1016/j.nmd.2009.02.009 IEEE Trans Med Imaging. (1991) 10:53–65. doi: 10.1109/42.75611
18. Schlaffke L, Rehmann R, Rohm M, Otto LAM, de Luca A, Burakiewicz 34. Tasca G, Monforte M, Ottaviani P, Pelliccioni M, Frusciante R, Laschena F,
J, et al. Multi-center evaluation of stability and reproducibility of et al. Magnetic resonance imaging in a large cohort of facioscapulohumeral
quantitative MRI measures in healthy calf muscles. NMR Biomed. (2019) muscular dystrophy patients: pattern refinement and implications for clinical
32:e4119. doi: 10.1002/nbm.4119 trials. Ann Neurol. (2016) 79:854–64. doi: 10.1002/ana.24640
19. Hooijmans MT, Baligand C, Froeling M, Verschuuren JJGM, Webb AG, 35. R Development Core Team. R: A Language and Environment for Statistical
Niks EH, et al. Multi-parametric MR shows increased T2 heterogeneity in Computing. Vienna: R Foundation for Statistical Computing (2008). Available
fat infiltrated muscles in Becker Muscular Dystrophy. In: Proc Intl Soc Mag from: http://www.R-project.org (accessed February 15, 2021).
Reson Med 26. Paris (2018). Available from: http://indexsmart.mirasmart. 36. Froeling M. QMRTools: a mathematica toolbox for quantitative MRI analysis.
com/ISMRM2018/PDFfiles/0816.html (accessed January 15, 2021). J Open Source Softw. (2019) 4:1204. doi: 10.21105/joss.01204
20. Otto LAM, Pol W-L van der, Schlaffke L, Wijngaarde CA, Stam M, Wadman 37. Roujol S, Weingärtner S, Foppa M, Chow K, Kawaji K, Ngo LH, et al.
RI, et al. Quantitative MRI of skeletal muscle in a cross-sectional cohort of Accuracy, precision, and reproducibility of four T1 mapping sequences: a
patients with spinal muscular atrophy types 2 and 3. NMR Biomed. (2020) head-to-head comparison of MOLLI. ShMOLLI, SASHA, and SAPPHIRE.
33:e4357. doi: 10.1002/nbm.4357 Radiology. (2014) 272:683–9. doi: 10.1148/radiol.14140296
21. Heskamp L, Okkersen K, van Nimwegen M, Ploegmakers MJ, Bassez G, 38. Baeßler B, Schaarschmidt F, Stehning C, Schnackenburg B, Giolda A, Maintz
Deux J-F, et al. Quantitative muscle MRI depicts increased muscle mass D, et al. Reproducibility of three different cardiac T2-mapping sequences at
after a behavioral change in myotonic dystrophy type 1. Radiology. (2020) 1.5T. J Magn Reson Imaging. (2016) 44:1168–78. doi: 10.1002/jmri.25258
297:132–42. doi: 10.1148/radiol.2020192518 39. Schlaeger S, Weidlich D, Klupp E, Montagnese F, Deschauer M,
22. Keene KR, Vught L, Velde NM, Ciggaar IA, Notting IC, Genders Schoser B, et al. Decreased water T2 in fatty infiltrated skeletal
SW, et al. The feasibility of quantitative MRI of extra-ocular muscles muscles of patients with neuromuscular diseases. NMR Biomed. (2019)
in myasthenia gravis and Graves’ orbitopathy. NMR Biomed. (2021) 32:e4111. doi: 10.1002/nbm.4111
34:e4407. doi: 10.1002/nbm.4407 40. Hardy PA, Henkelman RM, Bishop JE, Poon ECS, Plewes DB. Why fat is
23. Carlier PG, Marty B, Scheidegger O, Loureiro de Sousa P, Baudin P-Y, Snezhko bright in rare and fast spin-echo imaging. J Magn Reson Imaging. (1992)
E, et al. Skeletal muscle quantitative nuclear magnetic resonance imaging and 2:533–40. doi: 10.1002/jmri.1880020511
spectroscopy as an outcome measure for clinical trials. J Neuromuscul Dis.
(2016) 3:1–28. doi: 10.3233/JND-160145 Conflict of Interest: The authors declare that the research was conducted in the
24. Radunsky D, Blumenfeld-Katzir T, Volovyk O, Tal A, Barazany D, absence of any commercial or financial relationships that could be construed as a
Tsarfaty G, et al. Analysis of magnetization transfer (MT) influence on potential conflict of interest.
quantitative mapping of T2 relaxation time. Magn Reson Med. (2019) 82:145–
58. doi: 10.1002/mrm.27704 Copyright © 2021 Santini, Deligianni, Paoletti, Solazzo, Weigel, de Sousa, Bieri,
25. Weigel M, Helms G, Hennig J. Investigation and modeling of magnetization Monforte, Ricci, Tasca, Pichiecchio and Bergsland. This is an open-access article
transfer effects in two-dimensional multislice turbo spin echo sequences distributed under the terms of the Creative Commons Attribution License (CC BY).
with low constant or variable flip angles at 3 T. Magn Reson Med. (2010) The use, distribution or reproduction in other forums is permitted, provided the
63:230–4. doi: 10.1002/mrm.22145 original author(s) and the copyright owner(s) are credited and that the original
26. Melki PS, Mulkern RV. Magnetization transfer effects in publication in this journal is cited, in accordance with accepted academic practice.
multislice RARE sequences. Magn Reson Med. (1992) 24:189– No use, distribution or reproduction is permitted which does not comply with these
95. doi: 10.1002/mrm.1910240122 terms.
Frontiers in Neurology | www.frontiersin.org 10 February 2021 | Volume 12 | Article 630387You can also read