Precipitous Increase of Bacterial CRISPR-Cas Abundance at Around - 45 C
←
→
Page content transcription
If your browser does not render page correctly, please read the page content below
HYPOTHESIS AND THEORY
                                                                                                                                          published: 01 March 2022
                                                                                                                                   doi: 10.3389/fmicb.2022.773114

                                             Precipitous Increase of Bacterial
                                             CRISPR-Cas Abundance at Around
                                             45◦C
                                             Xin-Ran Lan, Zhi-Ling Liu and Deng-Ke Niu*
                                             MOE Key Laboratory for Biodiversity Science and Ecological Engineering and Beijing Key Laboratory of Gene Resource
                                             and Molecular Development, College of Life Sciences, Beijing Normal University, Beijing, China

                                             Although performing adaptive immunity, CRISPR-Cas systems are present in only
                                             40% of bacterial genomes. We observed an abrupt increase of bacterial CRISPR-Cas
                                             abundance at around 45◦ C. Phylogenetic comparative analyses confirmed that the
                                             abundance correlates with growth temperature only at the temperature range around
                                             45◦ C. From the literature, we noticed that the diversities of cellular predators (like
                                             protozoa, nematodes, and myxobacteria) have a steep decline at this temperature
                                             range. The grazing risk faced by bacteria reduces substantially at around 45◦ C
                           Edited by:        and almost disappears above 60◦ C. We propose that viral lysis would become the
                     John R. Battista,
                                             dominating factor of bacterial mortality, and antivirus immunity has a higher priority at
            Louisiana State University,
                        United States        higher temperatures. In temperature ranges where the abundance of cellular predators
                       Reviewed by:          does not change with temperature, the growth temperatures of bacteria would not
                        Ziding Zhang,        significantly affect their CRISPR-Cas contents. The hypothesis predicts that bacteria
   China Agricultural University, China
                             Jie Feng,       should also be rich in CRISPR-Cas systems if they live in other extreme conditions
   Academy of Sciences of the Czech          inaccessible to grazing predators.
           Republic (ASCR), Czechia
                                             Keywords: CRISPR-Cas, optimal growth temperature, bacteria, protistan grazing, viral lysis, mortality
                 *Correspondence:
                        Deng-Ke Niu
                  dkniu@bnu.edu.cn;
              dengkeniu@hotmail.com         INTRODUCTION
                   Specialty section:       CRISPR-Cas systems provide adaptive immunity against mobile genetic elements for bacteria
         This article was submitted to      and archaea. Like the adaptive immune system of jawed vertebrates, the CRISPR-Cas systems
           Evolutionary and Genomic         can remember previously encountered pathogens, initiate a rapid response to a second invasion,
                         Microbiology,      and eliminate the recurrent invader. However, unlike the ubiquitous presence of adaptive
               a section of the journal     immunity in jawed vertebrates (Müller et al., 2018), the CRISPR-Cas systems are only present
             Frontiers in Microbiology
                                            in about 40% of bacteria (Makarova et al., 2020). The patchy distribution of the CRISPR-
      Received: 09 September 2021           Cas systems among bacteria is a recognized mystery (Ledford, 2017; Koonin, 2018). Given
       Accepted: 07 February 2022
                                            the constant horizontal transfers, their absence in more than half of bacterial genomes is
         Published: 01 March 2022
                                            unlikely to happen just by chance (Bernheim, 2017). Instead, it should be attributed to a
                              Citation:     tradeoff between the costs and benefits of the CRISPR-Cas systems. First, the acquirement
         Lan X-R, Liu Z-L and Niu D-K
                                            and maintenance of CRISPR-Cas systems would sequestrate limiting resources such as the
           (2022) Precipitous Increase
 of Bacterial CRISPR-Cas Abundance
                                            building blocks, the energy, and the transcription and translation machines (Lynch and Marinov,
                      at Around 45◦ C.      2015; Vale et al., 2015; Frumkin et al., 2017). Second, the autoimmune response and cell
          Front. Microbiol. 13:773114.      death induced by self- and prophage-targeting spacers might be a selective force for the loss
     doi: 10.3389/fmicb.2022.773114         of CRISPR-Cas systems (Rollie et al., 2020; Wimmer and Beisel, 2020). In addition, for the

Frontiers in Microbiology | www.frontiersin.org                                   1                                         March 2022 | Volume 13 | Article 773114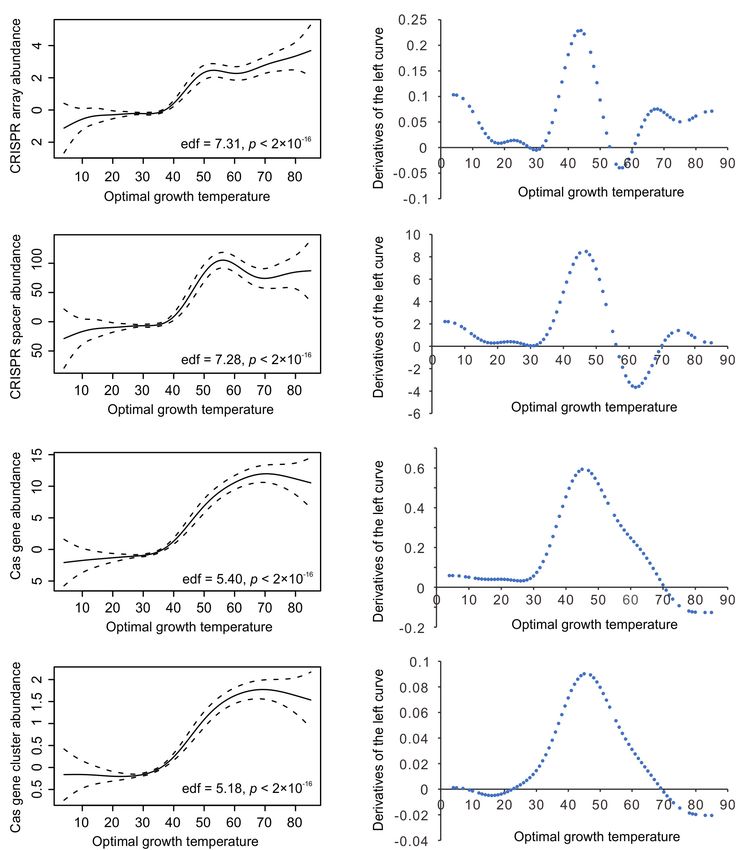
Lan et al.                                                                                                     Thermal Distribution of CRISPR-Cas

viruses with high densities, high mutation rates, high genetic            object (CRISPR arrays, CRISPR spacers, cas genes, or cas gene
diversities, or carrying anti-CRISPR proteins, the efficiency of          clusters) in the genome.
CRISPR-Cas systems is limited (Weinberger et al., 2012; Iranzo                Based on these 5200 representative genomes, we
et al., 2013; Westra et al., 2015; Trasanidou et al., 2019).              constructed three datasets.
CRISPR-Cas systems are not favored in conditions with high                    The first is the smallest but most accurate, including 1351
antibiotic pressures because they inhibit horizontal gene transfer,       species (1168 bacteria and 183 archaea, Supplementary Table 1).
an efficient way for bacteria to acquire antibiotic resistance            This dataset was constructed by retrieving the direct links of
(Palmer and Gilmore, 2010).                                               Genbank IDs and optimal growth temperature of the same strain
   Just after discovering the CRISPR-Cas structures, it was               from the database TEMPURA (Sato et al., 2020) and the reference
noticed that they are more prevalent in the thermophilic archaea          (Lyubetsky et al., 2020), and then manually matching the strain
and the hyperthermophilic bacteria (Jansen et al., 2002; Makarova         names of the other records in TEMPURA with the complete
et al., 2002). Later large-scale analyses confirmed the prevalence        genomes deposited in Genbank. In this dataset, the Topt and
of CRISPR-Cas systems in thermophiles and hyperthermophiles               the genome of each species must come from the same strain.
and showed a positive correlation between CRISPR abundance                Potential errors resulting from polymorphism of Topt or CRISPR
and growth temperatures (Anderson et al., 2011; Makarova et al.,          abundance within each species have been eliminated.
2011; Weinberger et al., 2012; Gophna et al., 2015). Recently,                The second dataset contains 3154 genomes (2944 bacteria
Weissman et al. (2019) tried a phylogenetically corrected                 and 210 archaea, Supplementary Table 2). In constructing this
machine learning approach using models like logistic regression,          dataset, polymorphisms among the strains of a single species were
sparse partial least squares discriminant analysis, and random            neglected. The strain name of each species was overlooked. The
forest with the data split into different blocked folds by their          Topts were retrieved from a series of sources. For the conflicting
pairwise distance on the phylogeny. Their results indicate that           records of Topt between different resources, the preferential
temperature and oxygen levels might be the most influencing               rank was from the Topts with GenBank IDs in TEMPURA
ecological factors determining the distribution of the CRISPR-            (Sato et al., 2020) and the reference (Lyubetsky et al., 2020), the
Cas systems. In this paper, we describe an abrupt increase of             Topts in reference (Madin et al., 2020), the Topts not associated
bacterial CRISPR-Cas systems at around 45◦ C and put forward              with GenBank IDs in TEMPURA, the growth temperatures
a new hypothesis on the thermal distribution of the CRISPR-               in reference (Madin et al., 2020), the growth temperatures in
Cas systems.                                                              the reference (Engqvist, 2018), to the growth temperatures in
                                                                          BacDive (Reimer et al., 2018).
                                                                              The third dataset contains all the 5200 representative genomes
                                                                          retrieved from GTDB (Supplementary Table 3). The Topt values
MATERIALS AND METHODS
                                                                          of these species were predicted using a machine-learning method
The phylogenetic relationships among the analyzed species were            (Tome, version 1.0.0) reported in reference (Li et al., 2019).
retrieved from Genome Taxonomy Database (GTDB) (Parks                         All the temperature values analyzed in this study were first
et al., 2021). The GTDB group constructed the phylogenetic                rounded into integers.
tree of bacteria and archaea using constantly updated whole-                  These three datasets gave similar column charts for the
genome sequences. They selected a representative genome                   relationships between Topt and CRISPR-Cas abundance. We
for each species. The sample size of their representative                 presented the charts from the 3154 genomes in the main
genomes is similar to the NCBI genome database.1 For the                  text, and all further analyses were based on this dataset. The
accuracy in estimating the CRISPR-Cas abundance, we only                  charts obtained from the other two datasets were deposited in
retrieved the representative genomes assembled at the levels of           Supplementary Tables 4, 5.
“complete genome” or “chromosome” from the GTDB database                      The presence or absence of each prokaryote in particular
(accessed: Dec. 24, 2021), 4908 bacterial and 292 archaeal                environmental conditions was obtained from the isolation
genomes. Then, we downloaded the genome sequences from                    source data of the BacDive database (Reimer et al., 2018). The
ftp://ftp.ncbi.nlm.nih.gov/genomes/ and annotated the CRISPR-             restriction-modification (RM) enzyme genes in each genome
Cas systems using CRISPRCasFinder v1.3 (Couvin et al., 2018).             were obtained from the PADS Arsenal database (Zhang et al.,
According to Couvin et al. (2018), the annotated CRISPR arrays            2020). All these data were deposited in Supplementary Table 2.
were classified into four categories, 1 to 4, according to their              The phylogenetic signals (λ) of CRISPR array abundance,
evidence levels. The CRISPR arrays with evidence levels 3 and             CRISPR spacer abundance, cas gene abundance, cas gene cluster
4 are highly likely candidates, and those with evidence levels            abundance, and growth temperatures were estimated using the
1 and 2 are potentially invalid. Therefore, only the CRISPR               phylosig function of the R (Version 4.0.3) package phytools
arrays with evidence levels 3 and 4 were counted in calculating           (Version 0.7-70) (Revell, 2012). The phylogenetic generalized
CRISPR array abundance. We counted the putative CRISPR                    least squares (PGLS) regression was performed using the R
arrays with evidence levels 1 and 2 as zero. The abundance of             (Version 4.0.3) package phylolm (version 2.6.2) (Ho and Ane,
an object in a genome was defined as the simple count of the              2014). Pagel’s λ model has been applied in the analyses.
                                                                              The non-linearity of the relationships was estimated using the
                                                                          generalized additive model (GAM) that was integrated into the
1
    https://ftp.ncbi.nlm.nih.gov/genomes/GENOME_REPORTS/                  R package mgcv (version 1.8-33) (Wood, 2017). The derivative

Frontiers in Microbiology | www.frontiersin.org                       2                                    March 2022 | Volume 13 | Article 773114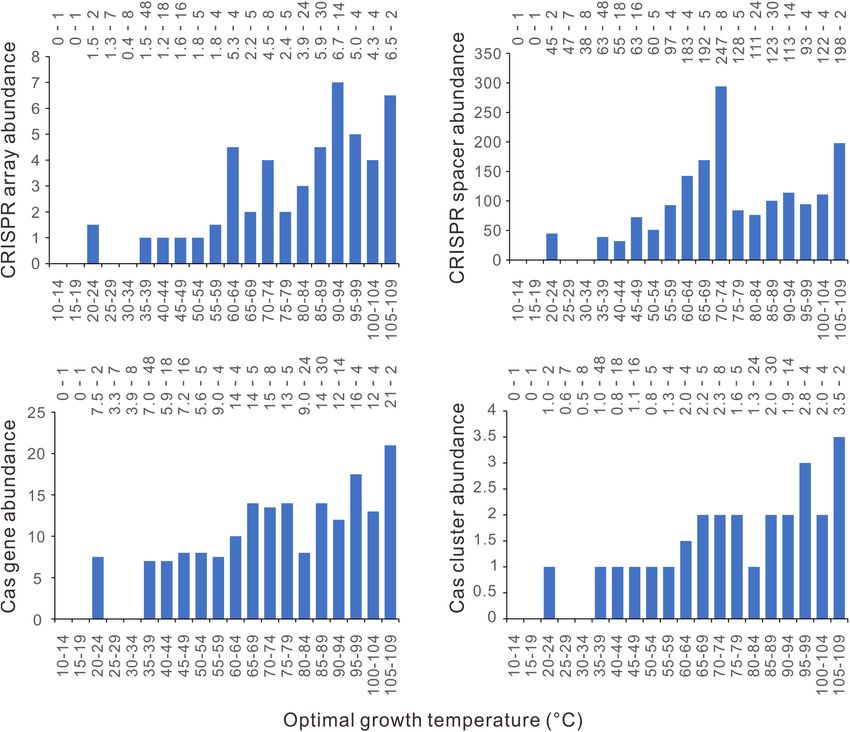
Lan et al.                                                                                                                          Thermal Distribution of CRISPR-Cas

  FIGURE 1 | Distinctive relationships of bacterial CRISPR-Cas abundance with different optimal growth temperature (Topt) ranges. The abundances of CRISPR
  arrays (A), spacers (B), cas genes (C), and cas gene clusters (D) increase substantially with Topt at around 40–45◦ C. Because median values are less sensitive to
  extreme outliers than the mean values, we created the column charts using the median value of each Topt range. The mean value and the number of genomes of
  each bin (separated by a hyphen) are shown at the top of each chart.

of the GAM curve was calculated using the R package gratia                             much weaker. In all the bins below 40◦ C, the median values of
(Version 0.6.0) (Simpson, 2022).                                                       CRISPR array abundance are consistently zero. When measured
                                                                                       by the mean values, the CRISPR array abundances of all the
                                                                                       bins below 40◦ C are 3. At
RESULTS                                                                                around 40−49◦ C, precipitous increases could also be observed
                                                                                       in the abundance of bacterial CRISPR spacers, cas genes, and
Bacterial CRISPR-Cas Abundance                                                         cas gene clusters (Figures 1B–D). In summary, the CRISPR-
Increases Precipitously at Around 45◦ C                                                Cas-poor and rich bacteria are concentrated in low and high
We examined the thermal distribution of bacterial CRISPR-                              temperatures, respectively, and the transitions from CRISPR-
Cas abundance by calculating the median value of the optimal                           Cas poor to CRISPR-Cas rich occur at a narrow range, like
growth temperatures (Topt) in each five-degree temperature                             40−49◦ C.
range bin. From 4 to 85◦ C, the temperature range of the 2944                             The separate distribution of CRISPR-Cas poor and CRISPR-
bacteria was divided into 18 bins. By plotting the CRISPR-                             Cas rich bacteria along the temperature axis might be attributed
Cas abundance against the Topt in column charts, we see a                              to a strong effect of temperature on CRISPR-Cas system
novel pattern on the thermal distribution of CRISPRs in bacteria                       evolution. It is also possible that the results happen just by chance.
(Figure 1A). An abrupt increase of bacterial CRISPR array                              To test this possibility, we performed a permutation test by
abundance happens at 40−45◦ C. The CRISPR array abundance                              randomly shuffling the 2944 bacteria along the axis of Topt 1000
fluctuates above 45◦ C, but the amplitudes of the fluctuations are                     times. The null hypothesis is that the bacteria were randomly

Frontiers in Microbiology | www.frontiersin.org                                    3                                           March 2022 | Volume 13 | Article 773114
Lan et al. Thermal Distribution of CRISPR-Cas
distributed within the studied temperature range. To compare the signals (λ = 0.846, 0.922, 0.884, 0.872, and 0.975 for the
observed results with the null hypothesis, we first quantified the abundance of CRISPR arrays, spacers, cas genes, cas gene clusters
difference of CRISPR-Cas abundance (D) between low and high and Topt, respectively; and the significance value p < 10−275 for
temperatures: all the five cases).
A series of phylogenetic comparative methods have been
developed to control the effects of the shared ancestors
Di = Average(i ,max{Topt}) (CRISPR-Cas)/ (Garamszegi, 2014). We used the PGLS regression to measure
Average(min{Topt},i−1) (CRISPR-Cas) the relationships between CRISPR-Cas abundance and Topt.
A significant positive slope corresponds to a significant
We used the average values rather than the median positive correlation, and a negative slope indicates the reverse.
values because more than 50% of bacterial genomes lack Figures 1, 2 showed that the relationships between CRISPR-Cas
CRISPR-Cas systems. By plotting the Di against Topt, we abundance and Topt are not linear. However, when the data were
could see that it varies significantly at the two ends of divided into segments, we could use linear models to estimate the
the Topt axis (Supplementary Figure 1A for the observed relationships within each segment.
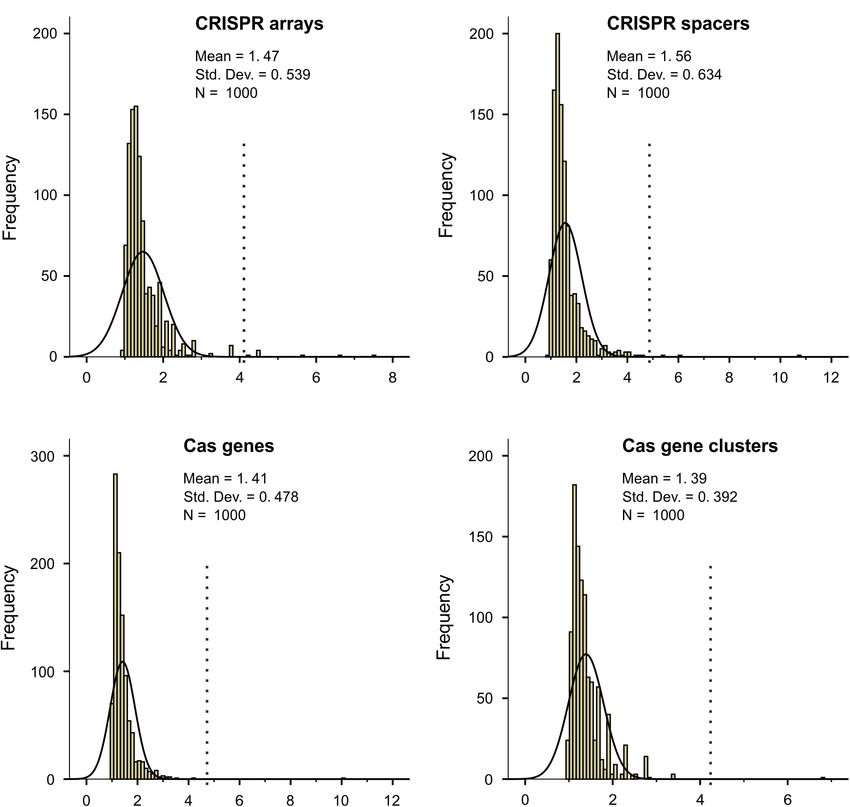
CRISPR arrays and Supplementary Figure 1B for a randomly By aligning the 2944 bacteria along the Topt axis, we
shuffled sample), probably because of the small sample size performed a PGLS analysis for every 200 neighboring samples,
at very low and very high temperatures. To minimize the except that all the 200 samples had the same Topt. In
random noise resulting from the average values of small- total, 1840 rounds of PGLS analyses have been performed
size samples, we retained only the Di from 20 to 64◦ C. for each abundance parameter. In such a large-scale analysis,
Within this range, the maximum value of the difference, tens of significant correlations (including negative and positive
Dmax , for the observed CRISPR arrays is 4.13. Among correlations) likely happen by chance if the statistical significance
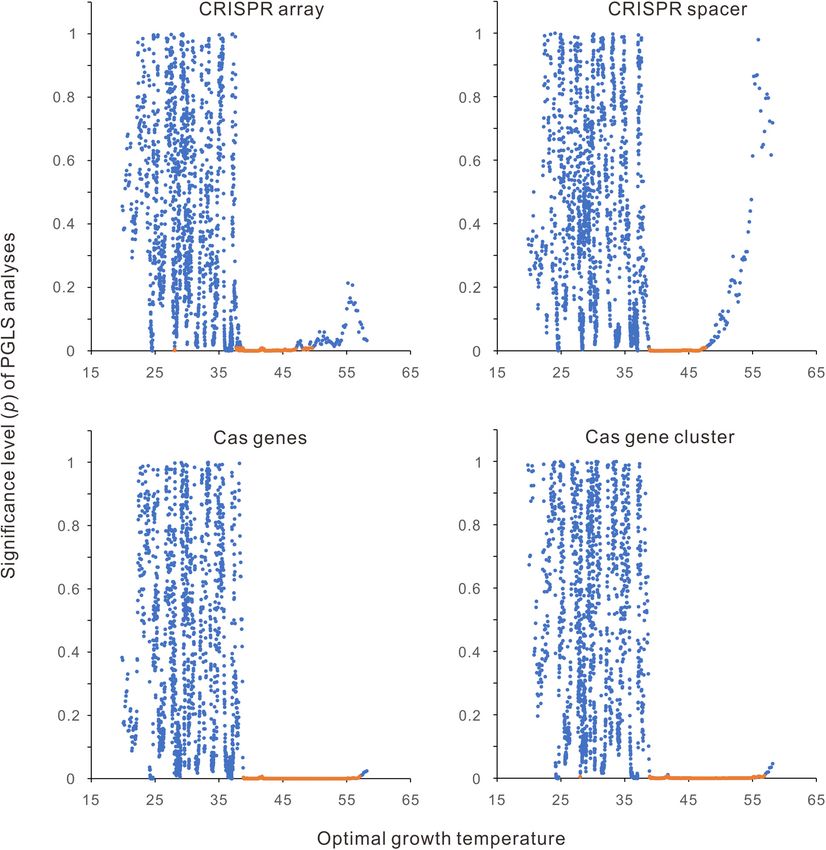
the 1000 rounds of random shufflings, the more extreme is defined by p < 0.05. As shown in Figures 4A–D, all the
maximum values of Di (> 4.13) were obtained in only five correlations around 45◦ C are significant, whereas only a tiny
rounds (Figure 2A). The permutation test showed that the percentage of correlations are significant in low and high-
separate distribution of CRISPR-Cas poor bacteria at low temperature ranges. When the statistical significance was defined
temperatures and CRISPR-Cas rich bacteria at high temperatures more stringently using p < 0.01, positive correlations were
is statistically significant (p = 0.005). By the same method, we observed only around 45◦ C except for one or two cases in
confirmed the statistical significance for the CRISPR spacers, CRISPR arrays and cas gene clusters (Figures 4A,D).
cas genes, and cas gene clusters (p = 0.003, 0.002, and 0.001, Furthermore, we classified the 2944 bacteria into three
respectively) (Figures 2B–D). categories according to their Topts, low temperatures
The column charts (Figure 1) clearly show that the (4 ≤ Topt ≤ 34◦ C, n = 1875), moderate temperatures
relationship between CRISPR-Cas abundance and Topt is not (35 ≤ Topt ≤ 49◦ C, n = 914), and high temperatures
linear. To capture the critical aspect of the relationship, we (50 ≤ Topt ≤ 85◦ C, n = 155), significant correlations were
fitted the data with the smooth functions of the GAM. As only observed in the moderate-temperature bacteria (Table 1).
shown in Figures 3A–D, the model could capture the sharp PGLS regression also showed positive correlations when all the
increases of bacterial CRISPR-Cas abundance from about 35 to 2944 bacteria were analyzed together (Table 1).
50◦ C. We calculated the derivatives of the GAM curves and
presented the results in Figures 3E–H. The temperatures with Precipitous Increase of CRISPR-Cas
the highest slope values appeared at 44, 47, 45, and 45◦ C for the
Abundance at Around 45◦ C Observed in
abundances of CRISPR arrays, spacers, cas genes, and cas gene
clusters, respectively. In summary, the sharp increases of bacterial Diverse Environments
CRISPR-Cas abundances are at around 45◦ C. We retrieved the isolation source category data from the BacDive
database (Reimer et al., 2018) and checked the 2944 bacteria. The
isolation sources differ significantly in the number of bacteria
Phylogenetic Analysis Confirmed the species and the temperature range. We only selected the isolation
Positive Correlations Between Bacterial source categories containing >150 bacterial species to reduce
CRISPR-Cas and Topt at Around 45◦ C sample bias. Because we are interested in the sharp increase
Because of the existence of shared ancestors, the data across of CRISPR-Cas abundance at around 45◦ C, isolation sources
related species are often not statistically independent and violate were also filtrated using their temperature ranges, with their
one of the most basic assumptions of most standard statistical upper limits not lower than 60◦ C and their lower limits not
procedures (Felsenstein, 1985; Symonds and Blomberg, 2014). higher than 30◦ C. Six isolation sources were retained using
To evaluate the effects of shared ancestors, we measured these criteria, including aquatic, marine, sediment, terrestrial,
the phylogenetic signals (Pagel’s λ) of bacterial CRISPR-Cas soil, and plants. Although the temperature ranges of some
abundances and Topt. The λ value ranges from zero to one, sources are much narrower than that of the 2944 bacteria
where zero indicates statistical independence of the data, whereas dataset, sharp increases of CRISPR-Cas abundance at around
one indicates that the data are strongly affected by the shared 45◦ C could be observed in all the surveyed environmental
ancestors. The 2944 bacterial dataset exhibits strong phylogenetic conditions (Figures 5A–D).
Frontiers in Microbiology | www.frontiersin.org 4 March 2022 | Volume 13 | Article 773114
Lan et al.                                                                                                                         Thermal Distribution of CRISPR-Cas

  FIGURE 2 | Permutation tests for the separate distribution of CRISPR-Cas poor and CRISPR-Cas rich bacteria along the temperature axis. The null hypothesis is
  that the bacteria were randomly distributed within the studied temperature range. The ratio of average CRISPR-Cas abundance at equal and above a temperature
  divided by that below the temperature was defined as Di . The maximum values of Di for the observed results (indicated by the dotted lines) and the 1000 rounds of
  random shuffling of CRISPR arrays, spacers, cas genes, and cas gene clusters were shown in (A–D).

The Abundance of Bacterial Type I                                                      median values of zero for CRISPR arrays, spacers, cas genes, and
CRISPR-Cas System Jumps Up at                                                          cas gene clusters. These CRISPR-Cas systems are absent from
                                                                                       more than half of the analyzed genomes. The type III CRISPR-Cas
Around 45◦ C                                                                           system has only one bin with median values > 0, 85 − 89◦ C. The
Currently, CRISPR-Cas systems are classified into six types                            type I CRISPR-Cas system exhibits a thermal distribution pattern
(Type I − VI) according to their cas gene content and Cas                              similar to but more distinctive than when all the CRISPR-Cas
protein sequence conservation (Makarova et al., 2020). The                             systems were counted together. There are abrupt jumps at 45◦ C
CRISPR-Cas systems that could not be confidently classified                            (Figures 6A–D). For instance, the cas gene abundance jumps
into these six types have been labeled as “unknown” by the                             directly from zero to seven at 45◦ C, without a transitional column
program CRISPRCasFinder v1.3 (Couvin et al., 2018). The type I                         at 40 − 44◦ C.
CRISPR-Cas system is the most frequent in bacteria and archaea
(Bernheim et al., 2019; Makarova et al., 2020). We examined
the thermal distribution of these seven groups (Type I − VI                            Archaeal CRISPR-Cas Abundance Has a
and unknown) by plotting the median values in each five-degree                         Less Distinctive Pattern
temperature range against the Topts. Unexpectedly, among type                          We also examined the relationship between topt and CRISPR-
II, IV, V, VI, and the unknown group, all the bins have consistently                   Cas abundances in archaea. Generally, the CRISPR-Cas

Frontiers in Microbiology | www.frontiersin.org                                    5                                          March 2022 | Volume 13 | Article 773114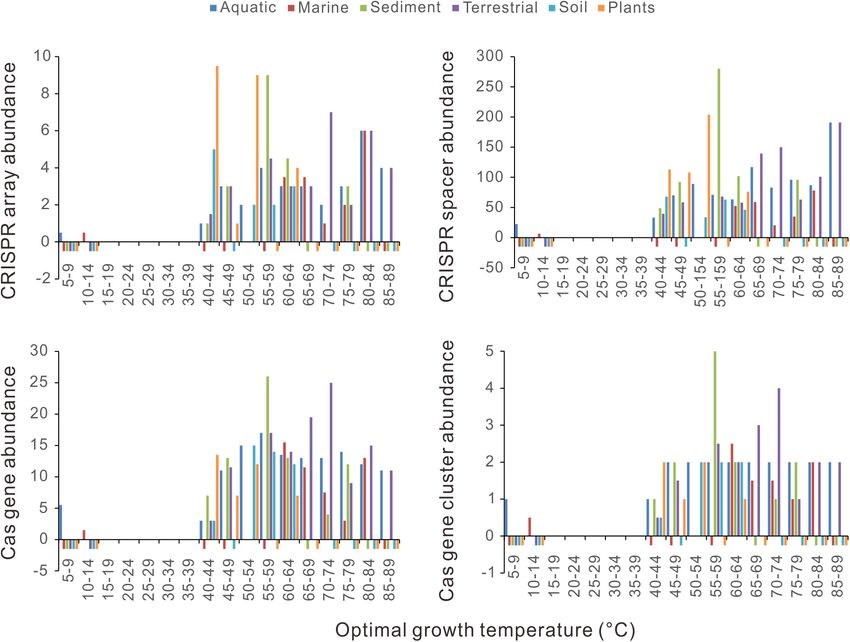
Lan et al.                                                                                                                             Thermal Distribution of CRISPR-Cas

  FIGURE 3 | The relationship between bacterial optimal growth temperature (Topt) and the CRISPR-Cas abundance revealed by the generalized additive model
  (GAM). High non-linearity was detected in the relationship of Topt with CRISPR arrays (A), CRISPR spacers (B), cas genes (C), and cas gene clusters (D). The
  derivatives of the GAM curves in (A–D) revealed the most abrupt transitions at 44◦ C (E), 47◦ C (F), 45◦ C (G), and 45◦ C (H), respectively. The effective degrees of
  freedom (edf) proxy for non-linearity in the relationships.

abundances increase with growth temperature (Figures 7A–D                                cas gene clusters (Supplementary Figure 2). These observations
and Supplementary Figure 2). For the CRISPR array, cas                                   were based on small sample sizes of the bins and were sensitive
gene, and cas gene cluster, there are no abrupt increases at                             to the presence of a few outliers.
around 45◦ C or different temperatures. The CRISPR spacer                                    The 210 archaeal dataset also exhibits significant phylogenetic
abundance increases steadily from 40 to 74◦ C (Figure 7B and                             signals (λ = 0.802, 0.591, 0.537, 0.631, and 0.976 for the
Supplementary Figure 2A). The GAM gave almost linear                                     abundance of CRISPR arrays, spacers, cas genes, cas gene clusters,
regressions for the abundances of CRISPR arrays, cas genes, and                          and Topt, respectively; and the significance value p < 10−10 for all

Frontiers in Microbiology | www.frontiersin.org                                      6                                            March 2022 | Volume 13 | Article 773114

Lan et al.                                                                                                                      Thermal Distribution of CRISPR-Cas

  FIGURE 4 | Segmental phylogenetic generalized least squares (PGLS) regression analysis of the relationships between CRISPR-Cas abundances and optimal
  growth temperatures (Topt). (A) CRISPR arrays. (B) CRISPR spacers. (C) cas genes. (D) cas gene clusters. The 2944 bacteria were aligned along the Topt axis. Two
  hundred neighboring samples were taken in each round of PGLS analysis. The average Topt of each 200 samples was presented in the scatter charts. The
  regression results with positive slopes and < 0.01 significance values are orange.

the five cases). Overlapping segmental PGLS regression analyses                      steadily from 40 to 74◦ C, no significant positive correlation was
found significant positive correlations of Topt with the CRISPR                      found (slope = 2.07, p = 0.165). A significant positive correlation
spacer abundance at around 45◦ C, but not the abundances of                          appeared when the CRISPR spacer abundance was sampled from
CRISPR arrays, cas genes, or cas gene clusters (Supplementary                        10 to 74◦ C (slope = 1.62, p = 0.003). When all the 210 archaeal
Figure 3). Because the 210 archaeal species are enriched in                          genomes were analyzed together, globally positive correlations
thermophiles and hyperthermophiles, dividing them into three                         were observed between Topt and the abundances of CRISPR
temperature range categories using the above thresholds leads to                     arrays, cas genes, and cas gene clusters (p < 0.05 for all three
a too-small sample for the low-temperature category (n = 19).                        cases). In contrast, the CRISPR spacer abundance and Topt were
Therefore, we divided the 210 archaea into three nearly equal-                       correlated at marginal level (0.05 < p < 0.1, Table 1).
sized groups according to their Topts (Table 1). PGLS regression                        In addition, we examined whether bacteria and archaea living
showed a significant correlation between Topt and CRISPR                             at the same temperature are different in their CRISPR-Cas
array abundance in the moderate-temperature group (n = 75,                           abundance. We selected the temperatures that are Topts of both
40 ≤ Topt ≤ 80◦ C, slope = 0.086, p = 0.027), but not in the lower                   bacterial and archaeal species. The CRISPR-Cas abundance of
(p = 0.813) or the higher one (p = 0.101). The cas gene abundance                    bacteria/archaea with the same Topt were averaged. Pairwise
and cas gene cluster abundance are positively correlated with                        comparison of the obtained 41 archaeal-bacterial pairs found
Topt only in the high-temperature group (Table 1). The CRISPR                        marginally significant differences in CRISPR array and cas gene
spacer abundance is not correlated with Topt in all three groups.                    cluster abundances, but not in the abundances of spacers and
Although the CRISPR spacer abundance seems to increase                               cas genes (Wilcoxon signed ranks test, p = 0.049, 0.047, 0.572,

Frontiers in Microbiology | www.frontiersin.org                                  7                                          March 2022 | Volume 13 | Article 773114
Lan et al.                                                                                                                        Thermal Distribution of CRISPR-Cas

TABLE 1 | Correlations between bacterial CRISPR-Cas abundance and optimal growth temperature.

                                                          CRISPR arrays               CRISPR spacers                   Cas genes                 Cas gene clusters

Bacteria
4 − 34◦ C (n = 1875)                 Slope                    0.012                        –0.021                         0.021                         0.002
                                     p                        0.266                         0.947                         0.499                         0.716
35 − 49◦ C (n = 914)                 Slope                    0.128                         2.020                         0.277                         0.042
                                     p                       7 × 10⁻⁶                       0.026                         0.002                         0.005
50 −   85◦ C   (n = 155)             Slope                    0.026                        –0.665                         0.046                         0.003
                                     p                        0.352                         0.616                         0.645                         0.842
4 − 85◦ C (n = 2944)                 Slope                    0.037                         0.764                         0.100                         0.017
                                     p                       6 × 10⁻¹¹                      3 × 10⁻⁵                     9 × 10⁻⁹                       10−95
Archaea
18 − 39◦ C (n = 67)                  Slope                    0.010                       −0.385                          0.222                         0.036
                                     P                        0.813                         0.814                         0.125                         0.075
40 − 80◦ C (n = 75)                  Slope                    0.086                         0.230                         0.054                         0.006
                                     P                        0.027                         0.851                         0.501                         0.622
81 − 106◦ C (n = 68)                 Slope                    0.124                         2.119                         0.333                         0.064
                                     P                        0.101                         0.207                         0.050                         0.016
18 − 106◦ C (n = 210)                Slope                    0.087                         0.819                         0.096                         0.017
                                     P                       2 × 10⁻⁶                       0.087                         0.021                         0.007

P values less than or equal to 0.050 are shown in bold.

  FIGURE 5 | Relationships between CRISPR-Cas abundances and optimal growth temperatures (Topt) in diverse environments. (A) CRISPR arrays. (B) CRISPR
  spacers. (C) cas genes. (D) cas gene clusters. Because median values are less sensitive to extreme outliers than the mean values, we created the column charts
  using the median value of each Topt range. The Topt ranges without any samples were marked out using short negative bars.

Frontiers in Microbiology | www.frontiersin.org                                   8                                          March 2022 | Volume 13 | Article 773114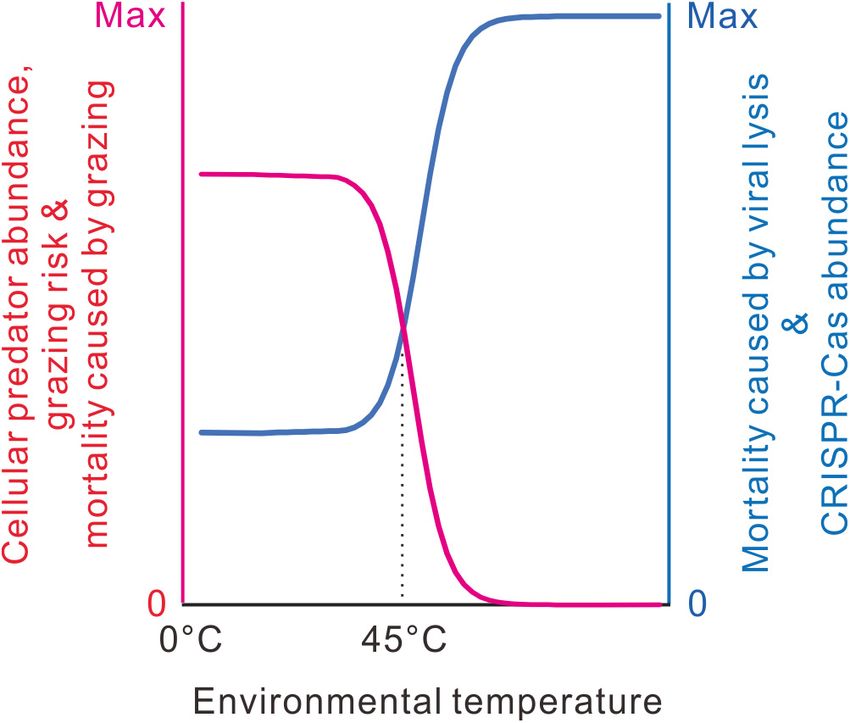
Lan et al.                                                                                                                       Thermal Distribution of CRISPR-Cas

  FIGURE 6 | Relationships between Type I CRISPR-Cas abundances and optimal growth temperatures (Topt). (A) CRISPR arrays. (B) CRISPR spacers. (C) cas
  genes. (D) cas gene clusters. Because median values are less sensitive to extreme outliers than the mean values, we created the column charts using the median
  value of each Topt range. The mean value and the number of genomes of each bin (separated by a hyphen) are shown at the top of each chart.

and 0.313, respectively). Bacteria have a little more CRISPR-Cas                     Weissman et al., 2019). This study presented a more detailed
systems than the archaea living at the same temperature.                             description of the relationship between CRISPR-Cas and Topt.
                                                                                     At low (4 − 34◦ C) and high temperatures (50 − 85◦ C),
No Precipitous Increase of                                                           the abundances of bacterial CRISPR-Cas are not significantly
Restriction-Modification Gene                                                        correlated with Topt. However, at around 45◦ C, bacterial
Abundance at Around 45◦ C                                                            CRISPR-Cas abundance increases sharply with Topt. Most
                                                                                     significantly, the bacterial type I CRISPR-Cas abundance exhibits
In contrast to the patchy distribution of CRISPR-Cas systems
                                                                                     an abrupt jump at 45◦ C. As we see, the evolutionary and
(Makarova et al., 2020), the RM systems are present in about
                                                                                     mechanical links between growth temperature and CRISPR-Cas
96% of bacterial genomes and 97% of archaeal genomes
                                                                                     abundance previously proposed (Weinberger et al., 2012; Iranzo
(Roberts et al., 2015). We counted the number of RM enzyme
                                                                                     et al., 2013; Høyland-Kroghsbo et al., 2018) could not explain
genes in each genome and plotted them against the Topt.
                                                                                     the abrupt transition at around 45◦ C. Temperature influences
As shown in Figure 8, there are no abrupt increases at
                                                                                     many aspects of cellular processes and the physical features of the
around 45◦ C. PGLS regression analysis showed that the RM
                                                                                     environment (Clarke, 2014). No matter linear or non-linear, the
gene abundance significantly declines with Topt, statistically
                                                                                     biological effects of temperature increase gradually.
significant in archaea (n = 183, slope = − 0.162, p = 10−6 ) and
                                                                                        From the literature, we noticed that the thermal distribution
marginally significant in bacteria (n = 1898, slope = − 0.061,
                                                                                     of eukaryotes has an abrupt decline at around 45◦ C. Very
p = 0.079).
                                                                                     few eukaryotes can live above 60◦ C (Tansey and Brock, 1972;
                                                                                     Brock, 1985, 2001; Clarke, 2014). Bacterial communities are
DISCUSSION                                                                           often heavily consumed by eukaryotic predators (Jousset,
                                                                                     2012). In freshwater and marine environments, viral lysis and
Previous studies have found that prokaryotes living in high                          predation by ciliated and flagellated protists contributed to
temperatures are more likely to have CRISPR-Cas systems                              most bacterial mortality (Pernthaler, 2005; Takasu et al., 2014).
(Jansen et al., 2002; Makarova et al., 2002, 2011; Anderson                          In addition, some bacteria could also kill other bacteria and
et al., 2011; Weinberger et al., 2012; Gophna et al., 2015;                          consume the released nutrients. Except for a few exceptions,

Frontiers in Microbiology | www.frontiersin.org                                  9                                          March 2022 | Volume 13 | Article 773114
Lan et al. Thermal Distribution of CRISPR-Cas FIGURE 7 | Relationships between archaeal CRISPR-Cas abundances and optimal growth temperatures (Topt). (A) CRISPR arrays. (B) CRISPR spacers. (C) cas genes. (D) cas gene clusters. Because median values are less sensitive to extreme outliers than the mean values, we created the column charts using the median value of each Topt range. The mean value and the number of genomes of each bin (separated by a hyphen) are shown at the top of each chart. most predatory bacteria could not grow at temperatures reducing the allocation of the limiting resources to immune above 45◦ C (Reichenbach, 1999; Williams and Chen, 2020). function would be favored. Here, we propose that the accessibility of cellular predators We proposed that the same case might happen in bacteria. along the temperature axis might indirectly govern the For picophytoplankton, grazer-mediated mortality and viral- thermal distribution of the CRISPR-Cas systems (Figure 9). mediated mortality are inversely correlated (Pasulka et al., 2015; Cellular predators are the bacterivorous eukaryotes and Staniewski and Short, 2018). Indirect interactions among grazers predatory bacteria, such as protozoa, nematodes, myxobacteria, and viruses are destined to occur, provided that bacterial cells and Bdellovibrio. have tradeoffs in grazing and virus resistance. When bacterial In birds, it has been shown that predation risk could mortality mostly comes from predator grazing, the benefits significantly reduce the allocation of the limiting resources to of adaptive immunity might be dwarfed by the costs in the immune function (Møller and Erritzøe, 2000). The birds captured maintenance and expression of the CRISPR-Cas systems, like by cats consistently had smaller spleens than those killed by non- allocating the limiting resources, targeting host or prophage predatory reasons like collisions with windows or cars. When genome, and inhibiting horizontal gene transfer. By contrast, the hosts are exposed to lethal predators, predator-mediated when bacterial mortality mostly comes from viral lysis, some mortality becomes dominant, and the pathogen-mediated costs of CRISPR-Cas systems would be tolerable because the mortality decreases relatively. Consequently, the priority to invest benefits of adaptive immunity outweigh the costs. At around in immune function is reduced. Physiological and evolutionary 45◦ C, with the increase of environmental temperature, cellular Frontiers in Microbiology | www.frontiersin.org 10 March 2022 | Volume 13 | Article 773114
Lan et al.                                                                                                                        Thermal Distribution of CRISPR-Cas

  FIGURE 8 | Relationships between restriction-modification (RM) gene abundance and optimal growth temperature. (A) bacteria. (B) archaea. Because median
  values are less sensitive to extreme outliers than the mean values, we created the column charts using the median value of each Topt range. The mean value and the
  number of genomes of each bin (separated by a hyphen) are shown at the top of each chart.

                                                                                          changes have little effect on the evolution of the antivirus
                                                                                          system (Figure 9).
                                                                                             Besides explaining the thermal distribution, our hypothesis
                                                                                          suggests that other environmental factors that severely reduce
                                                                                          cellular predator abundance should also affect bacterial mortality
                                                                                          and CRISPR-Cas distribution. A generalized prediction of our
                                                                                          hypothesis is that bacteria living in extreme environments
                                                                                          inaccessible to cellular grazers should carry more CRISPR-Cas
                                                                                          systems in their genomes. Weissman et al. (2019) recently found
                                                                                          a negative interaction between CRISPR-Cas systems and oxygen
                                                                                          availability and hypothesize that oxidative-stress-associated DNA
                                                                                          repair processes might interfere with the function of CRISPR-
                                                                                          Cas systems. Here, we provide an alternate explanation for
                                                                                          their observation by extending our hypothesis. All the well-
                                                                                          known cellular predators are aerobic organisms. There are no
                                                                                          cellular predators or only a few unknown predators in anoxic
                                                                                          environments. Similar to growth temperatures at around 45◦ C,
                                                                                          the transition from an oxygenated to an anoxic environment
                                                                                          would substantially reduce the grazing-caused bacterial mortality
  FIGURE 9 | A model for the thermal distribution of bacterial CRISPR-Cas
                                                                                          and indirectly increase the requirement of antivirus immunity.
  systems. At low temperatures, the evolution of CRISPR-Cas systems is
  limited by the grazing pressure of cellular predators. At around 45◦ C, cellular           Besides growth temperature, many other ecological and
  predator abundance decreases abruptly with environmental temperature, so                evolutionary factors that might influence the phylogenetic
  viral lysis takes more in bacterial mortality, and the requirement of the immune        distribution of CRISPR-Cas systems (Palmer and Gilmore, 2010;
  function increases substantially. When cellular predators almost disappear at           Weinberger et al., 2012; Iranzo et al., 2013; Vale et al., 2015;
  high temperatures, mortality results primarily from viral lysis; most bacteria
  evolve the highest antivirus capacity.
                                                                                          Westra et al., 2015; Trasanidou et al., 2019; Rollie et al.,
                                                                                          2020; Wimmer and Beisel, 2020) are beyond the scope of
                                                                                          this hypothesis. Even for the thermal distribution of CRISPR-
                                                                                          Cas systems, we are open to other possible explanations.
predator abundance decreases sharply (Brock, 1985; Clarke,                                A bacteriophage infecting the tropical pathogen Burkholderia
2014); thus, the grazing risk of bacteria should be abruptly                              pseudomallei was found to be temperate at lower temperatures
relieved. Bacteria growing at higher temperatures should die                              (25◦ C) and tends to go through a lytic cycle at higher
mainly from viral lysis. Antivirus immunity should be favored                             temperatures (37◦ C) (Shan et al., 2014). At least for type
even if it costs the bacterial cells. Within the temperature ranges                       I CRISPR-Cas systems, targeting temperate phages has been
inaccessible to grazing predators or within the temperature                               demonstrated to be a driving force for the loss of adaptive
ranges fully accessible to the grazing predators, temperature                             immunity (Rollie et al., 2020). Therefore, bacteria living in low

Frontiers in Microbiology | www.frontiersin.org                                      11                                      March 2022 | Volume 13 | Article 773114
Lan et al. Thermal Distribution of CRISPR-Cas
temperatures might have fewer CRISPR-Cas systems because of horizontal gene transfers. However, the RM systems would
the temperate-phage-induced bacterial autoimmunity. However, not stop the transfer among closely related bacteria, especially
the temperature-associated switching of the life cycle of the when they have shared RM systems (Dimitriu et al., 2019).
bacteriophage of B. pseudomallei is just a piece of isolated Besides this, the CRISPR-Cas and RM systems differ in
evidence. At present, we do not know how many phages in nature many aspects (Dimitriu et al., 2020). We are open to other
have similar temperature-associated switching of life cycle as the possible explanations.
bacteriophage of B. pseudomallei.
We propose that bacterial cells lose the CRISPR-Cas systems
when bacterial mortality mostly comes from predator grazing. CONCLUSION
However, in natural environments, this does not always happen
The CRISPR-Cas systems are known to be enriched in
even below 45◦ C. Bacterial mortality is destined to be more
thermophilic and hyperthermophilic prokaryotes. In this paper,
or less contributed by viral lysis because of the widespread of
we take a step further by revealing an abrupt increase of bacterial
viruses. In addition, prey bacteria are not entirely passive to
CRISPR-Cas abundance at around 45◦ C and putting forward a
be grazed, and they could evolve grazing-resistance capacities,
new hypothesis on the thermal distribution of bacterial CRISPR-
like high motility, large size, and biofilm formation (Matz and
Cas systems. Grazing of cellular predators and viral lysis are the
Kjelleberg, 2005; Jousset, 2012; Lurling, 2021). In a long-term
primary sources of bacterial mortality; their negative interaction
arms race between prey bacteria and grazing protists/bacteria,
largely influences the tradeoffs between the costs and benefits of
the prey bacteria might, in some periods, be free of grazing risk
antivirus strategies and grazing resistance strategies. As cellular
and grazing-caused mortality because of newly evolved grazing-
predator diversities and grazing risk precipitously decline at
resistance strategies. In this case, viral lysis becomes dominant
around 45◦ C, viral lysis becomes the dominant source of bacteria
in bacterial mortality, and the bacteria experience an intense
mortality, and the requirement of adaptive immunity might be
selective pressure to have CRISPR-Cas systems. Therefore, our
increased indirectly.
hypothesis is not exclusive to CRISPR-Cas-rich psychrophilic and
mesophilic bacteria.
There is no clear pattern in archaeal CRISPR-Cas abundance DATA AVAILABILITY STATEMENT
along the axis of growth temperature (Figure 7). The difference
in CRISPR-Cas distribution between bacteria and archaea might The datasets presented in this study can be found in online
come from the physiological, genomic, or ecological differences repositories. The names of the repository/repositories
between the two domains. It is also possible that random noises and accession number(s) can be found in the article/
resulting from the small sample size have masked the thermal Supplementary Material.
distribution pattern. In a recent analysis on the relationship
between growth temperature and GC content using the Topt
dataset from the database TEMPURA (Sato et al., 2020), we AUTHOR CONTRIBUTIONS
found that Topt is significantly correlated with bacterial genome
D-KN conceived the study and wrote the manuscript. X-RL and
GC content (N = 681) but not archaeal genome GC content
Z-LL performed the analysis. All co-authors have reviewed and
(N = 155). Then, we randomly drew 155 bacteria from the 681
approved the manuscript prior to submission.
bacteria 1000 times. In > 95% rounds of resampling, the positive
correlations became statistically non-significant (p > 0.05) (Hu
et al., 2022). The results suggest that the effective sample size FUNDING
in phylogenetically related data is much smaller than the census
number of the analyzed lineages. We hope to replicate the present This work was supported by the National Natural Science
analysis in archaeal genomes in the future when several hundred Foundation of China (Grant Number 31671321).
or thousands of archaeal species are available.
Our hypothesis states that antivirus immunity is restricted
at low temperatures because bacterial mortality mostly comes ACKNOWLEDGMENTS
from grazing. However, sharp increases of antivirus immunity
We thank Quan-Guo Zhang and Wen-Hong Deng for helpful
at around 45◦ C were observed in the CRISPR-Cas systems but
discussions, Christine Pourcel and Pierre-Albert Charbit for
not in the RM systems. Here we make further speculation.
technical support and the reviewers for helpful comments.
The intense grazing pressures at low temperatures would favor
This manuscript has been released as a Pre-Print at BioRxiv
the acquirement of grazing resistance. Some grazing-resistant
(Lan et al., 2021).
genes, like that in type III secretion systems (Matz et al.,
2011) and that involved in biofilm formation (Wang et al.,
2017), have been found in genomic islands, a widespread SUPPLEMENTARY MATERIAL
tool for horizontal gene transfer (Juhas et al., 2009). In
the evolution of grazing resistance, horizontal transfer of The Supplementary Material for this article can be found online
the grazing-resistant genes would be selected. Both the at: https://www.frontiersin.org/articles/10.3389/fmicb.2022.
CRISPR-Cas systems and the RM systems could depress 773114/full#supplementary-material
Frontiers in Microbiology | www.frontiersin.org 12 March 2022 | Volume 13 | Article 773114Lan et al. Thermal Distribution of CRISPR-Cas
REFERENCES Koonin, E. V. (2018). Open questions: CRISPR biology. BMC Biol. 16:95. doi:
10.1186/s12915-018-0565-9
Anderson, R. E., Brazelton, W. J., and Baross, J. A. (2011). Using CRISPRs as a Lan, X.-R., Liu, Z.-L., and Niu, D.-K. (2021). Bacterial CRISPR-Cas abundance
metagenomic tool to identify microbial hosts of a diffuse flow hydrothermal increases precipitously at around 45◦ C: linking antivirus immunity to grazing
vent viral assemblage. FEMS Microbiol. Ecol. 77, 120–133. doi: 10.1111/j.1574- risk. bioRxiv [Preprint] bioRxiv 2021.2005.2025.445389, doi: 10.1101/2021.05.
6941.2011.01090.x 25.445389
Bernheim, A. (2017). [Why so rare if so essential: the determinants of the sparse Ledford, H. (2017). Five big mysteries about CRISPR’s origins. Nature 541, 280–
distribution of CRISPR-Cas systems in bacterial genomes]. Biol. Aujourdhui 282. doi: 10.1038/541280a
211, 255–264. doi: 10.1051/jbio/2018005 Li, G., Rabe, K. S., Nielsen, J., and Engqvist, M. K. M. (2019). Machine learning
Bernheim, A., Bikard, D., Touchon, M., and Rocha, E. P. C. (2019). Atypical applied to predicting microorganism growth temperatures and enzyme catalytic
organizations and epistatic interactions of CRISPRs and cas clusters in genomes optima. ACS Synth. Biol. 8, 1411–1420. doi: 10.1021/acssynbio.9b00099
and their mobile genetic elements. Nucleic Acids Res. 48, 748–760. doi: 10.1093/ Lurling, M. (2021). Grazing resistance in phytoplankton. Hydrobiologia 848, 237–
nar/gkz1091 249. doi: 10.1007/s10750-020-04370-3
Brock, T. D. (1985). Life at high temperatures. Science 230, 132–138. doi: 10.1126/ Lynch, M., and Marinov, G. K. (2015). The bioenergetic costs of a gene. Proc. Nat.
science.230.4722.132 Acad. Sci. U.S.A 112, 15690–15695. doi: 10.1073/pnas.1514974112
Brock, T. D. (2001). “The origins of research on thermophiles,” in Thermophiles Lyubetsky, V. A., Zverkov, O. A., Rubanov, L. I., and Seliverstov, A. V. (2020).
Biodiversity, Ecology, and Evolution, eds A.-L. Reysenbach, M. Voytek, and R. Optimal growth temperature and intergenic distances in bacteria, archaea, and
Mancinelli (Boston, MA: Springer), 1–9. plastids of rhodophytic branch. Biomed Res. Int. 2020, 3465380. doi: 10.1155/
Clarke, A. (2014). The thermal limits to life on Earth. Int. J. Astrobiol. 13, 141–154. 2020/3465380
doi: 10.1017/S1473550413000438 Madin, J. S., Nielsen, D. A., Brbic, M., Corkrey, R., Danko, D., Edwards, K., et al.
Couvin, D., Bernheim, A., Toffano-Nioche, C., Touchon, M., Michalik, J., Néron, (2020). A synthesis of bacterial and archaeal phenotypic trait data. Sci. Data
B., et al. (2018). CRISPRCasFinder, an update of CRISRFinder, includes a 7:170. doi: 10.1038/s41597-020-0497-4
portable version, enhanced performance and integrates search for Cas proteins. Makarova, K. S., Aravind, L., Grishin, N. V., Rogozin, I. B., and Koonin, E. V.
Nucleic Acids Res. 46, W246–W251. doi: 10.1093/nar/gky425 (2002). A DNA repair system specific for thermophilic Archaea and bacteria
Dimitriu, T., Marchant, L., Buckling, A., and Raymond, B. (2019). Bacteria from predicted by genomic context analysis. Nucleic Acids Res. 30, 482–496. doi:
natural populations transfer plasmids mostly towards their kin. Proc. R. Soc. B 10.1093/nar/30.2.482
Biol. Sci. 286:20191110. doi: 10.1098/rspb.2019.1110 Makarova, K. S., Wolf, Y. I., Iranzo, J., Shmakov, S. A., Alkhnbashi, O. S., Brouns,
Dimitriu, T., Szczelkun, M. D., and Westra, E. R. (2020). Evolutionary ecology and S. J. J., et al. (2020). Evolutionary classification of CRISPR-Cas systems: a burst
interplay of prokaryotic innate and adaptive immune systems. Curr. Biol. 30, of class 2 and derived variants. Nat. Rev. Microbiol. 18, 67–83. doi: 10.1038/
R1189–R1202. doi: 10.1016/j.cub.2020.08.028 s41579-019-0299-x
Engqvist, M. K. M. (2018). Correlating enzyme annotations with a large set of Makarova, K. S., Wolf, Y. I., Snir, S., and Koonin, E. V. (2011). Defense islands
microbial growth temperatures reveals metabolic adaptations to growth at in bacterial and archaeal genomes and prediction of novel defense systems.
diverse temperatures. BMC Microbiol. 18:177. doi: 10.1186/s12866-018-1320-7 J. Bacteriol. 193, 6039–6056. doi: 10.1128/JB.05535-11
Felsenstein, J. (1985). Phylogenies and the comparative method. Am. Nat. 125, Matz, C., and Kjelleberg, S. (2005). Off the hook - how bacteria survive protozoan
1–15. doi: 10.1086/284325 grazing. Trends Microbiol. 13, 302–307. doi: 10.1016/j.tim.2005.05.009
Frumkin, I., Schirman, D., Rotman, A., Li, F., Zahavi, L., Mordret, E., et al. (2017). Matz, C., Nouri, B., McCarter, L., and Martinez-Urtaza, J. (2011). Acquired
Gene architectures that minimize cost of gene expression. Mol. Cell 65, 142–153. type III secretion system determines environmental fitness of epidemic Vibrio
doi: 10.1016/j.molcel.2016.11.007 parahaemolyticus in the interaction with bacterivorous protists. PLoS One
Garamszegi, L. Z. (ed.) (2014). Modern Phylogenetic Comparative Methods and 6:e20275. doi: 10.1371/journal.pone.0020275
Their Application in Evolutionary Biology: Concepts and Practice. Berlin: Møller, A. P., and Erritzøe, J. (2000). Predation against birds with low
Springer. immunocompetence. Oecologia 122, 500–504. doi: 10.1007/s00442005
Gophna, U., Kristensen, D. M., Wolf, Y. I., Popa, O., Drevet, C., and Koonin, E. V. 0972
(2015). No evidence of inhibition of horizontal gene transfer by CRISPR–Cas Müller, V., de Boer, R. J., Bonhoeffer, S., and Szathmáry, E. (2018). An evolutionary
on evolutionary timescales. ISME J. 9, 2021–2027. doi: 10.1038/ismej.2015.20 perspective on the systems of adaptive immunity. Biol. Rev. 93, 505–528. doi:
Ho, L. S. T., and Ane, C. (2014). A linear-time algorithm for Gaussian and non- 10.1111/brv.12355
Gaussian trait evolution models. Syst. Biol. 63, 397–408. doi: 10.1093/sysbio/ Palmer, K. L., and Gilmore, M. S. (2010). Multidrug-resistant enterococci lack
syu005 CRISPR-cas. mBio 1:e00227-10. doi: 10.1128/mBio.00227-10
Høyland-Kroghsbo, N. M., Muñoz, K. A., and Bassler, B. L. (2018). Temperature, Parks, D. H., Chuvochina, M., Rinke, C., Mussig, A. J., Chaumeil, P.-A., and
by controlling growth rate, regulates CRISPR-Cas activity in Pseudomonas Hugenholtz, P. (2021). GTDB: an ongoing census of bacterial and archaeal
aeruginosa. mBio 9, e02184-18. doi: 10.1128/mBio.02184-18 diversity through a phylogenetically consistent, rank normalized and complete
Hu, E.-Z., Lan, X.-R., Liu, Z.-L., Gao, J., and Niu, D.-K. (2022). A positive genome-based taxonomy. Nucleic Acids Res. 50, D785–D794. doi: 10.1093/nar/
correlation between GC content and growth temperature in prokaryotes. BMC gkab776
Genom. 23, 110. doi: 10.1186/s12864-022-08353-7 Pasulka, A. L., Samo, T. J., and Landry, M. R. (2015). Grazer and viral impacts on
Iranzo, J., Lobkovsky, A. E., Wolf, Y. I., and Koonin, E. V. (2013). Evolutionary microbial growth and mortality in the southern California Current Ecosystem.
dynamics of the prokaryotic adaptive immunity system CRISPR-Cas in an J. Plankton Res. 37, 320–336. doi: 10.1093/plankt/fbv011
explicit ecological context. J. Bacteriol. 195, 3834–3844. doi: 10.1128/jb.00 Pernthaler, J. (2005). Predation on prokaryotes in the water column and
412-13 its ecological implications. Nat. Rev. Microbiol. 3, 537–546. doi: 10.1038/
Jansen, R., van Embden, J. D. A., Gaastra, W., and Schouls, L. M. (2002). nrmicro1180
Identification of genes that are associated with DNA repeats in prokaryotes. Reichenbach, H. (1999). The ecology of the myxobacteria. Environ. Microbiol. 1,
Mol. Microbiol. 43, 1565–1575. doi: 10.1046/j.1365-2958.2002.02839.x 15–21. doi: 10.1046/j.1462-2920.1999.00016.x
Jousset, A. (2012). Ecological and evolutive implications of bacterial defences Reimer, L. C., Vetcininova, A., Carbasse, J. S., Söhngen, C., Gleim, D., Ebeling, C.,
against predators. Environ. Microbiol. 14, 1830–1843. doi: 10.1111/j.1462-2920. et al. (2018). BacDive in 2019: bacterial phenotypic data for high-throughput
2011.02627.x biodiversity analysis. Nucleic Acids Res. 47, D631–D636. doi: 10.1093/nar/
Juhas, M., van der Meer, J. R., Gaillard, M., Harding, R. M., Hood, D. W., and gky879
Crook, D. W. (2009). Genomic islands: tools of bacterial horizontal gene Revell, L. J. (2012). Phytools: an R package for phylogenetic comparative biology
transfer and evolution. FEMS Microbiol. Rev. 33, 376–393. doi: 10.1111/j.1574- (and other things). Methods Ecol. Evol. 3, 217–223. doi: 10.1111/j.2041-210X.
6976.2008.00136.x 2011.00169.x
Frontiers in Microbiology | www.frontiersin.org 13 March 2022 | Volume 13 | Article 773114Lan et al. Thermal Distribution of CRISPR-Cas Roberts, R. J., Vincze, T., Posfai, J., and Macelis, D. (2015). REBASE—a database for mediated by integrative and conjugative elements. Environ. Microbiol. 19, DNA restriction and modification: enzymes, genes and genomes. Nucleic Acids 4620–4637. doi: 10.1111/1462-2920.13925 Res. 43, D298–D299. doi: 10.1093/nar/gku1046 Weinberger, A. D., Wolf, Y. I., Lobkovsky, A. E., Gilmore, M. S., and Koonin, E. V. Rollie, C., Chevallereau, A., Watson, B. N. J., Chyou, T.-Y., Fradet, O., McLeod, I., (2012). Viral diversity threshold for adaptive immunity in prokaryotes. mBio et al. (2020). Targeting of temperate phages drives loss of type I CRISPR–Cas 3:e00456-12. doi: 10.1128/mBio.00456-12 systems. Nature 578, 149–153. doi: 10.1038/s41586-020-1936-2 Weissman, J. L., Laljani, R. M. R., Fagan, W. F., and Johnson, P. L. F. (2019). Sato, Y., Okano, K., Kimura, H., and Honda, K. (2020). TEMPURA: database of Visualization and prediction of CRISPR incidence in microbial trait-space to growth TEMPeratures of Usual and RAre Prokaryotes. Microbes Environ. 35, identify drivers of antiviral immune strategy. ISME J. 13, 2589–2602. doi: 10. ME20074. doi: 10.1264/jsme2.ME20074 1038/s41396-019-0411-2 Shan, J., Korbsrisate, S., Withatanung, P., Adler, N. L., Clokie, M. R. J., and Galyov, Westra, E. R., van Houte, S., Oyesiku-Blakemore, S., Makin, B., Broniewski, J. M., E. E. (2014). Temperature dependent bacteriophages of a tropical bacterial Best, A., et al. (2015). Parasite exposure drives selective evolution of constitutive pathogen. Front. Microbiol. 5:599. doi: 10.3389/fmicb.2014.00599 versus inducible defense. Curr. Biol. 25, 1043–1049. doi: 10.1016/j.cub.2015.01. Simpson, G. (2022). gratia: Graceful ggplot-Based Graphics and Other Functions 065 for GAMs Fitted Using mgcv. R package version 0.6.9600. Available Williams, H. N., and Chen, H. (2020). Environmental regulation of the distribution Online at: https://gavinsimpson.github.io/gratia/ (accessed January 11, and ecology of Bdellovibrio and like organisms. Front. Microbiol. 11:19. doi: 2022). 10.3389/fmicb.2020.545070 Staniewski, M. A., and Short, S. M. (2018). Methodological review and meta- Wimmer, F., and Beisel, C. L. (2020). CRISPR-Cas systems and the paradox of analysis of dilution assays for estimates of virus- and grazer-mediated self-targeting spacers. Front. Microbiol. 10:3078. doi: 10.3389/fmicb.2019.03078 phytoplankton mortality. Limnol.Oceanogr. Methods 16, 649–668. doi: 10.1002/ Wood, S. (2017). Generalized Additive Models: An Introduction with R. Boca Raton, lom3.10273 FL: Chapman and Hall/CRC. Symonds, M. R. E., and Blomberg, S. P. (2014). “A primer on phylogenetic Zhang, Y. D., Zhang, Z. W., Zhang, H., Zhao, Y. B., Zhang, Z. C., and Xiao, J. F. generalised least squares,” in Modern Phylogenetic Comparative Methods and (2020). PADS Arsenal: a database of prokaryotic defense systems related genes. Their Application in Evolutionary Biology: Concepts and Practice, ed. L. Z. Nucleic Acids Res. 48, D590–D598. doi: 10.1093/nar/gkz916 Garamszegi (Berlin: Springer), 105–130. Takasu, H., Kunihiro, T., and Nakano, S.-I. (2014). Protistan grazing and viral lysis Conflict of Interest: The authors declare that the research was conducted in the losses of bacterial carbon production in a large mesotrophic lake (Lake Biwa). absence of any commercial or financial relationships that could be construed as a Limnology 15, 257–270. doi: 10.1007/s10201-014-0431-6 potential conflict of interest. Tansey, M. R., and Brock, T. D. (1972). The upper temperature limit for eukaryotic organisms. Proc. Nat. Acad. Sci. U.S.A. 69, 2426–2428. doi: 10.1073/pnas.69.9. Publisher’s Note: All claims expressed in this article are solely those of the authors 2426 and do not necessarily represent those of their affiliated organizations, or those of Trasanidou, D., Gerós, A. S., Mohanraju, P., Nieuwenweg, A. C., Nobrega, F. L., and the publisher, the editors and the reviewers. Any product that may be evaluated in Staals, R. H. J. (2019). Keeping crispr in check: diverse mechanisms of phage- this article, or claim that may be made by its manufacturer, is not guaranteed or encoded anti-crisprs. FEMS Microbiol. Lett. 366:fnz098. doi: 10.1093/femsle/ endorsed by the publisher. fnz098 Vale, P. F., Lafforgue, G., Gatchitch, F., Gardan, R., Moineau, S., and Copyright © 2022 Lan, Liu and Niu. This is an open-access article distributed Gandon, S. (2015). Costs of CRISPR-Cas-mediated resistance in Streptococcus under the terms of the Creative Commons Attribution License (CC BY). The use, thermophilus. Proc R. Soc. B Biol. Sci. 282:20151270. doi: 10.1098/rspb.2015. distribution or reproduction in other forums is permitted, provided the original 1270 author(s) and the copyright owner(s) are credited and that the original publication Wang, P., Zeng, Z., Wang, W., Wen, Z., Li, J., and Wang, X. (2017). Dissemination in this journal is cited, in accordance with accepted academic practice. No use, and loss of a biofilm-related genomic island in marine Pseudoalteromonas distribution or reproduction is permitted which does not comply with these terms. Frontiers in Microbiology | www.frontiersin.org 14 March 2022 | Volume 13 | Article 773114
You can also read