Reconfiguration of Brain Network Dynamics in Autism Spectrum Disorder Based on Hidden Markov Model
←
→
Page content transcription
If your browser does not render page correctly, please read the page content below

ORIGINAL RESEARCH
                                                                                                                                           published: 08 February 2022
                                                                                                                                     doi: 10.3389/fnhum.2022.774921

                                           Reconfiguration of Brain Network
                                           Dynamics in Autism Spectrum
                                           Disorder Based on Hidden Markov
                                           Model
                                           Pingting Lin 1,2,3 , Shiyi Zang 1,2,3 , Yi Bai 1,2,3 and Haixian Wang 1,2,3*
                                           1
                                             School of Biological Science and Medical Engineering, Southeast University, Nanjing, China, 2 Key Laboratory of Child
                                           Development and Learning Science (Southeast University), Ministry of Education, Nanjing, China, 3 Research Center
                                           for Learning Science, Southeast University, Nanjing, China

                                           Autism spectrum disorder (ASD) is a group of complex neurodevelopment disorders
                                           characterized by altered brain connectivity. However, the majority of neuroimaging
                                           studies for ASD focus on the static pattern of brain function and largely neglect brain
                                           activity dynamics, which might provide deeper insight into the underlying mechanism
                                           of brain functions for ASD. Therefore, we proposed a framework with Hidden Markov
                                           Model (HMM) analysis for resting-state functional MRI (fMRI) from a large multicenter
                                           dataset of 507 male subjects. Specifically, the 507 subjects included 209 subjects
                           Edited by:
                                           with ASD and 298 well-matched health controls across 14 sites from the Autism Brain
                  Kaustubh Supekar,
    Stanford University, United States     Imaging Data Exchange (ABIDE). Based on the HMM, we can identify the recurring
                      Reviewed by:         brain function networks over time across ASD and healthy controls (HCs). Then we
                           Miao Cao,       assessed the dynamical configuration of the whole-brain networks and further analyzed
               Fudan University, China
                        Xuhong Liao,
                                           the community structure of transitions across the brain states. Based on the 19 HMM
      Beijing Normal University, China     states, we found that the global temporal statistics of the specific HMM states (including
                  *Correspondence:         fractional occupancies and lifetimes) were significantly altered in ASD compared to
                       Haixian Wang
                                           HCs. These specific HMM states were characterized by the activation pattern of default
                 hxwang@seu.edu.cn
                                           mode network (DMN), sensory processing networks [including visual network, auditory
                   Specialty section:      network, and sensory and motor network (SMN)]. Meanwhile, we also find that the
         This article was submitted to
                                           specific modules of transitions between states were closely related to ASD. Our findings
       Brain Imaging and Stimulation,
                a section of the journal   indicate the temporal reconfiguration of the brain network in ASD and provide novel
    Frontiers in Human Neuroscience        insights into the dynamics of the whole-brain networks for ASD.
      Received: 13 September 2021
        Accepted: 06 January 2022          Keywords: autism spectrum disorder, Hidden Markov Models, large-scale whole-brain network, global temporal
                                           dynamics, modularity analysis
       Published: 08 February 2022
                            Citation:
     Lin P, Zang S, Bai Y and Wang H
       (2022) Reconfiguration of Brain
                                           INTRODUCTION
         Network Dynamics in Autism
 Spectrum Disorder Based on Hidden
                                           Autism spectrum disorders (ASD) are a group of complex neurodevelopment disorders, which
                       Markov Model.       are characterized by repetitive and characteristic patterns of behavior and difficulties with social
   Front. Hum. Neurosci. 16:774921.        communication and interaction (American Psychiatric Association, 2013; Guo et al., 2020). The
   doi: 10.3389/fnhum.2022.774921          current ASD prevalence in the general population is estimated to be approximately 1% or higher

Frontiers in Human Neuroscience | www.frontiersin.org                             1                                        February 2022 | Volume 16 | Article 774921
Lin et al.                                                                                                              Brain Dynamic Reconfiguration in ASD

(Developmental Disabilities, Monitoring Network, Surveillance              of discrete brain states in the timescales directly assessed from
Year 2010 Principal Investigators, and Centers for Disease                 data, which can dramatically overcome the limitations of the
Control and Prevention, 2014). Previous neuroimaging studies               previous sliding window approach (Vidaurre et al., 2016, 2017;
have indicated that ASD is related to the anomalous responses              Stevner et al., 2019). Previous studies have confirmed that the
in certain brain areas, significant alteration of functional, or           HMM can be able to capture dynamics of brain activity in
structural brain network and disturbed neural synchronization              minimal timescales (Quinn et al., 2018; Vidaurre et al., 2018b,
between brain areas (Belmonte, 2004; Tang et al., 2014; Zhan               2019; Stevner et al., 2019). For example, recent studies on
et al., 2014; Cerliani et al., 2015; Duan et al., 2017). Especially,       magnetoencephalography (MEG) have found that the HMM
the majority of functional neuroimaging studies based on resting-          can capture the dynamics of brain activities in a resting state
state fMRI have shown the under-connectivity hypothesis has                as little as 100 ms (Quinn et al., 2018; Vidaurre et al., 2018b,
been proposed based on the reduced intraregional functional                2019). In addition, previous studies have suggested that the HMM
connectivity (FC) between default mode network (DMN) and                   can provide a rich description for brain dynamics in the short
sensory processing network (Belmonte, 2004; Just, 2004; Just               timescales and can be applied to probe the reconfiguration of
et al., 2006, 2012; Anderson et al., 2010; Kana et al., 2011).             the whole-brain dynamics for psychiatric illnesses [e.g., major
For example, the FC between DMN [including the medial                      depression disorder (MDD)] (Wang et al., 2020). In this study,
prefrontal cortex (mPFC), posterior cingulate cortex (PCC),                we employed an HMM analysis in a large multicenter data of ASD
and precuneus], temporal pole, and pallidum was significantly              to identify the brain states from resting-state fMRI in minimum
reduced (Yerys et al., 2015). Other studies also found a similar           timescale. We aim to investigate the temporal dynamics and to
reduced FC between mPFC and primary motor and sensory                      characterize the spatiotemporal specificity of brain activity in
cortices (Jung et al., 2014), even temporoparietal junction, insula,       short timescale for ASD.
and amygdala (Von dem Hagen et al., 2012). Some resting-state
fMRI studies have found the phenomena of the over-connectivity
or a mixture of under- and overconnectivity in ASD (Keown                  MATERIALS AND METHODS
et al., 2013; Supekar et al., 2013; Cerliani et al., 2015). Although
the underconnectivity patterns are not consistent, the FC from             Participants
resting-state fMRI provides new insights into the underlying               Resting-state fMRI data from 507 subjects, including 209 ASD
neurological mechanisms for ASD.                                           subjects and 298 HCs, from 14 sits in the ADIDE database were
    Numerous previous findings in ASD are based on the                     analyzed in this study.1 The inclusion and exclusion were adopted
assumption that resting-state FC is relatively stable over time,           as same as the previous studies (Di Martino et al., 2014; Chen
which neglects the spontaneous fluctuations in brain activity              et al., 2017). Briefly, all subjects were male, from these sites,
and dynamics of brain networks (Chen et al., 2017). However,               in which 75% of subjects had a full-scale IQ score (FIQ). Only
abundant evidence has indicated that the human brain can be                subjects with FIQ within 2 SD + mean across all the Autism
seen as a complex dynamic system, in which transition smoothly             Brain Imaging Data Exchange (ABIDE) samples and with mean
and continuously between brain states is directly related to               framewise displacement (FD) below 2 SD + mean were included.
cognitive function (Sheline et al., 2010; Deco et al., 2011; Gu            Moreover, all the subjects had complete anatomical images and
et al., 2017; Lin et al., 2017). Recent works also suggest that            functional imaging scans. It is important to note that we tried
the brain activity and brain network from the rest-stating fMRI            to build a well-matched dataset to control the effects across
are dynamic and that the dynamical FC states can be captured               sites, which were consistent with the previous study (Chen et al.,
from resting-state fMRI (Allen et al., 2012; Hutchison et al.,             2017). Specifically, we first applied a data-driven algorithm that
2013b; Damaraju et al., 2014; Zalesky et al., 2014; Liu, 2016).            maximized the p-values of the group difference of age, FIQ,
Importantly, the latest studies about dynamic FC have shown                and mean FD (using two-sample t-tests). Then, to exclude the
that the specifically dynamic FC states found can be characterized         influence of the site interaction effect, we also maximized the
by weaker connectivity strength in ASD and that state-related              p-values of the interaction effects between sites and diagnostic
dynamic FC can improve the sensitivity in classifying ASD from             groups of age, FIQ, and FD (using ANOVA). Details of the
the healthy (Wee et al., 2016; He et al., 2018; Xiaonan Guo et al.,        demographic information are shown in Table 1.
2020). Therefore, advances from extensive studies have suggested               All the preprocessing of resting state-fMRI was performed
that the dynamic FC may be a potential biomarker of ASD.                   using the Statistical Parameter Mapping 8 (SPM8)2 and the Data
    The most common technique used for dynamic FC is the use               Processing Assistant for Resting-State fMRI (DPARSF) toolbox.3
of sliding windows for resting-states fMRI (Wendling et al., 2009;         The main preprocessing steps include removing the first 10 time-
Allen et al., 2014; Vidaurre et al., 2018a; Mokhtari et al., 2019).        points, temporal and head motion correction, normalization
However, the sliding windows approach has some limitations                 to Montreal Neurological Institute (MNI), smoothing with a
(Hutchison et al., 2013a; Leonardi and van de Ville, 2015; Zalesky         Gaussian kernel [full width at half maximum (FWHM) = 8 mm]
and Breakspear, 2015; Hindriks et al., 2016; Preti et al., 2017).          and band-pass filtering (0.01–0.1 Hz). Spatial smoothing was a
For example, the neural process observed from brain activity is
highly dependent on the window (e.g., the temporal width of the            1
                                                                             http://fcon_1000.projects.nitrc.org/indi/abide/
window and length of step). Fortunately, Hidden Markov Model               2
                                                                             http://www.fil.ion.ucl.ac.uk/spm
(HMM) describes the brain activity as a dynamics sequence                  3
                                                                             http://rfmri.org/DPARSF

Frontiers in Human Neuroscience | www.frontiersin.org                  2                                          February 2022 | Volume 16 | Article 774921
Lin et al.                                                                                                                 Brain Dynamic Reconfiguration in ASD

TABLE 1 | Demographics of participants.                                               distribution parameters. Thus, the states correspond to unique
                                                                                      patterns of brain activity that recur in different parts of the time
                            ASD                  HC                 Group
                          (n = 209)           (n = 298)          comparisons          series. For each time point, a state variable dictates the probability
                                                                   (p-value)          of each state being active at that moment, thus we can determine
                                                                                      which state is activated according to the maximum probability of
Age                       16.5 ± 6.2          16.8 ± 6.2            0.5642a
                                                                                      each state. In other words, only one state may occur at a given
Site × group                  –                   –                 0.9642b
                                                                                      time point and the next state is only dependent on the current
interaction
                                                                                      state. Notably, we cannot directly observe the state from data
Full Scale IQ             111 ± 13            110 ± 11              0.7191a
Site × group                  –                   –                 0.8502b
                                                                                      because the state is abstract (hidden). The relationship between
interaction                                                                           hidden states and our observed data can be observed through an
Mean FD                   0.14 ± 0.1          0.14 ± 0.1            0.7219a           observation model, as shown in Figure 1. In the HMM approach,
Site × group                  –                   –                 0.8341b           each state has its observation model, from which we can obtain
interaction                                                                           the probability distribution of our system is in that state based on
High head motion        14.99 ± 20.78       14.77 ± 21.26           0.9091a           the observed data.
timepointsc                                                                              In this study, we first obtained the representative time
ADI-R                                                                                 courses of 90 regions of interests (ROIs) for all subjects
Social score                20 ± 5                –                   –               (including 209 patients with ASD and 298 HCs) though
Communication               16 ± 4                –                   –               averaged all time courses over voxels within ROI. Then, 90-
score
                                                                                      time courses from ROIs were demeaned by being divided by
RRB score                    6±3                  –                   –
                                                                                      their standard deviation. Next, we respectively concatenate all
ADOS
                                                                                      time courses for each ROI across participants (including ASD
Total score                 12 ± 4                –                   –
                                                                                      and controls) and yield a data matrix. It is important to
Social score                 8±3                  –                   –
                                                                                      note that although it is possible to apply the HMM on each
Communication                4±1                  –                   –
                                                                                      subject or each group independently, we applied the HMM
score
                                                                                      on all the concatenated all-time courses. Thus, the states and
RRB score                    2±1                  –                   –
                                                                                      the transition probabilities inferred by HMM were defined at
ADI-R, autism diagnostic interview-revised; ADOS, autism diagnostic observation       the group level to obtain the matched states across ASD and
Schedule; RRB, restricted and repetitive behaviors.
a The two-sample t-test.                                                              HC. Finally, we estimated the number of recurring discrete
b ANOVA.                                                                              states across through an HMM with multivariate Gaussian
c Defined as the number of the timepoints whose framewise displacement
                                                                                      distribution. Importantly, each HMM state can be modeled as a
(FD) > 0.5 mm and the preceding time point and the following two timepoints.
                                                                                      multivariate normal distribution (including the mean activation
                                                                                      distribution and an FC matrix). The mean activation distribution
very common preprocessing step for functional brain images.                           represents the mean level of state activity in brain regions.
However, there is a great deal of debate about the choice                             The FC matrix summarizes the pairwise temporal co-variations
of smoothing kernel. Previous studies suggested the optimal                           occurring between brain regions. Moreover, although the HMM
FWHM was about 8 mm based on the influence of spatial                                 was also considered as a tool for dimensionality reduction of
smoothing on fMRI group activation and FC analysis. In                                data, there exist severe overfitting problems during estimating
addition, signals from white matter (WM) and cerebrospinal fluid                      parameters per state due to the high spatial dimensionality
(CSF), as well as 24 rigid body motion parameters, were regressed                     of fMRI (Vidaurre et al., 2016). To address this problem, we
out. Finally, it was based on the automated anatomical labeling                       carry out the principal component analysis for 90 ROI time
(AAL) template extract the averaged fMRI time series in 90 brain                      courses across all the subjects before HMM inference as the
regions (including cortical and subcortical brain areas). The AAL                     previous studies (Vidaurre et al., 2016). We finally used the top
template was one of the most frequently used in fMRI studies of                       32 principal components, which keep approximately 90% of the
FC for ASD. The previous study about non-rapid eye movement                           signal variance.
(NREM) sleep based on HMM analysis indicated that the results
were highly robust across different templates (Stevner et al.,
2019). This study was supported by the Academic Committee                             Choice of Number of Hidden Markov
of the School of Biological Sciences and Medical Engineering,                         Model States
Southeast University, China.                                                          Based on the variational Bayesian inference, the HMM was
                                                                                      implemented by probabilistically estimating the state statistics
Hidden Markov Models                                                                  and transition probabilities (Vidaurre et al., 2016). Notably, there
To probe the alteration of whole-brain dynamics for ASD,                              is a central and free parameter, the number of HMM states
we applied the HMM to obtain a group estimation of brain                              should be determined before HMM inference (Vidaurre et al.,
microstates. Briefly, the HMM can describe brain activity as a                        2016; Stevner et al., 2019) because different numbers of states
dynamic sequence of discrete recurring brain states (Vidaurre                         in practice offer only different levels of detail of brain dynamics.
et al., 2016). All states are mutually exclusive and Markovian                        Previous studies have found that we can choose the number of
has the same probabilistic distributions but each has different                       states underlying the spontaneous brain activity in several ways,

Frontiers in Human Neuroscience | www.frontiersin.org                             3                                   February 2022 | Volume 16 | Article 774921
Lin et al.                                                                                                                      Brain Dynamic Reconfiguration in ASD

  FIGURE 1 | Schematic illustration of the whole-brain dynamics using a Hidden Markov Model (HMM).

such as using quantitative measures like free energy or using non-                 spectral community detection algorithm using Matlab function
parametric approaches (Vidaurre et al., 2016, 2017, 2018a,b, 2019;                 from the Brain Connectivity Toolbox4 (Newman, 2006; Rubinov
Stevner et al., 2019). Therefore, in this study, we evaluated the                  and Sporns, 2010). Notably, we only keep 25% of the strongest
summary statistic (including minimum free energy and medial                        transitions in a matrix of transition probabilities.
fractional occupancy) for the different number of HMM states
with a range of 4–45.                                                              Statistical Analysis
                                                                                   To test significant differences in global dynamics, we performed,
Analysis of Temporal Characterizations                                             respectively, two-tail two-sample t-tests for fractional occupancy,
of Hidden Markov Model States                                                      lifetimes, and interval times of HMM states between patients with
Upon the inferred HMM, a time course of probabilities can                          subjects with ASD and HCs. In particular, age was considered
be assessed through the HMM Bayesian inference. Each value                         an irrelevant variable and was regressed out to remove its
represents the probability that a state is active at a time                        effects. And the threshold p < 0.05 Bonferroni correction was
point. Then we can compute the global statistics reflecting the                    set to determine the significance level. Noteworthy, although
properties and dynamics of the HMM state from the probabilities                    some measures during subject selection were adopted to avoid
courses (Vidaurre et al., 2017; Quinn et al., 2018). In this study,                the effects of data sites or FIQ and a well-matched dataset
we obtained three global temporal characterizations of HMM                         was obtained in this study, we again performed, respectively,
states, including fractional occupancies, lifetimes, and interval                  statistical analysis for temporal characterizations of HMM
times. Specifically, fractional occupancies of HMM states are the                  states with regressing out the sites and FIQ to verify the
ratio of the activated HMM states across the all-time course.                      robustness of the results.
The lifetime is computed as the amount of time spent in a
state before moving into a new state, which interval time is
calculated as the amount of time between consecutive visits                        RESULTS
to a state (Vidaurre et al., 2017; Quinn et al., 2018). These
characterizations are the most commonly effectively captured                       Nineteen Hidden Markov Model States
within-subject temporal dynamics.                                                  Were Identified Using Hidden Markov
                                                                                   Model
Analysis of Transitions of Hidden Markov                                           First, HMM states were estimated on resting-state fMRI data
Model State                                                                        from 517 subjects (including 209 subjects with ASD and 298
Furthermore, to investigate the organization of the transition                     HCs). Before estimating HMM states, the minimum free energy,
probabilities, which were explicitly modeled by the HMM, a                         and medial fractional occupancy were used to determine the
network-based clustering technique (also called the community                      number of HMM states. The global statistics mainly included
detection technique) was adopted to the matrix of transition                       minimum free energy and medial fractional occupancy across the
probability between HMM states. The HMMs states into a                             HMM states. As shown in Figure 2, we found that the minimum
certain community have more frequent transitions with others                       free energy was monotonically decreased with the increase of the
in the same community than in other communities. In this                           number of HMM states, showing no negative peak. Therefore,
study, we adopted a modularity maximization approach to                            consistent with previous studies of HMM, the free energy failed
detect the community of the matrix of transition probabilities
and optimized the modularity quality function using Newman’s                       4
                                                                                       https://www.nitrc.org/projects/bct

Frontiers in Human Neuroscience | www.frontiersin.org                          4                                            February 2022 | Volume 16 | Article 774921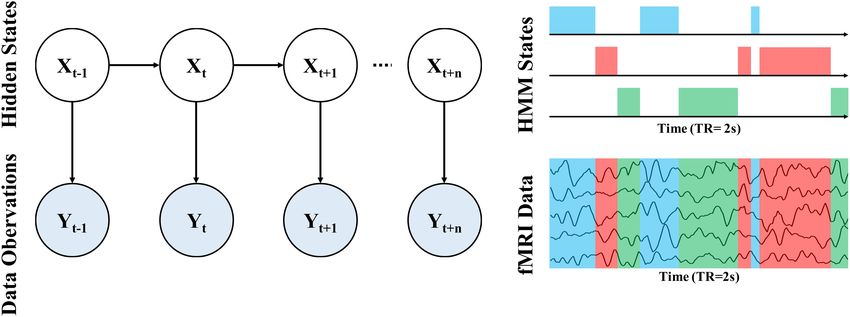
Lin et al.                                                                                                Brain Dynamic Reconfiguration in ASD

  FIGURE 2 | The choice of the number of HMM states.

to provide valid information for the choice of the number of            and interval times. Specifically, as shown in Figure 3, compared
HMM states. A similar phenomenon is also reflected in the               to HCs, we found that fractional occupancies of HMM states
development of median fractional occupancy. Fortunately, we             4, 8, 9, and 10 for ASD subjects were significantly decreased
found that the median fractional occupancy decreased rapidly for        (Without regressing out sites and FIQ: State 4: p = 4.71 × 10⁻⁵ ,
the smaller number of states and ceased around the number for           t-value = −4.09; State 8: p = 4.78 × 10⁻⁵ , t-value = −4.09;
19, which suggested a higher number of states might cause the           State 9: p = 0.0015, t-value = −3.18; State 10: p = 3.93 × 10⁻⁷ ,
occurrence of sporadic states, which might only appear in a few         t-value = −5.12; With regressing out sites and FIQ: State 4:
subjects. Hence, Based on these results above, this study finally       p = 1.00 × 10⁻⁴ , t-value = −3.90; State 8: p = 5.7 × 10⁻⁴ ,
estimated 19 HMM states.                                                t-value = −3.46; State 9: p = 4.5 × 10⁻⁴ , t-value = −3.52; State
                                                                        10: p = 2.11 × 10⁻⁶ , t-value = −4.78; two-tailed two-sample,
Global Temporal Statistics Exhibited                                    Bonferroni correction). And fractional occupancies 2, 3, 14, and
Specific Alteration for Autism Spectrum                                 17 for ASD were significantly increased (Without regressing out
Disorder                                                                sites and FIQ: State 2: p = 3.03 × 10⁻⁵ , t-value = 4.20; State
Then, to probe the temporal alterations of brain network for            3: p = 8.01 × 10⁻⁵ , t-value = 3.96; State 14: p = 3.61 × 10⁻⁴,
ASD, we calculated and compared the global temporal statistics          t-value = 3.58; and State 17: p = 3.07 × 10⁻⁴ , t-value = 3.66;
of HMM states, including the fractional occupancies, lifetimes          With regressing out sites and FIQ: State 2: p = 2.09 × 10⁻⁴ ,

Frontiers in Human Neuroscience | www.frontiersin.org               5                                 February 2022 | Volume 16 | Article 774921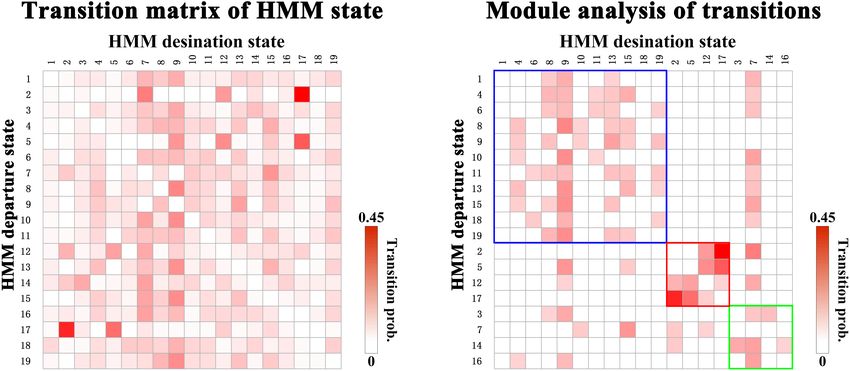
Lin et al.                                                                                                            Brain Dynamic Reconfiguration in ASD

t-value = 3.73; State 3: p = −0.0015, t-value = 3.19; State 14:
p = 2.04 × 10⁻⁴ , t-value = 3.73; and State 17: p = 0.0049,
t-value = 2.82; two-tailed two-sample, Bonferroni correction).
As expected, lifetimes of participants with ASD had a similar
alteration with fractional occupancies. Lifetimes of ASD subjects
expressed significantly decreased in HMM 8, 9, and 10 (Without
regressing out sites and FIQ: State 8: p = 1.24 × 10⁻⁶ ,
t-value = −4.89; State 9: p = 0.0012, t-value = −3.26; State 10:
p = 1.86 × 10⁻⁶ , t-value = −4.31; With regressing out sites
and FIQ: State 8: p = 5.11 × 10⁻⁵ , t-value = −4.07; State
9: p = 0.0017, t-value = −3.15; State 10: p = 1.51 × 10⁻⁴ ,
t-value = −3.81; two-tailed two-sample, Bonferroni correction)
and increased in HMM 2, 3 and 17 (Without regressing out
sites and FIQ: State 2: p = 2.76 × 10⁻⁴ , t-value = 3.62; State
3: p = 0.0016, t-value = 3.23; State 17: p = 3.45 × 10⁻⁵ ,
t-value = 4.16; With regressing out sites and FIQ: State 2:
p = 0.0026, t-value = 3.03; State 3: p = 0.006, t-value = 2.75; State
17: p = 0.001, t-value = 3.28; two-tailed two-sample, Bonferroni
correction). Meanwhile, interval times of HMM State 17 was
increased for ASD subjects (Without regressing out sites and
FIQ: State 17: p = 0.003, t-value = 4.17, two-tailed two-sample,
Bonferroni correction). Our results indicated that there was the
temporal reconfiguration of large-scale brain network for ASD
subjects, which were able to be characterized by global temporal
statistics of brain microstates.

Specific Community Structure of
Transitions for Autism Spectrum
Disorder
Next, we organize the whole-brain network states into a
transition map and carried out a modularity analysis about the
19 × 19 transition probability matrix. Based on the most frequent
transitions between the HMM states across all the subjects
(including subjects with ASD and HCs), we found that the
transition map was organized into a specific community structure
with three partitions (modularity index = 0.3332) (Figure 4).
Further combined with the global statistics, three modules in the
transition map were respectively considered as the HC-related
module and the ASD-related modules (including modules I and
II). The HC-related module was characterized by the HMM
state 4, 8, 9, and 10, whose global statistics, including fractional
occupancies and lifetimes, were significantly increased in HCs.
Correspondingly, the HMM states 2 and 17 were included in
the ASD-related module I and the HMM states 3 and 14 in the
ASD-related module II. These HMM states were higher fractional
occupancies and longer lifetimes for subjects with ASD.
                                                                             FIGURE 3 | Alteration of the global temporal characterizes in autism spectrum
                                                                             disorder (ASD). *Represented the significant difference between ASD and HC
Spatial Activation Maps of Whole-Brain                                       (p < 0.05).
States for Autism Spectrum Disorder
Finally, we further probed the spatial activation maps of the
whole-brain microstates in the HC-related module and the ASD-
related module. As shown in Figure 5, we found that in the                  cingulate cortex (ACC and PCC)] and the increased activation
HC-related module, the HMM state 4 was mainly characterized                 in the bilateral superior and middle occipital gyrus and fusiform.
by the decreased activation in the bilateral medial and superior            The HMM state 8 showed the decrease in the bilateral medial
frontal gyrus, the bilateral middle and superior temporal and the           orbitofrontal gyrus, the left PCC, precuneus, para-hippocampal
cingulate cortex [including the bilateral anterior and posterior            and angular, the bilateral rectus, and the bilateral medial temporal

Frontiers in Human Neuroscience | www.frontiersin.org                   6                                        February 2022 | Volume 16 | Article 774921
Lin et al. Brain Dynamic Reconfiguration in ASD FIGURE 4 | The modules of transitions between HMM states. FIGURE 5 | The mean activation maps for states 4, 8, 9, and 10 in the healthy control (HC)-related module. pole and the bilateral superior temporal gyrus, the bilateral superior frontal gyrus, the bilateral anterior and PCC and the inferior frontal gyrus, and the supramarginal gyrus. The HMM bilateral rectus). The HMM state 10 was mainly characterized state 9 showed the decreased activation in subcortical areas by decreased activation in the bilateral thalamus, precuneus, and sensory (the bilateral thalamus, the bilateral putamen, left PCC, calcarine lingual gyrus, and superior temporal gyrus and by insula, and the bilateral pallidum) and motor and sensory areas increased activation in the bilateral superior and medial temporal (including the bilateral central gyrus, bilateral lingual gyrus, and inferior orbitofrontal gyrus. Then we found the ASD-related the bilateral Rolandic operculum area, the bilateral middle module included two partitions. One was mainly characterized occipital gyrus, and the bilateral supramarginal gyrus), and the by the HMM state 2 and 17 (the ASD-related module I) and increased activation in DMN (including the bilateral medial and another by the HMM 3 and 14 (the ASD-related module II). Frontiers in Human Neuroscience | www.frontiersin.org 7 February 2022 | Volume 16 | Article 774921
Lin et al.                                                                                                             Brain Dynamic Reconfiguration in ASD

  FIGURE 6 | The mean activation maps for states 2 and 17 in the ASD-related module I.

  FIGURE 7 | The mean activation maps for states 3 and 14 in the ASD-related module II.

As shown in Figure 6, in the ASD-related module I, the HMM                          subjects from multicohorts through the HMM approach and
state 2 showed the decrease in orbit-frontal gyrus, ACC, rectus,                    found the temporal reconfiguration of HMM states for ASD,
the superior and medial frontal gyrus, and the decrease in sensor                   which provides a richer temporal description in a smaller time
and motor network and (including postcentral gyrus, paracentral                     scale compared with previous studies using the sliding-window
lobule, supplementary motor area, and superior parietal lobule),                    approach. Meanwhile, we adopted the community analysis to the
auditory network (Heschel gyrus and superior temporal gyrus)                        HMM transition map and found the special transition pattern
and DMN (including PCC and precuneus). The HMM states                               between HMM states for subjects with ASD, which previous
17 showed the decrease in temporal gyrus and superior and                           studies did not fully capture.
medial frontal gyrus and the increase in the visual and auditory                       Previous studies based on fMRI have identified dynamic re-
network (calcarine, cuneus, lingual gyrus, and occipital gyrus).                    configurations of large-scale brain activity voxel-wise changes
Meanwhile, as shown in Figure 7, in another ASD-related module                      (Guo et al., 2017), changes in connection strength (Anderson
(the ASD-related module II), state 3 showed the decrease in the                     et al., 2010; Cerliani et al., 2015; Guo et al., 2018), or through
visual network (including the bilateral occipital gyrus, fusiform                   long-temporal dependencies of the blood oxygen level dependent
and superior parietal gurus), and the increase in the DMN (the                      (BOLD) signal (Falahpour et al., 2016; Chen et al., 2017; He
bilateral ACC and the bilateral superior and medial frontal gyrus).                 et al., 2018) for ASD. However, HMM analysis is a probabilistic
State 14 showed the decreased activation in the bilateral inferior                  representation in the space of whole-brain network states and
parietal gyrus, the ACC, the middle frontal gyrus, and the middle                   transitions, which might provide novel insights into neural
and inferior occipital gyrus and the increased activation in the                    mechanisms of ASD. Here, 19 HMM states recurring across time
middle temporal gyrus.                                                              were identified for ASD and the healthy, which was consistent
                                                                                    with previous findings that FC of the brain is highly dynamic
                                                                                    and can represent flexibility in functional coordination between
DISCUSSION                                                                          distinct brain systems (Watanabe and Rees, 2017; He et al.,
                                                                                    2018; Guo et al., 2020). Further, we analyzed the alteration
In this study based on a large sample dataset, we probe                             of the global temporal characterization for each HMM state.
the dynamic complexity and dissimilarity in spatiotemporal                          Our results showed that compared to the health, fractional
patterns of brain activity between subjects with ASD and                            occupancies of states 4, 8, 9, and 10 were significantly decreased
the health. We identified 19 recurring brain states for all                         in ASD, while fractional occupancies of states 2, 3, 14, and

Frontiers in Human Neuroscience | www.frontiersin.org                           8                                  February 2022 | Volume 16 | Article 774921
Lin et al. Brain Dynamic Reconfiguration in ASD 17 were significantly increased. These findings are consistent (calcarine, cuneus, lingual gyrus, and occipital gyrus). Our with previous findings that subjects with ASD and HCs have a findings are also consistent with previous studies on ASD that significantly different pattern of state organization. Numerous suggest FC of DMN, SMN, visual, and auditory networks in previous studies have reported the significant alteration in time- ASD is significantly altered compared with controls. Previous vary patterns in ASD. For example, recent work observed that studies have reported the decreased FC between ACC/mPFC ASD significantly increased durations of functional connections and other DMN regions for individuals with ASD (Assaf et al., in both individual brain regions and distributed networks, and 2010; Weng et al., 2010). The decreased intra-hemispheric FC in the abnormal alteration was closely related to the disease severity mPFC, fusiform gyrus, and inferior temporal gyrus for ASD was (King et al., 2018). Further, the width of cross-correlation curves also found (Anderson et al., 2010; Lee et al., 2016). The recent between resting-states fMRI time series could be used as a work also suggested that abnormalities in the above regions can metric of the relative duration of synchronous activity between be identified as neurofunctional markers for social impairments brain regions (also called “sustained connectivity”) in ASD (King of ASD (Patriquin et al., 2016). Together with our results, and Anderson, 2018). In addition, the sustained connectivity these findings consistently highlight the potential role of the in ASD may limit the ability to rapidly shift one brain state neural circuits associated with DMN (including ACC and mPFC) to another and is negatively related to processing speed and and sensory processing networks (including fusiform gyrus and sustained connectivity (King and Anderson, 2018). Meanwhile, inferior temporal gyrus) in the pathophysiological mechanisms other studies also found that impaired cognition function in ASD underlying ASD. Meanwhile, consistent with the latest dynamical may be associated with the alteration of brain states. Interestingly, FC findings (Guo et al., 2018, 2020), our findings complement the late study using an energy-landscape analysis reported that our understanding of the functional organization for ASD from a high-functioning adults with ASD show fewer neural transitions dynamic perspective. due to an unstable intermediate state (Watanabe and Rees, 2017). Compared to the sliding window approach, the HMM Similar aberrant temporal dynamics were reported by the study approach provides a more rich description of brain dynamics by Rashid et al. (2014) who found longer dwell times related to without any predefined timescale information, e.g., the width a globally disconnected state in youth with higher autistic traits. of the window and step. However, two main methodological A mass of studies has found that individuals with ASD and health limitations of this study should be considered: the short-range showed significantly different occurrences in two functional dependency between HMM states and the number of HMM states. Particularly, individuals with ASD spent more time in a states. The former is mainly caused by two assumptions of the state with weak dynamical FC patterns and less negative dynamic HMM applied to brain activity data. One assumption of the FC between DMN and other networks, while the health spent HMM is the state, which is mutually exclusive (Vidaurre et al., more time in a state with both positive and negative dynamical FC 2016, 2018b). Another assumption in the HMM approach is that patterns (Rabany et al., 2019). In summary, our results provide when a state at a certain time point is known, the next state new insights about the dynamical alteration of brain activity will be predicted without information of time courses before this in ASD and offer additional evidence for the evaluation of the point. So, there is a short-range dependency between HMM state impacts of psychiatric ASD. occurrences, which is inconsistent with the previous study that To further, we combined with the community detection for the brain exhibits the long-range dependency of HMM states. the transition map between HMM states and indicate that ASD Therefore, the HMM has methodological limitations for precisely and HCs have respectively their specific community structures characterizing the brain states. However, recent studies indicate for the transition map between HMM states. Particularly, two the certain type of long-range dependency of HMM in the form modules are closely related to ASD. The ASD-related module I of metastates, even when these are not explicitly parameterized was characterized by the HMM states 2 and 17 and The ASD- in the model (Vidaurre et al., 2017, 2018a,b; Stevner et al., 2019). related module II was characterized by the HMM states 3 and 14. In a word, the HMM does not infer the long-range dependency Noteworthy, in ASD-related module II, two characterize HMM of HMM, but we can freely discover the long-range dependency states showed the opposite trend of activation in the DMN. State inherent to the bran data through the inferred HMM state 3 showed the increase in DMN (including ACC and superior and sequence. The latter is mainly caused by the choice of the number medial frontal gyrus), and state 14 showed the decrease in the of HMM states, which is a free parameter, and is difficult to corresponding area. Meanwhile, HMM states 3 and 14 showed determine a correct number of states according to the recording similar activation in visual (including fusiform and parietal gyrus brain activity. Meanwhile, neither the sliding-window approach and occipital gyrus). In addition, we also found the other specific nor the HMM approach has capable of decomposing the explicit pattern of activation for the HMM states 2 and 17 in the number of intrinsic states of brain activity (Hutchison et al., ASD-related module I. Specifically, the HMM states 2 and 17 2013a; Hindriks et al., 2016; Vidaurre et al., 2017; Stevner et al., respectively showed a similarly increased activation in a part of 2019). In this study, we identify 19 HMM states according to the sensory and motor network (SMN), visual, and auditory network. global temporal statists, e.g., free energy and median fractional HMM state 2 showed the increased activation in SMN (including occupancy, which is not a generalizing number for different postcentral gyrus, paracentral lobule, supplementary motor area, brain datasets. In addition, there was also a limitation regarding and superior parietal lobule) and auditory network (including the data organization in this study. Before the HMM inference, Heschel gyrus and superior temporal gyrus). The HMM state 17 the subject-specific sets of 90 ROI timecourses were demeaned, showed increased activation in the visual and auditory network divided by their SD, and concatenated across all the subjects Frontiers in Human Neuroscience | www.frontiersin.org 9 February 2022 | Volume 16 | Article 774921
Lin et al.                                                                                                                                     Brain Dynamic Reconfiguration in ASD

to obtain a group estimation about the state. Noteworthy, it                                    ETHICS STATEMENT
is possible to apply the HMM on each subject or each group
independently to explore the different spatial patterns across the                              The studies involving human participants were reviewed and
ASD and HC groups, which will bring a new challenge of state                                    approved by the Academic Committee of the School of Biological
matching across subjects or groups. Moreover, more amount of                                    Sciences and Medical Engineering, Southeast University, China.
time points can infer more robust states during HMM inference.                                  The patients/participants provided their written informed
   In summary, we propose a data-driven analysis approach                                       consent to participate in this study.
(the HMM with multivariable Gaussian distribution) allowing
the investigation of the dynamic alterations in the whole-
brain network between ASD and controls. Based on the
brain microstates identified by HMM, we found that the
                                                                                                AUTHOR CONTRIBUTIONS
reorganization of intrinsic brain states at time scales for ASD                                 PL and SZ performed the statistical analysis and wrote the first
and the special communities for ASD was characterized by the                                    draft of the manuscript. YB and HW contributed to the design of
decreased activation in sensory processing networks (including                                  the study. All authors contributed to manuscript revision, read,
visual network, auditory network, and SMN) and the increased                                    and approved the submitted version.
activation in the DMN. These findings provide new insights into
the large-scale dynamic circuit organization of the brain and
suggest that brain dynamics should remain a prime target for
further ASD research, especially regarding the intrinsic states                                 FUNDING
underlying brain activity.
                                                                                                This study was supported in part by the National Natural
                                                                                                Science Foundation of China under (Grant No. 62176054), the
DATA AVAILABILITY STATEMENT                                                                     Fundamental Research Funds for the Central Universities under
                                                                                                (Grant No. 2242021k30014), the Fundamental Research Funds
Publicly available datasets were analyzed in this study. This                                   for the Central Universities under (Grant No. 2242021k30059),
data can be found here: http://fcon_1000.projects.nitrc.org/indi/                               and the Postgraduate Research and Practice Innovation Program
abide/.                                                                                         of Jiangsu Province of China under (Grant No. KYCX17_0160).

REFERENCES                                                                                      Developmental Disabilities, Monitoring Network, Surveillance Year 2010 Principal
                                                                                                   Investigators, and Centers for Disease Control and Prevention (2014).
Allen, E. A., Damaraju, E., Plis, S. M., Erhardt, E. B., Eichele, T., and Calhoun,                 Prevalence of autism spectrum disorder among children aged 8 years - autism
   V. D. (2012). Tracking Whole-Brain Connectivity Dynamics in the Resting                         and developmental disabilities monitoring network, 11 sites, United States,
   State. Cereb. Cortex 24, 663–676. doi: 10.1093/cercor/bhs352                                    2010. MMWR Surveill. Summ. 63, 1–21.
Allen, E. A., Damaraju, E., Plis, S. M., Erhardt, E. B., Eichele, T., and Calhoun, V. D.        Di Martino, A., Yan, C. G., Li, Q., Denio, E., Castellanos, F. X., Alaerts, K.,
   (2014). Tracking whole-brain connectivity dynamics in the resting state. Cereb.                 et al. (2014). The Autism Brain Imaging Data Exchange: towards Large-Scale
   Cortex 24, 663–676.                                                                             Evaluation of the Intrinsic Brain Architecture in Autism. Mol. Psychiatry 19,
American Psychiatric Association (2013). Diagnostic and Statistical Manual of                      659–667. doi: 10.1038/mp.2013.78
   Mental Disorders. Virginia: American Psychiatric Association.                                Duan, X., Chen, H., He, C., Long, Z., Guo, X., Zhou, Y., et al. (2017). Resting-
Anderson, J. S., Druzgal, T. J., Froehlich, A., DuBray, M. B., Lange, N., Alexander,               state functional under-connectivity within and between large-scale cortical
   A. L., et al. (2010). Decreased Interhemispheric Functional Connectivity in                     networks across three low-frequency bands in adolescents with autism. Prog.
   Autism. Cereb. Cortex 21, 1134–1146. doi: 10.1093/cercor/bhq190                                 Neuropsychopharmacol. Biol. Psychiatry 79, 434–441. doi: 10.1016/j.pnpbp.
Assaf, M., Jagannathan, K., Calhoun, V. D., Miller, L., Stevens, M. C., Sahl, R.,                  2017.07.027
   et al. (2010). Abnormal functional connectivity of default mode sub-networks                 Falahpour, M., Thompson, W. K., Abbott, A. E., Jahedi, A., Mulvey, M. E., Datko,
   in autism spectrum disorder patients. Neuroimage 53, 247–256. doi: 10.1016/j.                   M., et al. (2016). Underconnected, But Not Broken? Dynamic Functional
   neuroimage.2010.05.067                                                                          Connectivity MRI Shows Underconnectivity in Autism Is Linked to Increased
Belmonte, M. K. (2004). Autism and Abnormal Development of Brain                                   Intra-Individual Variability Across Time. Brain Connect. 6, 403–414. doi: 10.
   Connectivity. J. Neurosci. 24, 9228–9231. doi: 10.1523/jneurosci.3340-04.                       1089/brain.2015.0389
   2004                                                                                         Gu, S., Betzel, R. F., Mattar, M. G., Cieslak, M., Delio, P. R., Grafton, S. T.,
Cerliani, L., Mennes, M., Thomas, R. M., Di Martino, A., Thioux, M., and Keysers,                  et al. (2017). Optimal trajectories of brain state transitions. Neuroimage 148,
   C. (2015). Increased Functional Connectivity Between Subcortical and Cortical                   305–317. doi: 10.1016/j.neuroimage.2017.01.003
   Resting-State Networks in Autism Spectrum Disorder. JAMA Psychiatry 72:767.                  Guo, X., Chen, H., Long, Z., Duan, X., Zhang, Y., and Chen, H. (2017). Atypical
   doi: 10.1001/jamapsychiatry.2015.0101                                                           developmental trajectory of local spontaneous brain activity in autism spectrum
Chen, H., Nomi, J. S., Uddin, L. Q., Duan, X., and Chen, H. (2017). Intrinsic                      disorder. Sci. Rep. 7:39822. doi: 10.1038/srep39822
   functional connectivity variance and state-specific under-connectivity in                    Guo, X., Duan, X., Chen, H., He, C., Xiao, J., Han, S., et al. (2020). Altered inter- and
   autism. Hum. Brain Mapp. 38, 5740–5755. doi: 10.1002/hbm.23764                                  intrahemispheric functional connectivity dynamics in autistic children. Hum.
Damaraju, E., Allen, E. A., Belger, A., Ford, J. M., McEwen, S., Mathalon, D. H.,                  Brain Mapp. 41, 419–428. doi: 10.1002/hbm.24812
   et al. (2014). Dynamic functional connectivity analysis reveals transient states of          Guo, X., Duan, X., Suckling, J., Chen, H., Liao, W., Cui, Q., et al. (2018).
   dysconnectivity in schizophrenia. NeuroImage Clin. 5, 298–308. doi: 10.1016/j.                  Partially impaired functional connectivity states between right anterior insula
   nicl.2014.07.003                                                                                and default mode network in autism spectrum disorder. Hum. Brain Mapp. 40,
Deco, G., Jirsa, V. K., and McIntosh, A. R. (2011). Emerging concepts for the                      1264–1275. doi: 10.1002/hbm.24447
   dynamical organization of resting-state activity in the brain. Nat. Rev. Neurosci.           He, C., Chen, Y., Jian, T., Chen, H., Guo, X., Wang, J., et al. (2018).
   12, 43–56. doi: 10.1038/nrn2961                                                                 Dynamic functional connectivity analysis reveals decreased variability of the

Frontiers in Human Neuroscience | www.frontiersin.org                                      10                                            February 2022 | Volume 16 | Article 774921
Lin et al. Brain Dynamic Reconfiguration in ASD default-mode network in developing autistic brain. Autism Res. 11, 1479–1493. Preti, M. G., Bolton, T. A. W., and van de Ville, D. (2017). The dynamic functional doi: 10.1002/aur.2020 connectome: state-of-the-art and perspectives. Neuroimage 160, 41–54. doi: Hindriks, R., Adhikari, M. H., Murayama, Y., Ganzetti, M., Mantini, D., Logothetis, 10.1016/j.neuroimage.2016.12.061 N. K., et al. (2016). Can sliding-window correlations reveal dynamic functional Quinn, A. J., Vidaurre, D., Abeysuriya, R., Becker, R., Nobre, A. C., and Woolrich, connectivity in resting-state fMRI? Neuroimage 127, 242–256. doi: 10.1016/j. M. W. (2018). Task-Evoked Dynamic Network Analysis Through Hidden neuroimage.2015.11.055 Markov Modeling. Front Neurosci. 12:603. doi: 10.3389/fnins.2018.00603 Hutchison, R. M., Womelsdorf, T., Allen, E. A., Bandettini, P. A., Calhoun, V. D., Rabany, L., Brocke, S., Calhoun, V. D., Pittman, B., Corbera, S., Wexler, B. E., Corbetta, M., et al. (2013b). Dynamic functional connectivity: promise, issues, et al. (2019). Dynamic functional connectivity in schizophrenia and autism and interpretations. Neuroimage 80, 360–378. doi: 10.1016/j.neuroimage.2013. spectrum disorder: convergence, divergence and classification. Neuroimage 05.079 Clin. 24:101966. doi: 10.1016/j.nicl.2019.101966 Hutchison, R. M., Womelsdorf, T., Allen, E. A., Bandettini, P. A., Calhoun, V. D., Rashid, B., Damaraju, E., Pearlson, G. D., and Calhoun, V. D. (2014). Dynamic Corbetta, M., et al. (2013a). Dynamic functional connectivity: promise, issues, connectivity states estimated from resting fMRI Identify differences among and interpretations. Neuroimage 80, 360–378. Schizophrenia, bipolar disorder, and healthy control subjects. Front. Hum. Jung, M., Kosaka, H., Saito, D. N., Ishitobi, M., Morita, T., Inohara, K., et al. (2014). Neurosci. 8:897. doi: 10.3389/fnhum.2014.00897 Default mode network in young male adults with autism spectrum disorder: Rubinov, M., and Sporns, O. (2010). Complex network measures of brain relationship with autism spectrum traits. Mol. Autism 5:35. doi: 10.1186/2040- connectivity: uses and interpretations. Neuroimage 52, 1059–1069. doi: 10.1016/ 2392-5-35 j.neuroimage.2009.10.003 Just, M. A. (2004). Cortical activation and synchronization during sentence Sheline, Y. I., Price, J. L., Yan, Z., and Mintun, M. A. (2010). Resting-state functional comprehension in high-functioning autism: evidence of underconnectivity. MRI in depression unmasks increased connectivity between networks via the Brain 127, 1811–1821. doi: 10.1093/brain/awh199 dorsal nexus. Proc. Natl. Acad. Sci. U.S.A. 107, 11020–11025. doi: 10.1073/pnas. Just, M. A., Cherkassky, V. L., Keller, T. A., Kana, R. K., and Minshew, N. J. 1000446107 (2006). Functional and Anatomical Cortical Underconnectivity in Autism: Stevner, A. B. A., Vidaurre, D., Cabral, J., Rapuano, K., Nielsen, S. F. V., evidence from an fMRI Study of an Executive Function Task and Corpus Tagliazucchi, E., et al. (2019). Discovery of key whole-brain transitions and Callosum Morphometry. Cereb. Cortex 17, 951–961. doi: 10.1093/cercor/bh dynamics during human wakefulness and non-REM sleep. Nat. Commun. l006 10:1035. doi: 10.1038/s41467-019-08934-3 Just, M. A., Keller, T. A., Malave, V. L., Kana, R. K., and Varma, S. (2012). Autism Supekar, K., Uddin, L. Q., Khouzam, A., Phillips, J., Gaillard, W. D., Kenworthy, as a neural systems disorder: a theory of frontal-posterior underconnectivity. L. E., et al. (2013). Brain Hyperconnectivity in Children with Autism and its Neurosci. Biobehav. Rev. 36, 1292–1313. doi: 10.1016/j.neubiorev.2012. Links to Social Deficits. Cell Rep. 5, 738–747. doi: 10.1016/j.celrep.2013.10.001 02.007 Tang, G., Gudsnuk, K., Kuo, S.-H., Cotrina, M. L., Rosoklija, G., Sosunov, A., Kana, R. K., Libero, L. E., and Moore, M. S. (2011). Disrupted cortical connectivity et al. (2014). Loss of mTOR-Dependent Macroautophagy Causes Autistic-like theory as an explanatory model for autism spectrum disorders. Phys. Life Rev. Synaptic Pruning Deficits. Neuron 83, 1131–1143. doi: 10.1016/j.neuron.2014. 8, 410–437. doi: 10.1016/j.plrev.2011.10.001 07.040 Keown, C. L., Shih, P., Nair, A., Peterson, N., Mulvey, M. E., and Müller, R.- Vidaurre, D., Abeysuriya, R., Becker, R., Quinn, A. J., Alfaro-Almagro, F., Smith, A. (2013). Local Functional Overconnectivity in Posterior Brain Regions Is S. M., et al. (2018a). Discovering dynamic brain networks from big data Associated with Symptom Severity in Autism Spectrum Disorders. Cell Rep. 5, in rest and task. Neuroimage 180, 646–656. doi: 10.1016/j.neuroimage.2017. 567–572. doi: 10.1016/j.celrep.2013.10.003 06.077 King, J. B., and Anderson, J. S. (2018). Sustained versus instantaneous Vidaurre, D., Hunt, L. T., Quinn, A. J., Hunt, B. A. E., Brookes, M. J., Nobre, A. C., connectivity differentiates cognitive functions of processing speed and et al. (2018b). Spontaneous cortical activity transiently organises into frequency episodic memory. Hum. Brain Mapp. 39, 4949–4961. doi: 10.1002/hbm. specific phase-coupling networks. Nat. Commun. 9:2987. doi: 10.1038/s41467- 24336 018-05316-z King, J. B., Prigge, M. B. D., King, C. K., Morgan, J., Dean, D. C. III, Vidaurre, D., Myers, N. E., Stokes, M., Nobre, A. C., and Woolrich, M. W. (2019). Freeman, A., et al. (2018). Evaluation of Differences in Temporal Synchrony Temporally Unconstrained Decoding Reveals Consistent but Time-Varying Between Brain Regions in Individuals With Autism and Typical Development. Stages of Stimulus Processing. Cereb. Cortex 29, 863–874. doi: 10.1093/cercor/ JAMA Netw. Open 1, e184777–e184777. doi: 10.1001/jamanetworkopen.2018. bhy290 4777 Vidaurre, D., Quinn, A. J., Baker, A. P., Dupret, D., Tejero-Cantero, A., and Lee, J. M., Kyeong, S., Kim, E., and Cheon, K. A. (2016). Abnormalities of Inter- and Woolrich, M. W. (2016). Spectrally resolved fast transient brain states in Intra-Hemispheric Functional Connectivity in Autism Spectrum Disorders: electrophysiological data. Neuroimage 126, 81–95. doi: 10.1016/j.neuroimage. a Study Using the Autism Brain Imaging Data Exchange Database. Front 2015.11.047 Neurosci. 10:191. doi: 10.3389/fnins.2016.00191 Vidaurre, D., Smith, S. M., and Woolrich, M. W. (2017). Brain network dynamics Leonardi, N., and van de Ville, D. (2015). On spurious and real fluctuations of are hierarchically organized in time. Proc. Natl. Acad. Sci. U.S.A. 114, 12827– dynamic functional connectivity during rest. Neuroimage 104, 430–436. doi: 12832. doi: 10.1073/pnas.1705120114 10.1016/j.neuroimage.2014.09.007 Von dem Hagen, E. A., Stoyanova, R. S., Baron-Cohen, S., and Calder, A. J. Lin, P., Yang, Y., Gao, J., de Pisapia, N., Ge, S., Wang, X., et al. (2017). Dynamic (2012). Reduced functional connectivity within and between ‘social’ resting Default Mode Network across Different Brain States. Sci. Rep. 7, 46088. doi: state networks in autism spectrum conditions. Soc. Cogn. Affect. Neurosci. 8, 10.1038/srep46088 694–701. doi: 10.1093/scan/nss053 Liu, F. (2016). Dynamic functional network connectivity in idiopathic generalized Wang, S., Wen, H., Hu, X., Xie, P., Qiu, S., Qian, Y., et al. (2020). Transition epilepsy with generalized tonic-clonic seizure. Hum. Brain Mapp. 38, 957–973. and Dynamic Reconfiguration of Whole-Brain Network in Major Depressive doi: 10.1002/hbm.23430 Disorder. Mol. Neurobiol. 57, 4031–4044. doi: 10.1007/s12035-020-01995-2 Mokhtari, F., Akhlaghi, M. I., Simpson, S. L., Wu, G., and Laurienti, P. J. (2019). Watanabe, T., and Rees, G. (2017). Brain network dynamics in high-functioning Sliding window correlation analysis: modulating window shape for dynamic individuals with autism. Nat. Commun. 8:16048. doi: 10.1038/ncomms16048 brain connectivity in resting state. Neuroimage 189, 655–666. doi: 10.1016/j. Wee, C. Y., Yap, P. T., and Shen, D. (2016). Diagnosis of Autism Spectrum neuroimage.2019.02.001 Disorders Using Temporally Distinct Resting-State Functional Connectivity Newman, M. E. J. (2006). Modularity and community structure in networks. Networks. CNS Neurosci. Ther. 22, 212–219. doi: 10.1111/cns.12499 Proc. Natl. Acad. Sci. U.S.A. 103, 8577–8582. doi: 10.1073/pnas.060160 Wendling, F., Ansari-Asl, K., Bartolomei, F., and Senhadji, L. (2009). From EEG 2103 signals to brain connectivity: a model-based evaluation of interdependence Patriquin, M. A., DeRamus, T., Libero, L. E., Laird, A., and Kana, R. K. (2016). measures. J. Neurosci. Methods 183, 9–18. doi: 10.1016/j.jneumeth.2009.04.021 Neuroanatomical and neurofunctional markers of social cognition in autism Weng, S.-J., Wiggins, J. L., Peltier, S. J., Carrasco, M., Risi, S., Lord, C., et al. (2010). spectrum disorder. Hum. Brain Mapp. 37, 3957–3978. doi: 10.1002/hbm.23288 Alterations of resting state functional connectivity in the default network in Frontiers in Human Neuroscience | www.frontiersin.org 11 February 2022 | Volume 16 | Article 774921
Lin et al.                                                                                                                                     Brain Dynamic Reconfiguration in ASD

   adolescents with autism spectrum disorders. Brain Res. 1313, 202–214. doi:                     Conflict of Interest: The authors declare that the research was conducted in the
   10.1016/j.brainres.2009.11.057                                                                 absence of any commercial or financial relationships that could be construed as a
Yerys, B. E., Gordon, E. M., Abrams, D. N., Satterthwaite, T. D., Weinblatt, R.,                  potential conflict of interest.
   Jankowski, K. F., et al. (2015). Default mode network segregation and social
   deficits in autism spectrum disorder: evidence from non-medicated children.                    Publisher’s Note: All claims expressed in this article are solely those of the authors
   NeuroImage Clin. 9, 223–232. doi: 10.1016/j.nicl.2015.07.018                                   and do not necessarily represent those of their affiliated organizations, or those of
Zalesky, A., and Breakspear, M. (2015). Towards a statistical test for functional                 the publisher, the editors and the reviewers. Any product that may be evaluated in
   connectivity dynamics. Neuroimage 114, 466–470. doi: 10.1016/j.neuroimage.                     this article, or claim that may be made by its manufacturer, is not guaranteed or
   2015.03.047                                                                                    endorsed by the publisher.
Zalesky, A., Fornito, A., Cocchi, L., Gollo, L. L., and Breakspear, M. (2014). Time-
   resolved resting-state brain networks. Proc. Natl. Acad. Sci. 111, 10341–10346.                Copyright © 2022 Lin, Zang, Bai and Wang. This is an open-access article distributed
   doi: 10.1073/pnas.1400181111                                                                   under the terms of the Creative Commons Attribution License (CC BY). The use,
Zhan, Y., Paolicelli, R. C., Sforazzini, F., Weinhard, L., Bolasco, G., Pagani, F., et al.        distribution or reproduction in other forums is permitted, provided the original
   (2014). Deficient neuron-microglia signaling results in impaired functional                    author(s) and the copyright owner(s) are credited and that the original publication
   brain connectivity and social behavior. Nat. Neurosci. 17, 400–406. doi: 10.1038/              in this journal is cited, in accordance with accepted academic practice. No use,
   nn.3641                                                                                        distribution or reproduction is permitted which does not comply with these terms.

Frontiers in Human Neuroscience | www.frontiersin.org                                        12                                           February 2022 | Volume 16 | Article 774921
You can also read