Modeling Slab Temperature: A Reevaluation of the Thermal Parameter
←
→
Page content transcription
If your browser does not render page correctly, please read the page content below
Modeling Slab Temperature: A Reevaluation of the
                      Thermal Parameter
                       B. Maunder, J. Hunen, P. Bouilhol, V. Magni

     To cite this version:
    B. Maunder, J. Hunen, P. Bouilhol, V. Magni. Modeling Slab Temperature: A Reevaluation of the
    Thermal Parameter. Geochemistry, Geophysics, Geosystems, AGU and the Geochemical Society,
    2019, 20 (2), pp.673-687. �10.1029/2018GC007641�. �hal-02934713�

                                 HAL Id: hal-02934713
                https://hal.archives-ouvertes.fr/hal-02934713
                                     Submitted on 7 Jan 2022

    HAL is a multi-disciplinary open access            L’archive ouverte pluridisciplinaire HAL, est
archive for the deposit and dissemination of sci- destinée au dépôt et à la diffusion de documents
entific research documents, whether they are pub- scientifiques de niveau recherche, publiés ou non,
lished or not. The documents may come from émanant des établissements d’enseignement et de
teaching and research institutions in France or recherche français ou étrangers, des laboratoires
abroad, or from public or private research centers. publics ou privés.
                                              Copyright
RESEARCH ARTICLE                            Modeling Slab Temperature: A Reevaluation
10.1029/2018GC007641
                                            of the Thermal Parameter
Key Points:
• New slab temperature indicator is
                                            B. Maunder1,2       , J. van Hunen1      , P. Bouilhol3      , and V. Magni4
  more accurate/detailed than the           1
  thermal parameter for depths
                                             Department of Earth Sciences, Durham University, Durham, UK, 2Now at Department of Earth Science and Engineering,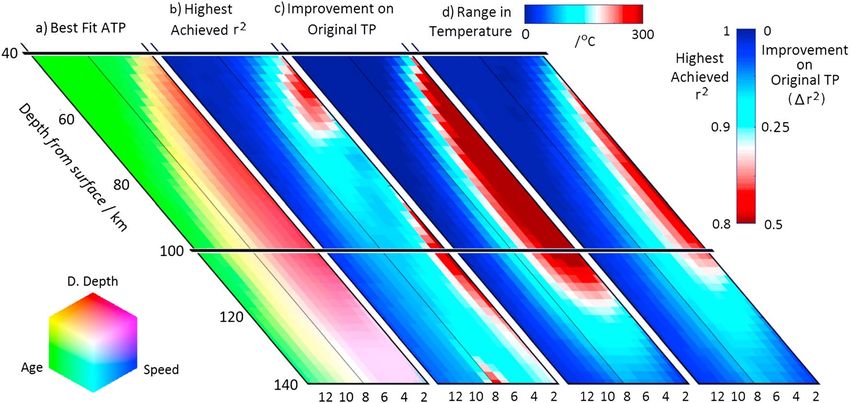
Geochemistry, Geophysics, Geosystems                                                 10.1029/2018GC007641

                     temperature has been predicted to be related to this thermal parameter and depth z when shallower than the
                                                                 pffiffiffiffiffiffiffiffiffiffiffiffiffiffiffiffiffi
                     base of the overriding lithosphere: T ¼ 1= 1 þ Φ=z (Molnar & England, 1995; Syracuse et al., 2010). At
                     greater depths, McKenzie (1969) theorized that, due to the heating effect of the overlying mantle wedge, a
                     more accurate expression for internal slab temperature at these depths is given by T = 1 − (2/π)
                     exp (−(π2/5.38)z/Φ). Both these expressions use the thermal parameter and therefore equally weight the
                     effect of age, speed, and angle on the thermal profile.
                     However, since then, more detailed studies have been undertaken, including the use of numerical simula-
                     tions. Van Keken et al. (2011) use numerical models to demonstrate that there is an existing but fairly weak
                     correlation between slab temperatures at subarc depths and ln(ϕ). Syracuse et al. (2010) produce numerical
                     subduction models for 52 modern arc segments to determine their thermal profiles. They find that the pro-
                     posed relationships work reasonably well for slab temperatures at shallow depths and also at greater
                     depths but fail to give strong correlations in the crucial subarc region. Magni et al. (2014) show that slab
                     velocity has the strongest control on the thermal structure of slabs at subarc slab depths (60–170 km) and
                     that its effect is not straightforward: Faster slabs have colder interiors but hotter slab surfaces. Similar
                     numerical studies have also investigated the effect the thermal state of slabs has on the fate of subducted
                     volatiles (Peacock, 1990), and the feedback the behavior of volatiles has on the thermal state of slabs
                     (Arcay et al., 2007). Another factor that is likely to play a crucial role is the thickness of the overriding
                     plate (or decoupling depth; Currie et al., 2004), which is not encompassed in the current definition of
                     the thermal parameter.
                     It has been suggested that certain geochemical signatures do show some correlation with the thermal para-
                     meter (Cooper et al., 2012; Ruscitto et al., 2012). However, the correlation is not strong and in fact weaker
                     than correlation with other parameters, such as the overriding Moho depth (Turner & Langmuir, 2015).
                     This could mean that the thermal state of the slab plays a smaller role in determining the geochemical char-
                     acteristics of arc magmas or that, for this purpose, the thermal parameter is not performing sufficiently well
                     as an indicator for temperature. In this study, we readdress the use of the thermal parameter as an indicator
                     of slab temperature at different points within the interior of subducting slabs at subarc depths. In accordance
                     with the previously mentioned studies, we find that the original definition of the thermal parameter per-
                     forms well for internal slab temperatures deeper in the mantle (approximately more than 150 km).
                     However, we find that age has a dominant control on internal slab temperatures shallower than this depth
                     and slab top temperatures shallower than the decoupling depth (at 70 km) and that speed dominates for slab
                     top temperatures deeper than the decoupling depth (arguably the most important region when considering
                     fluid release and arc magma genesis). We also investigate the effect of a change in the decoupling depth. We
                     find that, when varied, it has a stronger effect on slab temperature than any of the slab parameters, in a
                     region that extends from the shallowest decoupling depth (40 km) to 40 km deeper than the deepest decou-
                     pling depth (140 km). However, this is only within the slab crust: In the slab mantle, slab temperature is still
                     primarily age controlled.

                     2. Methods
                     2.1. Model Setup
                     For this study, we adapted a model we developed for a previous study of subduction, and the reader is
                     referred to Maunder et al. (2016) for further details of the model setup. This is a 2‐D model, developed using
                     a Cartesian version of the finite element code Citcom (Moresi & Gurnis, 1996; Zhong et al., 2000), which
                     solves the coupled equations for the conservation of mass, momentum, and temperature while assuming
                     incompressibility and using the Boussinesq approximation. Shear heating is not included (see section 4.2).
                     Composition is tracked by tracers that are conservatively advected (i.e., such that the divergence of the velo-
                     city field, interpolated from the element nodes, is always 0) with the flow field (Wang et al., 2015).
                     The model is 700 km wide and 200 km deep and consists of 512 × 256 finite elements with horizontal mesh
                     refinement such that an element in the region of interest is 800 × 800 m. As subduction is driven by a nega-
                     tively buoyant slab, which extends to beyond 200‐km depth in reality (Forsyth & Uyeda, 1975), we add an
                     additional slab pull force to the downgoing slab at the bottom boundary (Maunder et al., 2016). This allows
                     for subduction speed to be set by us and maintained throughout the model run. Slab dip is set by applying a
                     variable shear between the top and bottom boundaries (achieved via a fixed velocity bottom boundary

MAUNDER ET AL.                                                                                                                   674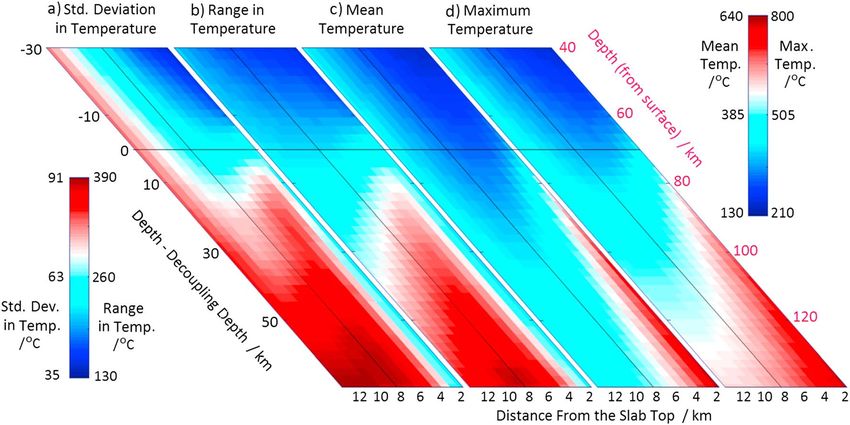
Geochemistry, Geophysics, Geosystems                                                           10.1029/2018GC007641

                     Figure 1. Initial positioning of all materials. The left‐hand side (LHS) boundary is open and allows for horizontal inflow of
                     material with a half‐space cooling temperature profile characterized by the slab age, t. The right‐hand side (RHS)
                     boundary has a fixed, horizontal outflow profile* with a thermal profile of an older plate, with 0 °C surface temperature,
                     1350 °C mantle temperature when deeper than the decoupling depth, and linearly interpolated in between. A vertical body
                     force is applied to an area within the subducting lithosphere at the base of the model. The magnitude of this force is
                     continually adjusted to maintain a constant slab velocity and the area moved to remain a fixed distance from the slab to
                     the Moho. The top boundary is closed and no slip with a fixed surface temperature. The bottom boundary is open
                     (stress‐free vertically) but with the horizontal component of the velocity set to vtrench = v cos (θ) to ensure that the plate
                     subducts at a certain angle, θ. The black stars indicate the points within the slab where the temperature is measured.
                     For clarity, only every other sample point has been marked. The horizontal axis has been compressed where the boundary
                     is dashed. The right‐hand side boundary is significantly further from the slab, such that this boundary does not affect
                     mantle flow in the vicinity of the slab. Asterisk (*) indicates that outflow profile is zero flux at points shallower than the
                     decoupling depth and linearly increases with depth to vtrench by the base of the model.

                     condition, or vtrench, which represents relative motion with respect the mantle below the model domain). It
                     has been suggested that, in order to achieve low‐angle subduction, such a shear does need to exist (van
                     Hunen et al., 2004), although we recognize that there are other factors that may also play a role and this
                     is a simplification. The left‐hand side thermal boundary condition is that of a half space that has been
                     cooled over a certain time: the slab age. We run the model through an initialization stage to ensure that
                     the slab is in approximate thermal and mechanical equilibrium. Boundary and initial conditions are
                     summarized in Figure 1. In this study, we refer to the slab dip as the angle at which the slab leaves the
                     model through the bottom boundary, which directly controls the stable geometry of the entire slab (see
                     supporting information).

                     2.2. Rheology
                     Material deforms viscously by diffusion and dislocation creep mechanisms (with no pressure dependence),
                     operating in parallel:

                                                                                             1
                                                                            η¼                    ;                                            (1)
                                                                                       1
                                                                                     ηdisl   þ η1
                                                                                                diff


                                                                               1     1−ni          Ei
                                                                     ηi ¼ Ai ni ε_    ni
                                                                                             exp                                               (2)
                                                                                                  ni RT

                     The definitions of the symbols used are given in Table 1, and the subscript, i, either refers to diffusion creep
                     (“diff”) or dislocation creep (“disl”). Two different compositions are included in this model: (dry) mantle
                     peridotite, and (partially hydrated) mafic oceanic crust (gabbro). The different compositions have different
                     values of A, E, and n, which are informed by a detailed literature study (see the supporting information of
                     Maunder et al., 2016).
                     A weak zone, which terminates at a fixed decoupling depth (70 km unless stated otherwise), decouples the
                     two plates (Figure 1). Its geometry is not fixed and is allowed to move with the top of the slab until the slab

MAUNDER ET AL.                                                                                                                                675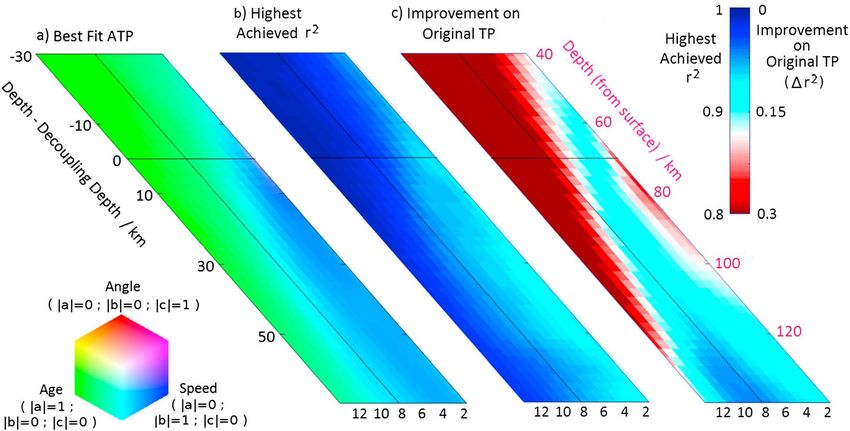
Geochemistry, Geophysics, Geosystems                                                10.1029/2018GC007641

                      Table 1
                      Symbols, Units, and Values of Properties and Model‐Defining Constants
                      Symbol                                  Description                             Units        (Default) value

                      t                 Age (slab age)                                                 Myr                —
                      v                 Speed (trench normal convergence rate)                         m/s                —
                      θ                 Angle (slab dip angle)                                           °                —
                      T                 Temperature                                                     °C                —
                      z                 Depth                                                           m                 —
                                                                                                        −1
                      ε_                Strain rate                                                    s                  —
                                                                                                       −n −1                    9
                      Adiff mantle      Rheological prefactor for mantle diffusion creep            Pa ·s            4.61 × 10
                                                                                                       −n −1                    9
                      Adiff crust       Rheological prefactor for crustal diffusion creep           Pa ·s            4.61 × 10
                                                                                                                                5
                      Ediff mantle      Activation energy for mantle diffusion creep                  J/mol          3.79 × 10
                                                                                                                                5
                      Ediff crust       Activation energy for crustal diffusion creep                 J/mol          3.79 × 10
                      ndiff mantle      Stress exponent for mantle diffusion creep                      —                  1
                      ndiff crust       Stress exponent for crustal diffusion creep                     —                  1
                                                                                                       −n −1                    15
                      Adisl mantle      Rheological prefactor for mantle dislocation creep          Pa ·s            5.92 × 10
                                                                                                       −n −1                    19
                      Adisl crust       Rheological prefactor for crustal dislocation creep         Pa ·s            7.49 × 10
                                                                                                           ‐1                   5
                      Edisl mantle      Activation energy for mantle dislocation creep               J mol           5.42 × 10
                                                                                                                                5
                      Edisl crust       Activation energy for crustal dislocation creep               J/mol          2.83 × 10
                      ndisl mantle      Stress exponent for mantle dislocation creep                    —                3.48
                      ndisl crust       Stress exponent for crustal dislocation creep                   —                3.08
                                                                                                     −1       −1
                      R                 Gas constant                                              J·K ·mol               8.31
                      T0                Surface temperature                                             °C                 0
                      ΔT                Temperature of the mantle relative to T0                        °C              1350
                                                                                                            3
                      ρ                 Density of the mantle                                        kg/m               3300
                                                                                                            3
                      ρcrust            Density of oceanic crust above declogite                     kg/m               3100
                                                                                                            3
                      ρeclogite         Density of oceanic crust below declogite                     kg/m               3400
                      dcrust            Incoming crustal thickness                                     km                7.5
                      declogite         Depth of the crustal transition from basalt to eclogite        km                100
                      ddecoupling       Decoupling depth: the maximum depth of the weak zone           km                 70
                                                                                                                            20
                      ηweak zone        Viscosity of weak zone                                         Pa·s             10
                                                                                                                            24
                      ηmax              Maximum viscosity                                              Pa·s             10
                      h                 Model depth                                                    km                200
                                                                                                         2                   –7
                      κ                 Thermal diffusivity                                           m /s             8x10
                                                                                                           2
                      g                 Acceleration due to gravity                                   m/s                9.8
                                                                                                         −1                   –5
                      α                 Thermal expansivity                                            K              3.5x10

                     finds its steady state geometry, during the initialization stage (see supporting information). Its viscosity is
                     fixed at 1020 Pa·s in the center, defined by a thin layer of tracers (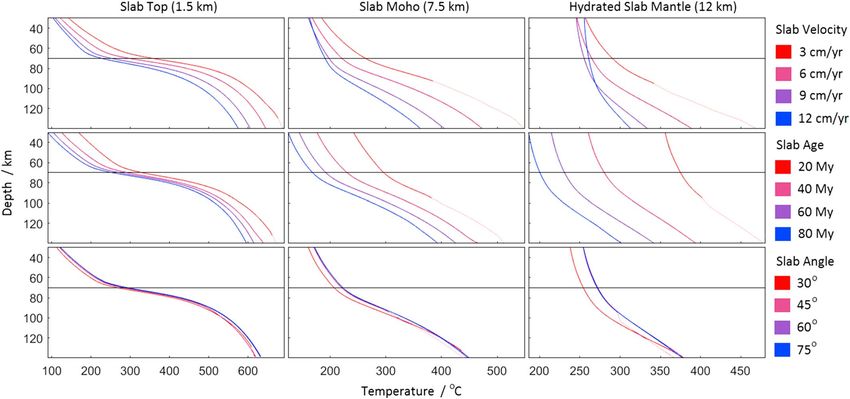
Geochemistry, Geophysics, Geosystems                                                10.1029/2018GC007641

                     12 cm/year; 20, 40, 60, and 80 Myr; and 30°, 45°, 60°, and 75° for speed, age, and angle, respectively (so that
                     a total of 64 models were run). This is informed by the global subduction database “SubMap” (Heuret &
                     Lallemand, 2005), which includes physical data for all unperturbed (i.e., far from abnormal subducting
                     plates; see Heuret & Lallemand, 2005, for the full definition) subduction zone segments (~200 km wide)
                     worldwide.
                     During each model calculation, we track the pressure‐temperature (PT) paths through a cross section from
                     the 1.5 km perpendicular from the slab top through the oceanic crust and slab mantle down to 15 km from
                     the slab top. We do this by recording the PT conditions experienced by tracers at these locations within the
                     slab. This method prevents us from tracking the PT conditions of the top kilometer of the slab reliably due to
                     tracers interacting with the weak zone. The locations within the slab that are ultimately sampled are indi-
                     cated by black stars in Figure 1. Each model calculation has a definite fixed age, speed, and angle, and using
                     these, we then calculate a range of ATPs for each model, varying a, b, and c (see equation (3)) with a resolu-
                     tion of 0.1. A plot is then made of temperature (at the same particular point in the slab for the 64 models)
                     versus log10(ATP), for each combination of a, b, and c, and an r2 value calculated for the strength of correla-
                     tion (see Figure 6). The values of a, b, and c that maximize r2 define the “optimal” ATP. The reason the loga-
                     rithm of the ATP is used is because it has already been shown by van Keken et al. (2011) that an, albeit noisy,
                     linear correlation exists between slab temperature at different points in the slab and log10(Φ). As we take the
                     logarithm of the ATP, only the relative values of a, b, and c are of importance as multiplying all three by the
                     same constant serves only to dilate the plot of temperature versus ATP, leaving r2 unaffected. This reduces
                     the three‐dimensional search space to three surfaces within this space, which we choose to be

                                                            a ¼ 1; −1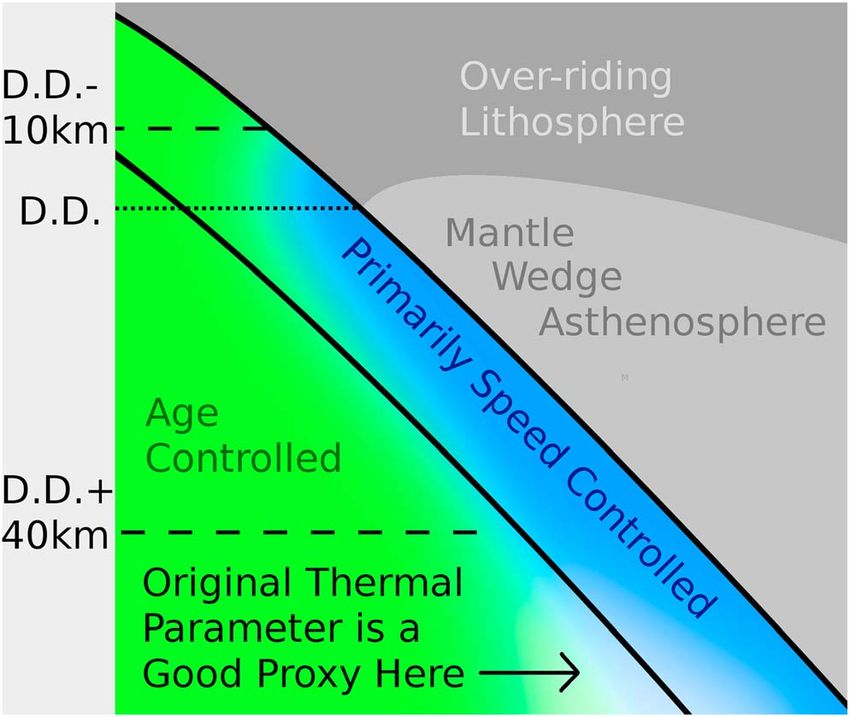
Geochemistry, Geophysics, Geosystems                                                               10.1029/2018GC007641

Figure 2. Model snapshots of four different model runs taken at the stage during which the PT paths of the slab are being measured; 200 °C isotherms are plotted
with thin black lines, and the oceanic crust, which has a different density and rheology to the rest of the model, is outlined with a thicker black and white line.
Arrows indicate relative velocity within each model. The decoupling point (at 70 km) can be seen at the terminus of the weak, low viscosity zone along the top of the
slab. Note that these snapshots have been cropped, and the right‐hand side boundary in particular is at x = 700 km, considerably further to the right than depicted
here.

                                         3.2. Finding the Optimal ATPs at each Point in the Slab
                                         The temperature of the slab at 10‐km intervals between 30‐ and 150‐km depths and at 1.5‐km intervals from
                                         1.5 to 15 km into the slab is extracted from the models and used to calculate the optimal values of a, b, and c,
                                         for these points in the slab. A subset of these optimal values is given in Table 2 along with how well the opti-
                                         mal ATP and original thermal parameter (Φ) perform.
                                         For all points tested in the model, we are able to find a best fit thermal parameter with r2 > 0.9 (Figure 5b)
                                         indicating that our ATPs are indeed good proxies for temperature in these models. Speed and age have a
                                         stronger control on slab temperature than angle at all points in the slab (Figure 5a). The slab seems to consist
                                         of two regions: primarily speed controlled (b > a > c) closer to the slab top and deeper in the model and age
                                         controlled (a> > b and c) elsewhere. The boundary between them starts at the slab top at 5–10 km above the
                                         decoupling point and runs approximately diagonally down to the Moho at 30–40 km deeper than the decou-
                                         pling depth. The original thermal parameter, Φ, is observed to perform particularly poorly, relative to the
                                         adjusted definition, in this region close to the slab surface and decoupling depth, and also at the slab

MAUNDER ET AL.                                                                                                                                                  678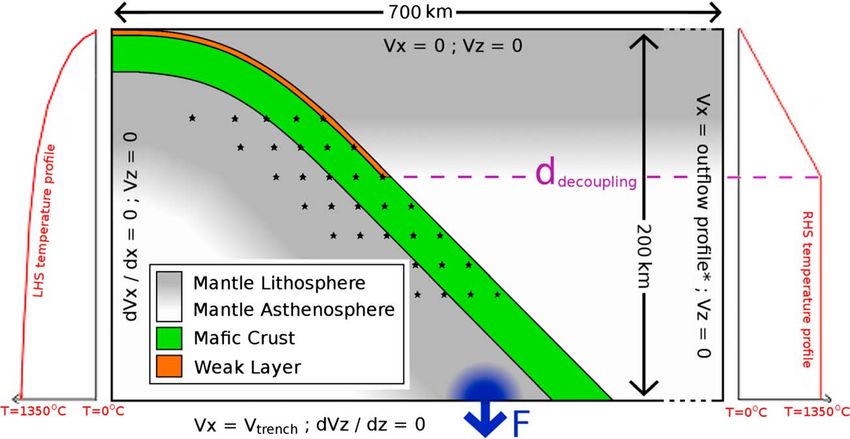
Geochemistry, Geophysics, Geosystems 10.1029/2018GC007641
Figure 3. Averaged PT paths of models, which share a property (i.e., have the same speed, age, or angle). PT paths for models with like speeds are averaged and
plotted as average curves in the plots on the top row. Similarly, like ages are shown on plots on the middle row and like angles on the bottom row. PT paths are
given near the slab top (1.5 km from the top), the slab Moho (at 7.5 km), and inside the slab mantle (at 12 km). Faded parts of the curve indicate that one of the
models used to calculate the curve did not run to this point due to solver convergence issues. As such, these faded sections should be treated as approximate but still
give a good indication of how each property affects slab temperature. Exclusion of this data does not affect further analysis significantly.
surface deeper than the decoupling depth for ~40 km (Figure 5c). It performs nearly as well as the adjusted
definition, beneath the Moho, when more than 50 km deeper than the decoupling depth.
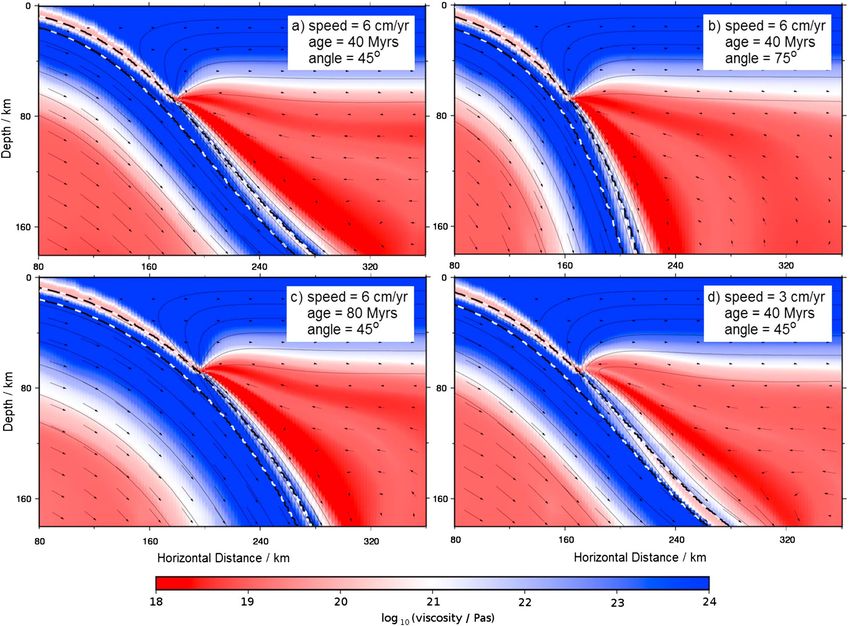
Figure 6 is a fuller, graphical representation of the results. The three faces of the cube represent the para-
meter space explored and, as explained in section 2.3, the optimal r2 value should lie on one of these faces.
The width of the bullseye pattern on the cube gives an indication of how well constrained the optimal values
Figure 4. Slab cross sections displaying different information extracted from the models (black lines mark the decoupling depth and the Moho). (a) The standard
deviation of the temperature between all the models ran. (b) The difference between the temperatures of the hottest and coldest models at that point. (c) The mean
temperature of all the models. (d) The highest temperature found within all the models at each point.
MAUNDER ET AL. 679
Geochemistry, Geophysics, Geosystems                                                                 10.1029/2018GC007641

 Table 2
                                                         a b     c                      2
 The Set of Values of a, b, and c (that define the ATP = t v sin θ ) that Maximizes the r Fit of log(ATP) for the Slab Temperature at Given Depth and Distance to the
 Slab Surface
                                                                                                           2                 2              2               2
 Depth (km;        Distance from                                                       Highest            r using            r with         r with         r with
                                                                                                2
 from surface)     slab top (km)       Optimal a       Optimal b      Optimal c      achieved r       original T.P. (Φ)     age only      speed only      angle only

 50                       1.5              1              0.8             0.3            0.95                  0.78           0.55           0.38            0.02
 50                       7.5              1              0.2             0.1            0.98                  0.61           0.93           0.06            0.01
 50                      12                1              0.1             0              0.99                  0.45           0.99           0               0.01
   a
 70                       1.5              0.6            1               0.5            0.94                  0.70           0.24           0.67            0.03
   a
 70                       7.5              1              0.4             0.1            0.98                  0.71           0.83           0.15            0.01
   a
 70                      12                1              0.1             0              0.99                  0.51           0.98           0.01            0.01
 90                       1.5              0.5            1               0.3            0.93                  0.71           0.18           0.73            0.01
 90                       7.5              1              0.8             0.2            0.95                  0.81           0.56           0.39            0.01
 90                      12                1              0.2             0              0.99                  0.61           0.93           0.05            0.01
 110                      1.5              0.6            1               0.2            0.92                  0.76           0.22           0.67            0.01
 110                      7.5              0.9            1               0.1            0.95                  0.84           0.38           0.53            0
 110                     12                1              0.4             0.1            0.97                  0.71           0.81           0.14            0.01
 130                      1.5              0.7            1               0.1            0.93                  0.79           0.27           0.65            0
 130                      7.5              0.8            1               0.1            0.95                  0.87           0.33           0.61            0
 130                     12                1              0.6             0.1            0.97                  0.84           0.68           0.28            0
       2
 Note. r values are reported for this best fit for this ATP, the fit for the original thermal parameter, and the fit for plots of slab temperature versus each parameter
 individually. ATP = adjusted thermal parameter.
 a
   70 km is the decoupling depth.

                                         for the exponents are. If the point with the highest r2 lies on the top face, then angle is the most important
                                         parameter—age on the left face and speed on the right face. The actual plots of T versus optimal log10(ATP),
                                         with best fit linear regression lines overlain, are also presented in Figure 6. These demonstrate that a linear
                                         relationship between T and log10(optimal ATP) is a good first‐order fit.

                                         3.3. Decoupling Depth Study
                                         In order to investigate the effect of decoupling depth, we ran the same study but with a fixed subduction
                                         angle of 45° and a variable decoupling depth (ddecoupling = 40, 60, 80, and 100 km). Angle was, in this case,

Figure 5. Slab cross sections displaying different information extracted from the models (black lines mark the decoupling depth and the Moho). (a) The optimal
                                                                                                               2
values of a (age), b (speed), and c (angle) plotted using RGB color (see the key in the bottom left). (b) The r value of a plot of slab temperature and the loga-
                                                                                                       2               2
rithm of the optimal adjusted thermal parameter. (c) The difference between the highest achieved r value and the r value resulting from the use of the original
thermal parameter, ϕ. ATP = adjusted thermal parameter.

MAUNDER ET AL.                                                                                                                                                      680
Geochemistry, Geophysics, Geosystems 10.1029/2018GC007641
Figure 6. The colored cubes are a graphical representation of the full explored parameter space. The left face is a = 1, − 1 < b < 1, − 1 < c < 1, right face is b = 1,
− 1 < c < 1, − 1 < a < 1, and top face is c = 1, − 1 < a < 1, − 1 < b < 1; see the key to the top right of these plots to see this pictorially. Red colors represent
2
values of a, b, and c, which yield high r values in plots of the logarithm of the resultant ATP and temperature for certain points in the model (50‐, 70‐, 90‐, and
2
140‐km depths and 1.5, 7.5, and 15 km from the slab surface). The “optimal” plots, which yield the highest r , are given for each cube to their bottom left with
2
the lines of best fit plotted and the resultant r given. An intuitive way to interpret the cube plots is as follows: If the center of the red “bullseye” falls on the
left face of the cube, then age has the strongest control on temperature, speed on the right face and angle on the top face. The width of the bullseye gives an
2
indication of how quickly r deteriorates with distance from the optimal values of a, b, and c.
chosen to be fixed as it was observed to have the weakest effect on slab temperature throughout the slab. The
ATP in this study is now therefore defined as follows:
ATP ¼ t a vb ddecoupling c : (4)
The a, b, c parameter space is explored for the best fit ATP just as before. Figure 7 presents the results from
this study in a similar form to Figure 5. Depth is measured from the surface. The decoupling depth has a
dominant effect within the depth range over which the decoupling depth is varied (40–100 km), inside the
slab crust (Figure 7a). In this region, the decoupling depth is almost entirely responsible for a variation in
temperature of up to 300 °C (Figure 7d). As a result, the best fit ATP using just age and speed performs very
poorly in this region (Figure 7c). Once deeper than 100 km, this dependence diminishes with depth, with
MAUNDER ET AL. 681Geochemistry, Geophysics, Geosystems 10.1029/2018GC007641
Figure 7. As in Figure 5 but representing the results for the decoupling depth study, in which decoupling depth was varied instead of subduction angle. Depth is
only given relative to the surface. The range over which decoupling depth is varied is 40 to 100 km. This is highlighted by the thick black horizontal lines. ATP now
refers to an adjusted thermal parameter formulated with decoupling depth instead of angle (see main text). ATP = adjusted thermal parameter.
speed and decoupling depth having roughly equal effect in the slab crust at ~140‐km depth. Behavior in the
previously “age‐controlled” region (in the slab mantle) remains roughly the same, indicating that
decoupling depth has a relatively minor effect on the temperatures in this part of the slab.
4. Discussion
4.1. Improving on the Thermal Parameter ϕ
The original definition of the thermal parameter has previously been
found to perform well for slab temperatures at 240‐km depth (Syracuse
et al., 2010). Our results confirm this: For the slab Moho, at depths
>140 km, the ATP improves very little on the original thermal parameter,
with an increase in r2 of onlyGeochemistry, Geophysics, Geosystems 10.1029/2018GC007641
slab from this point, temperature of the deeper parts of the slab will begin to develop a stronger
speed dependence.
Of the slab parameters, angle has the weakest effect on slab temperatures throughout the slab. The lack of
angle dependence at depths less than the decoupling depth may be due, in part, to the fact that slabs with
different dips have similar steady state geometries in this region. Despite this, below the decoupling point,
one would still expect angle to have a similar effect to slab speed. However, what we find is that the small
effect angle does have (and only near the decoupling point) is opposite in sense: Shallow slabs have colder
slab tops. This appears to be because, in the shallower cases, the mantle wedge flow which brings heat to
the top of the slab is restricted, particularly in the (narrower) mantle wedge corner.
A property not included in the original definition of the thermal parameter is decoupling depth, and we have
shown that the effect of decoupling depth is potentially strong. When considering temperature with depth
from the surface, decoupling depth dominates within the depth range over which it is varied, down to
40 km deeper than this range and all within the previously primarily speed‐controlled region.
Temperatures in the previously age‐controlled region remain primarily age controlled.
However, it has been suggested that decoupling depths around the world do not vary significantly from 70–
80 km (Furukawa, 1993; Wada & Wang, 2009). If the decoupling depth is indeed nearly constant, its effect is
likely negligible and one would expect the slab parameters age and speed to have the dominant effect on slab
temperatures (Figure 8). Turner and Langmuir (2015) indicate that the nature of the overriding plate may
play a more significant role in determining the geochemistry of arc lavas, though whether this is due to vari-
able decoupling depth is uncertain and perhaps an avenue for further study.
4.2. Comparison With Previous Work
Using the slab top geotherms, presented in Figure 3, allows us to cross check with two important numerical
modeling studies: Gerya et al. (2002) and van Keken et al., 2002. These two studies use different modeling
approaches. Our method of plate decoupling is closest to van Keken et al., 2002, the same model setup sub-
sequently used by Syracuse et al. (2010), and as a result our calculated slab top geotherms follow a similar PT
path, but on the cooler end (our mean lies 100 °C below that of van Keken et al., 2002), in part due to our
exclusion of adiabatic heating and perhaps in part, due to the fact that our “slab top” is actually at 1.5 km
into the slab. It has been shown that these geotherms are already too cold to fit prograde PT paths of most
exhumed ultrahigh‐pressure‐metamorphic rock (Penniston‐Dorland et al., 2015), although this may be
due to the fact that the exhumation mechanisms necessary for their preservation require anomalous subduc-
tion, for example, slab breakoff during continental collision or that there is a preservation bias toward hot
subduction zones (Abers et al., 2017). Penniston‐Dorland et al. (2015) also analyze the effect of speed, age,
and angle within these modeling results and demonstrate that slab dip has by far the least important effect
on slab top temperature, a result we recreate. Age affects slab top temperatures by ~200 °C in both the Gerya
et al. (2002) and van Keken et al. (2002) studies, roughly consistently at all depths. We observe the same con-
sistency but overall less variation (~100 °C). Where our results differ mostly is in the effect of speed on slab
top temperatures, and this is also something that differs between Gerya et al. (2002) and van Keken et al.
(2002). Shallower than the decoupling depth, we agree with both studies that slower slabs have hotter tops.
We demonstrate that the effect of speed increases with depth and that deeper than the decoupling depth, it
has the dominant effect, with slower slabs being hotter. However, in this region (the slab top beneath the
decoupling point), the results from van Keken et al. (2002) show that speed has a negligible effect and the
results of Gerya et al. (2002) show a reversal in the effect of speed at ~50 km. Neither study includes shear
heating fully (van Keken et al. (2002) include shear heating along the decoupled interface only), and preli-
minary work during our investigation indicated that shear heating increases slab top temperatures byGeochemistry, Geophysics, Geosystems 10.1029/2018GC007641
4.3. Geochemical Implications
In a simplified view, a three‐layer slab (sediments, igneous crust, and hydrated slab lithospheric mantle) sup-
plies the overlying mantle wedge and the deep mantle with different geochemical components at different
depths within the subduction system. The depth of element distillation is primarily controlled by the shape
of the isotherms and the overall thermal structure of the slab (Bouilhol et al., 2015). If we consider that the
subducting slab lithologies are water saturated, the sediments will be the first to dehydrate, closely followed
by the igneous mafic crust, with the hydrated slab mantle being the last to dehydrate, possibly carrying water
to the deep mantle (Schmidt & Poli, 2014).
These overall aspects of slab devolatilization can be put into the perspective of our results, presented in
Figure 8, and, using them, we should be able to predict how dehydration depends on slab age, speed, and
angle (and decoupling depth). Mafic crust is predicted to fully dehydrate between 70 and >300 km, and this
depends primarily on temperature (Poli & Schmidt, 2002). We show that slab temperatures are predomi-
nantly controlled by age shallower than 70 km. One should therefore expect that the extreme case (where
the crust has fully dehydrated by 70 km and has lost its fluid content completely to the forearc) to occur only
during subduction of the youngest slabs and largely regardless of speed or angle. In the coldest slabs, where
significant amounts of hydrated phases would be expected to persist past the decoupling depth and fluids are
transported to the subarc region, one should expect the depth of crustal dehydration to be primarily speed
controlled. However, if decoupling depth is shown to vary significantly, then this should actually control
crustal dehydration more strongly than the slab parameters in these colder cases. If dehydration is early
enough, this can be too soon for the fluids to be transported to the melt generating region of the mantle
wedge and as such would be simply lost to the forearc (Abers et al., 2017; Hyndman & Peacock, 2003).
This is important as these first fluids would carry with them the most fluid mobile elements, depleting them
in the arc magma source (Savov et al., 2007).
The primary dehydration reaction in the slab mantle, and predicted to be the most significant flux of water
from the slab, is the breakdown of antigorite serpentine, a reaction that is highly temperature dependent
(Ulmer & Trommsdorff, 1995). At ~120 km (50 km below the decoupling point) this reaction occurs at
650 °C. This temperature is only achieved in the hottest models; on average, the slab is still too cool shal-
lower than 150 km. As such, antigorite breakdown will almost exclusively occur in a region of the slab,
which is well characterized by the original definition of the thermal parameter. As water transport to the
deep mantle is mainly controlled by this hydrated portion of the slab mantle (Magni et al., 2014; Rüpke
et al., 2004), it is likely that the original thermal parameter is a good indicator for the efficiency of deep water
transport. Previous studies have also found that both age and speed play an important role in deep water
recycling in the same sense (Magni et al., 2014; van Keken et al., 2011). If decoupling depth is shown to vary,
the dehydration of the slab mantle will only be slightly affected by decoupling depth and only in the hottest
(youngest) cases.
The fluid‐present solidus of a typical subducted metasediment lies at ~700 °C at the decoupling depth
(70–80 km) and increases to ~800 °C by 140 km (Poli & Schmidt, 2002). These temperatures are not
reached at the top of our average subduction zone (measuring at 1.5 km means that we may be
underestimating slightly although sediment layers on the top of subducted plates are typically
0.5–2 km thick [Clift & Vannucchi, 2004]). However, the hottest models do reach these temperatures
within the speed‐controlled region (no models reach this temperature range outside this region). The
fluid‐present solidus of mid‐ocean ridge basalt is similar but slightly higher than the fluid‐present soli-
dus of the metasediment (Nichols et al., 1994; Poli & Schmidt, 2002), and therefore, we would only
expect the very topmost mafic crust to melt and perhaps only in the slowest subduction settings and
where sediment cover is thin.
Fluid absent melting occurs via the breakdown of hydrous phases at temperatures higher than those
recorded in our models (Johnson & Plank, 2000; Skjerlie & Douce, 2002). Bouilhol et al. (2015) demonstrate
that the crust should be devoid of fluid by the time it reaches melting conditions and fluid‐present melting is
only achieved via fluxing by fluids derived from the slab mantle below. As discussed above, at what depth the
slab mantle dehydrates is dependent on the thermal parameter, and only shallow enough to be within our
model domain for the youngest slabs. This may imply that a slab needs to be young as well as subducting
slowly to enable mafic crust or sediment melting. However, melting of crustal material may be enhanced,
MAUNDER ET AL. 684Geochemistry, Geophysics, Geosystems 10.1029/2018GC007641
and fluid‐absent melting made possible, by the formation of crustal plumes or diapirs (Behn et al., 2011).
This is further discussed in section 4.4.
Perhaps sediment melting does occur on Earth today as indicated by the higher than expected concentra-
tions of the fluid incompatible elements thorium and beryllium in arc lavas (Behn et al., 2011; Johnson &
Plank, 2000). It has also been suggested that the mafic crust may also partially melt, giving rise to the rare
“adakitic” signature (Defant & Drummond, 1990). Our results indicate, following our previous reasoning,
that one should expect sediment and/or crustal melting to be more likely in the slowest subduction zones
today, although this is perhaps only for slabs that are also young, unless another mechanism facilitates
fluid‐absent melting. Importantly, the likelihood of sediment/crustal melting should not depend on slab dip.
4.4. Other Implications
The seismicity of slabs is known to depend heavily on their thermal structure (Ruff & Kanamori, 1980).
Strong correlations between features of deep (>300 km) earthquakes (specifically b values or number of
aftershocks) and the original definition of the thermal parameter have been demonstrated (Kirby et al.,
1996; Wiens & Gilbert, 1996) as well as the maximum depth of earthquakes (Gorbatov & Kostoglodov,
1997). We have shown here that the original thermal parameter should indeed correlate well with the
occurrence/intensity of any thermally controlled process at these depths. It has also been shown that the
seismic moment of the largest characteristic earthquakes within a particular subduction section correlates
primarily with just slab age (Peterson & Seno, 1984). We propose that this correlation could be due to differ-
ences in thermal structure above the decoupling point, which indeed should be slab age dependent accord-
ing to the results of this study.
England et al. (2004) demonstrate that the depth to the top of the zone of intermediate‐depth seismicity
(interpreted to be the slab top) directly below volcanic arcs inversely correlates with subduction speed and
Syracuse and Abers (2006) find that the depth to the slab top correlates with slab dip but nothing else. We
find that faster slabs have colder tops (so should actually dehydrate deeper) and that slab top temperature
is less dependent on slab dip than speed or age. Therefore, coupling either of these results with our findings
lends strength to the argument that arc position is controlled by factors other than slab thermal structure
(England & Katz, 2010; Perrin et al., 2016). Syracuse and Abers (2006) also find that the width of the seismo-
genic zone correlates with slab age alone. Given that slab seismicity is believed to be thermally controlled,
our results lead to the prediction that this should indeed be solely age dependent.
The formation of crustal plumes or diapirs has been suggested to occur in subduction zones today (Gerya &
Yuen, 2003) and subsequent relamination, or underplating, of the overriding plate with slab‐derived mate-
rial (Hacker et al., 2011). This dynamic process would have a profound effect on arc magmatism (Marschall
& Schumacher, 2012) and could explain a high temperature sediment melt signature, which is pervasive in
many subduction zones (Behn et al., 2011). Maunder et al. (2016) demonstrate that this process is enhanced
under hotter, Archean conditions and also under modern Earth conditions during slow subduction,
although age appears less important. In light of the results presented here, the dependence of this behavior
on subduction speed alone makes sense as these plumes form from the slab crust, below the decoupling
point, in the speed‐controlled region. We would therefore expect to see evidence of relamination occurring
predominantly in the Earth's slowest subduction zones.
5. Conclusions
We conducted a parametric study using a 2‐D, dynamic, thermomechanical model of subduction to investi-
gate the effects of varying slab age, trench normal convergence rate, and slab dip on the thermal structure of
the slab. In particular, we evaluate how well the thermal parameter, ϕ, performs as an indicator of slab tem-
perature at different points within the slab. We find that beyond 50 km deeper than the decoupling depth
(the point at which the overriding mantle becomes coupled to the slab), the thermal parameter performs
well for internal slab temperature (slab mantle and increasingly the slab crust as depth increases). We adjust
this thermal parameter by modulating the importance of the slab speed, age, and angle to generate a more
effective, empirically derived temperature indicator. By doing this, we find that the temperature dependence
of the remainder of the slab can be described well by dividing the slab into two regions: age controlled and
primarily speed controlled. To first order, the age‐controlled region consists of the whole slab mantle and
MAUNDER ET AL. 685Geochemistry, Geophysics, Geosystems 10.1029/2018GC007641
both the mantle and crust shallower than the decoupling depth. Within this region, temperatures are deter-
mined almost exclusively by the age of the slab: younger slabs being hotter. The primarily speed‐controlled
region approximately consists of the slab crust deeper than the decoupling depth. The temperature within
this region is primarily controlled by speed and secondarily controlled by slab age: Slower, younger slabs
are hotter.
Crucially for melt generation, at subarc depths (~100 km), the slab mantle temperature is almost exclusively
age controlled and the slab crust temperature is primarily speed controlled (although we do not model the
top ~1 km of the slab and, as such, we recognize that this region may behave differently). In addition, our
results indicate that any early devolatilization (shallower than the decoupling depth) should depend on slab
age alone and the amount of deep water transport (in the core of the slab) should correlate well with the ori-
ginal definition of the thermal parameter.
We also investigate the effect of varying the decoupling depth. This has a dominant effect on slab tempera-
tures, overwhelming the effect of slab parameters, but only within the slab crust and to ~40 km deeper than
the maximum decoupling depth. However, whether decoupling depth is actually variable in reality
is debated.
Acknowledgments References
This study was supported by the
European Research Council (ERC StG Abers, G. A., van Keken, P. E., & Hacker, B. R. (2017). The cold and relatively dry nature of mantle forearcs in subduction zones. Nature
279828). This work made use of the Geoscience, 10(5), 333–337. https://doi.org/10.1038/ngeo2922
computational facilities of Hamilton Agrusta, R., Goes, S., & van Hunen, J. (2017). Subducting‐slab transition‐zone interaction: Stagnation, penetration and mode switches.
HPC at Durham University and N8 Earth and Planetary Science Letters, 464, 10–23. https://doi.org/10.1016/j.epsl.2017.02.005
HPC provided and funded by the N8 Arcay, D., Tric, E., & Doin, M. P. (2007). Slab surface temperature in subduction zones: Influence of the interplate decoupling depth
consortium and EPSRC (Grant and upper plate thinning processes. Earth and Planetary Science Letters, 255(3–4), 324–338. https://doi.org/10.1016/j.
EP/K000225/1). V. M. also epsl.2006.12.027
acknowledges support from the Behn, M. D., Kelemen, P. B., Hirth, G., Hacker, B. R., & Massonne, H. J. (2011). Diapirs as the source of the sediment signature in arc lavas.
Research Council of Norway through Nature Geoscience, 4(9), 641–646. https://doi.org/10.1038/ngeo1214
Bouilhol, P., Magni, V., van Hunen, J., & Kaislaniemi, L. (2015). A numerical approach to melting in warm subduction zones. Earth and
its Centres of Excellence funding
Planetary Science Letters, 411, 37–44. https://doi.org/10.1016/j.epsl.2014.11.043
scheme, Project 223272. We also thank
Clift, P., & Vannucchi, P. (2004). Controls on tectonic accretion versus erosion in subduction zones: Implications for the origin and recy-
the three anonymous reviewer and
cling of the continental crust. Reviews of Geophysics, 42, RG2001. https://doi.org/10.1029/2003RG000127
Editor Thorsten Becker for their con-
Cooper, L. B., Ruscitto, D. M., Plank, T., Wallace, P. J., Syracuse, E. M., & Manning, C. E. (2012). Global variations in H2O/Ce: 1. Slab
structive comments and suggestions,
surface temperatures beneath volcanic arcs. Geochemistry, Geophysics, Geosystems, 13, Q03024. https://doi.org/10.1029/2011GC003902
which greatly improved this manu-
Currie, C. A., Wang, K., Hyndman, R. D., & He, J. (2004). The thermal effects of steady‐state slab‐driven mantle flow above a subducting
script. All the data used are listed in the
plate: The Cascadia subduction zone and backarc. Earth and Planetary Science Letters, 223(1–2), 35–48. https://doi.org/10.1016/j.
references or archived in the following
epsl.2004.04.020
repository: Zenodo.org, record 2530260
Defant, M. J., & Drummond, M. S. (1990). Derivation of some modern arc magmas by melting of young subducted lithosphere. Nature,
(DOI: 10.5281/zenodo.2530260).
347(6294), 662–665. https://doi.org/10.1038/347662a0
England, P., Engdahl, R., & Thatcher, W. (2004). Systematic variation in the depths of slabs beneath arc volcanoes. Geophysical Journal
International, 156(2), 377–408. https://doi.org/10.1111/j.1365‐246X.2003.02132.x
England, P., & Wortel, R. (1980). Some consequences of the subduction of young slabs. Earth and Planetary Science Letters, 47(3), 403–415.
https://doi.org/10.1016/0012‐821X(80)90028‐X
England, P. C., & Katz, R. F. (2010). Melting above the anhydrous solidus controls the location of volcanic arcs. Nature, 467(7316), 700–703.
https://doi.org/10.1038/nature09417
Forsyth, D., & Uyeda, S. (1975). On the relative importance of the driving forces of plate motion. Geophysical Journal of the Royal
Astronomical Society, 43(1), 163–200. https://doi.org/10.1111/j.1365‐246X.1975.tb00631.x
Furukawa, Y. (1993). Depth of the decoupling plate interface and thermal structure under arcs. Journal of Geophysical Research, 98(B11),
20,005–20,013. https://doi.org/10.1029/93JB02020
Gerya, T. V., Stöckhert, B., & Perchuk, A. L. (2002). Exhumation of high‐pressure metamorphic rocks in a subduction channel: A numerical
simulation. Tectonics, 21(6), 1056. https://doi.org/10.1029/2002TC001406
Gerya, T. V., & Yuen, D. A. (2003). Rayleigh–Taylor instabilities from hydration and melting propel ‘cold plumes’ at subduction zones.
Earth and Planetary Science Letters, 212(1–2), 47–62. https://doi.org/10.1016/S0012‐821X(03)00265‐6
Gorbatov, A., & Kostoglodov, V. (1997). Maximum depth of seismicity and thermal parameter of the subducting slab: General empirical
relation and its application. Tectonophysics, 277(1–3), 165–187. https://doi.org/10.1016/S0040‐1951(97)00084‐X
Hacker, B. R., Kelemen, P. B., & Behn, M. D. (2011). Differentiation of the continental crust by relamination. Earth and Planetary Science
Letters, 307(3–4), 501–516. https://doi.org/10.1016/j.epsl.2011.05.024
Helffrich, G., & Brodholt, J. (1991). Relationship of deep seismicity to the thermal structure of subducted lithosphere. Nature, 353(6341),
252–255. https://doi.org/10.1038/353252a0
Heuret, A., & Lallemand, S. (2005). Plate motions, slab dynamics and back‐arc deformation. Physics of the Earth and Planetary Interiors,
149(1–2), 31–51. https://doi.org/10.1016/j.pepi.2004.08.022
Hyndman, R. D., & Peacock, S. M. (2003). Serpentinization of the forearc mantle. Earth and Planetary Science Letters, 212(3–4), 417–432.
https://doi.org/10.1016/S0012‐821X(03)00263‐2
Johnson, M. C., & Plank, T. (2000). Dehydration and melting experiments constrain the fate of subducted sediments. Geochemistry,
Geophysics, Geosystems, 1(12). https://doi.org/10.1029/1999GC000014
Kessel, R., Schmidt, M. W., Ulmer, P., & Pettke, T. (2005). Trace element signature of subduction‐zone fluids, melts and supercritical liquids
at 120–180 km depth. Nature, 437(7059), 724–727. https://doi.org/10.1038/nature03971
MAUNDER ET AL. 686Geochemistry, Geophysics, Geosystems 10.1029/2018GC007641
Kirby, S. H., Stein, S., Okal, E. A., & Rubie, D. C. (1996). Metastable mantle phase transformations and deep earthquakes in subducting
oceanic lithosphere. Reviews of Geophysics, 34(2), 261–306. https://doi.org/10.1029/96RG01050
Lallemand, S., Heuret, A., Faccenna, C., & Funiciello, F. (2008). Subduction dynamics as revealed by trench migration. Tectonics, 27,
TC3014. https://doi.org/10.1029/2007TC002212
Magni, V., Bouilhol, P., & van Hunen, J. (2014). Deep water recycling through time. Geochemistry, Geophysics, Geosystems, 15, 4203–4216.
https://doi.org/10.1002/2014GC005525
Marschall, H. R., & Schumacher, J. C. (2012). Arc magmas sourced from mélange diapirs in subduction zones. Nature Geoscience, 5(12),
862–867. https://doi.org/10.1038/ngeo1634
Maunder, B., Van Hunen, J., Magni, V., & Bouilhol, P. (2016). Relamination of mafic subducting crust throughout Earth's history. Earth
and Planetary Science Letters, 449, 206–216. https://doi.org/10.1016/j.epsl.2016.05.042
McKenzie, D. P. (1969). Speculations on the consequences and causes of plate motions. Geophysical Journal of the Royal Astronomical
Society, 18(1), 1–32. https://doi.org/10.1111/j.1365‐246X.1969.tb00259.x
Molnar, P., & England, P. (1995). Temperatures in zones of steady‐state underthrusting of young oceanic lithosphere. Earth and Planetary
Science Letters, 131(1–2), 57–70. https://doi.org/10.1016/0012‐821X(94)00253‐U
Moresi, L., & Gurnis, M. (1996). Constraints on the lateral strength of slabs from three‐dimensional dynamic flow models. Earth and
Planetary Science Letters, 138(1–4), 15–28. https://doi.org/10.1016/0012‐821X(95)00221‐W
Nichols, G. T., Wyllie, P. J., & Stern, C. R. (1994). Subduction zone melting of pelagic sediments constrained by melting experiments.
Nature, 371(6500), 785–788. https://doi.org/10.1038/371785a0
Peacock, S. M. (1990). Numerical simulation of metamorphic pressure‐temperature‐time paths and fluid production in subducting slabs.
Tectonics, 9(5), 1197–1211. https://doi.org/10.1029/TC009i005p01197
Penniston‐Dorland, S. C., Kohn, M. J., & Manning, C. E. (2015). The global range of subduction zone thermal structures from exhumed
blueschists and eclogites: Rocks are hotter than models. Earth and Planetary Science Letters, 428, 243–254. https://doi.org/10.1016/j.
epsl.2015.07.031
Perrin, A., Goes, S., Prytulak, J., Davies, D. R., Wilson, C., & Kramer, S. (2016). Reconciling mantle wedge thermal structure with arc lava
thermobarometric determinations in oceanic subduction zones. Geochemistry, Geophysics, Geosystems, 17, 4105–4127. https://doi.org/
10.1002/2016GC006527
Peterson, E. T., & Seno, T. (1984). Factors affecting seismic moment release rates in subduction zones. Journal of Geophysical Research,
89(B12), 10,233–10,248. https://doi.org/10.1029/JB089iB12p10233
Plank, T., Cooper, L. B., & Manning, C. E. (2009). Emerging geothermometers for estimating slab surface temperatures. Nature Geoscience,
2(9), 611–615. https://doi.org/10.1038/ngeo614
Poli, S., & Schmidt, M. W. (2002). Petrology of subducted slabs. Annual Review of Earth and Planetary Sciences, 30(1), 207–235. https://doi.
org/10.1146/annurev.earth.30.091201.140550
Rudnick, R. L. (1995). Making continental crust. Nature, 378(6557), 571. https://doi.org/10.1038/378571a0
Ruff, L., & Kanamori, H. (1980). Seismicity and the subduction process. Physics of the Earth and Planetary Interiors, 23(3), 240–252. https://
doi.org/10.1016/0031‐9201(80)90117‐X
Rüpke, L. H., Morgan, J. P., Hort, M., & Connolly, J. A. (2004). Serpentine and the subduction zone water cycle. Earth and Planetary Science
Letters, 223(1–2), 17–34. https://doi.org/10.1016/j.epsl.2004.04.018
Ruscitto, D. M., Wallace, P. J., Cooper, L. B., & Plank, T. (2012). Global variations in H2O/Ce: 2. Relationships to arc magma geochemistry
and volatile fluxes. Geochemistry, Geophysics, Geosystems, 13, Q03025. https://doi.org/10.1029/2011GC003887
Savov, I. P., Ryan, J. G., D'Antonio, M., & Fryer, P. (2007). Shallow slab fluid release across and along the Mariana arc‐basin system:
Insights from geochemistry of serpentinized peridotites from the Mariana fore arc. Journal of Geophysical Research, 112, B09205. https://
doi.org/10.1029/2006JB004749
Schmidt, M. W., & Poli, S. (2014). Devolatilization during subduction. In R. L. Rudnick (Ed.), Treatise in geochemistry (2nd ed., Vol. 4,
pp. 669–701). Amsterdam: Elsevier.
Skjerlie, K. P., & Douce, A. E. P. (2002). The fluid‐absent partial melting of a zoisite‐bearing quartz eclogite from 1 0 to 3 2 GPa; implications
for melting in thickened continental crust and for subduction‐zone processes. Journal of Petrology, 43(2), 291–314. https://doi.org/
10.1093/petrology/43.2.291
Syracuse, E. M., & Abers, G. A. (2006). Global compilation of variations in slab depth beneath arc volcanoes and implications. Geochemistry,
Geophysics, Geosystems, 7, Q05017. https://doi.org/10.1029/2005GC001045
Syracuse, E. M., van Keken, P. E., & Abers, G. A. (2010). The global range of subduction zone thermal models. Physics of the Earth and
Planetary Interiors, 183(1–2), 73–90. https://doi.org/10.1016/j.pepi.2010.02.004
Turcotte, D., & Schubert, G. (2014). Geodynamics. New York: Cambridge University Press. https://doi.org/10.1017/CBO9780511843877
Turner, S. J., & Langmuir, C. H. (2015). The global chemical systematics of arc front stratovolcanoes: Evaluating the role of crustal pro-
cesses. Earth and Planetary Science Letters, 422, 182–193. https://doi.org/10.1016/j.epsl.2015.03.056
Ulmer, P., & Trommsdorff, V. (1995). Serpentine stability to mantle depths and subduction‐related magmatism. Science, 268(5212),
858–861. https://doi.org/10.1126/science.268.5212.858
van Hunen, J., van den Berg, A. P., & Vlaar, N. J. (2004). Various mechanisms to induce present‐day shallow flat subduction and impli-
cations for the younger Earth: A numerical parameter study. Physics of the Earth and Planetary Interiors, 146(1–2), 179–194. https://doi.
org/10.1016/j.pepi.2003.07.027
van Keken, P. E., Hacker, B. R., Syracuse, E. M., & Abers, G. A. (2011). Subduction factory: 4. Depth‐dependent flux of H2O from sub-
ducting slabs worldwide. Journal of Geophysical Research, 116, B01401. https://doi.org/10.1029/2010JB007922
van Keken, P. E., Kiefer, B., & Peacock, S. M. (2002). High‐resolution models of subduction zones: Implications for mineral dehydration
reactions and the transport of water into the deep mantle. Geochemistry, Geophysics, Geosystems, 3(10), 1056. https://doi.org/10.1029/
2001GC000256
Wada, I., & Wang, K. (2009). Common depth of slab‐mantle decoupling: Reconciling diversity and uniformity of subduction zones.
Geochemistry, Geophysics, Geosystems, 10, Q10009. https://doi.org/10.1029/2009GC002570
Wang, H., Agrusta, R., & Hunen, J. (2015). Advantages of a conservative velocity interpolation (CVI) scheme for particle‐in‐cell methods
with application in geodynamic modeling. Geochemistry, Geophysics, Geosystems, 16, 2015–2023. https://doi.org/10.1002/2015GC005824
Wiens, D. A., & Gilbert, H. J. (1996). Effect of slab temperature on deep‐earthquake aftershock productivity and magnitude–frequency
relations. Nature, 384(6605), 153–156. https://doi.org/10.1038/384153a0
Zhong, S., Zuber, M. T., Moresi, L., & Gurnis, M. (2000). Role of temperature‐dependent viscosity and surface plates in spherical shell
models of mantle convection. Journal of Geophysical Research, 105(B5), 11,063–11,082. https://doi.org/10.1029/2000JB900003
MAUNDER ET AL. 687You can also read