Predictive analysis of the number of human brucellosis cases in Xinjiang, China
←
→
Page content transcription
If your browser does not render page correctly, please read the page content below
www.nature.com/scientificreports
OPEN Predictive analysis of the number
of human brucellosis cases
in Xinjiang, China
Yanling Zheng1*, Liping Zhang1, Chunxia Wang1, Kai Wang1, Gang Guo2,
Xueliang Zhang1* & Jing Wang3*
Brucellosis is one of the major public health problems in China, and human brucellosis represents
a serious public health concern in Xinjiang and requires a prediction analysis to help making early
planning and putting forward science preventive and control countermeasures. According to the
characteristics of the time series of monthly reported cases of human brucellosis in Xinjiang from
January 2008 to June 2020, we used seasonal autoregressive integrated moving average (SARIMA)
method and nonlinear autoregressive regression neural network (NARNN) method, which are widely
prevalent and have high prediction accuracy, to construct prediction models and make prediction
analysis. Finally, we established the SARIMA((1,4,5,7),0,0)(0,1,2)12 model and the NARNN model
with a time lag of 5 and a hidden layer neuron of 10. Both models have high fitting performance.
After comparing the accuracies of two established models, we found that the SARIMA((1,4,5,7),0,0)
(0,1,2)12 model was better than the NARNN model. We used the SARIMA((1,4,5,7),0,0)(0,1,2)12 model
to predict the number of monthly reported cases of human brucellosis in Xinjiang from July 2020
to December 2021, and the results showed that the fluctuation of the time series from July 2020 to
December 2021 was similar to that of the last year and a half while maintaining the current prevention
and control ability. The methodology applied here and its prediction values of this study could be
useful to give a scientific reference for prevention and control human brucellosis.
Brucellosis is a neglected zoonosis. It causes acute febrile illness and a potentially debilitating chronic infection
in humans, and livestock infection has substantial socioeconomic impact1,2. Brucella spp. can spread through
damaged skin, mucous membrane, digestive tract, and respiratory t ract3. Contact with contaminated animals
and consumption of unpasteurized dairy products are the main routes for human infection. Fever, fatigue, hyper-
hidrosis, muscle and joint pain, spleen, and lymphadenopathy were the main manifestations during the acute
period of patient. After a patient is infected, this disease often lasts several weeks or months. If timely treatment
can be carried, the patient can be healed, otherwise, become a chronic patient suffering from long-term pain,
even lose labor and fertility.
Brucellosis is one of the main diseases endangering public health and safety in C hina4–7. Human brucel-
losis cases in China, mainly found in pastoral areas, are mostly herdsmen and veterinarians. According to data
from the China Public Health Data Center (http://www.phsciencedata.cn/Share/), the first five provinces with
the highest incidence of human brucellosis in China are Inner Mongolia, Xinjiang, Ningxia, Shanxi, and Hei-
longjiang, among which Xinjiang ranks second. A large number of brucellosis patients brought serious harm
to the development of social and economic health in Xinjiang. In order to develop measures for the prevention
and control of brucellosis in Xinjiang, some activities have been gradually introduced, such as introduction of
diagnostic criteria, treatment protocols, control measures, and vaccination of domestic animals. At present, the
annual number of human brucellosis cases was still very large. Therefore, the prevention and control of brucel-
losis in Xinjiang need continuous efforts, and the task of prevention and control is still arduous.
1
College of Medical Engineering and Technology, Xinjiang Medical University, Urumqi 830054, People’s Republic
of China. 2State Key Laboratory of Pathogenesis, Prevention and Treatment of High Incidence Diseases in Central
Asia, Clinical Medicine Institute, the First Affiliated Hospital of Xinjiang Medical University, Urumqi 830054,
People’s Republic of China. 3Department of Respiratory Medicine, First Affiliated Hospital of Xinjiang Medical
University, Urumqi 830054, People’s Republic of China. *email: zhengyl_math@sina.cn; shuxue2456@126.com;
wangjing_hxk@sina.com
Scientific Reports | (2021) 11:11513 | https://doi.org/10.1038/s41598-021-91176-5 1
Vol.:(0123456789)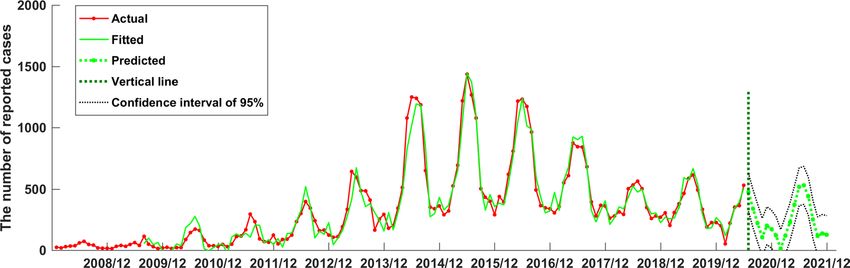
www.nature.com/scientificreports/
Year Reported cases Year Reported cases
2008 425 2014 7708
2009 498 2015 8467
2010 848 2016 8042
2011 1411 2017 6485
2012 2335 2018 4429
2013 4095 2019 4349
Table 1. The number of reported annual cases of human brucellosis in Xinjiang from 2008 to 2019.
Scientific analysis and prediction of the number of human brucellosis cases can provide recommendations
for evaluating and formulating health financing policies, health reform, and development strategies. Prediction
techniques include quantitative and qualitative forecasting. Quantitative forecasting requires hard data and
number crunching, while qualitative forecasting relies more on estimates and instincts of experts. Compared
to qualitative forecasting, quantitative forecasting is more widely used and requires statistical methods and
mathematical methods including differential equation m ethod8–11, time series prediction m ethod12–14, regres-
sion method15,16, neural network method17–22, and grey prediction m ethod23,24, and so on. Among which the
NARNN model of the neural network methods has high prediction performance and can capture the nonlinear
information of the data w ell25–27, and the SARIMA model of time series methods can capture the periodicity,
trend, and randomness of the data well28. Over the past several years, both NARNN model and SARIMA model
were widely used in the prediction of various diseases incidence. For example, Saba et al29 forecasted the preva-
lence of COVID-19 outbreak in Egypt using nonlinear autoregressive artificial neural networks(NARNN). Zhou
et al30 used the SARIMA, the NARNN, and the hybrid SARIMA-NARNN model to fit and forecast the monthly
and daily number of new admission inpatients. Ebhuoma et al31 predicted monthly incidence of malaria using
SARIMA model. Xu et al.32 forecasted the incidence of Mumps in Zibo City based on a SARIMA Model; e tc33–38.
In this article, we aimed to make a prediction analysis of the number of human brucellosis cases based on
an academic point of view so as to help to make early planning for the future situation and put forward more
scientific preventive and control countermeasures. The paper is structured in the following way: first, we estab-
lished an optimal SARIMA model to predict and analyze the number of human brucellosis cases in Xinjiang.
Second, we established an optimal NARNN model to predict and analyze the number of human brucellosis cases
in Xinjiang. Third, we compared the prediction performance of the two models. Finally, the better model was
chosen to do prediction analysis from July 2020 to December 2021.
Materials and methods
Data sources. We collected the annual incidence of human brucellosis of 31 provinces in China from 2014
to 2017 and the number of monthly reported cases of human brucellosis in Xinjiang from January 2008 to
June 2020. Among which the data from January 2008 to December 2017 were from the website of the National
Public Health data Center (http://www.phsciencedata.cn/Share/), and the data from January 2018 to June 2020
were from the website of the Xinjiang Health and Health Commission. The number of reported annual cases of
human brucellosis in Xinjiang from 2018 to 2019 was shown in Table 1.
SARIMA model39. In the fields of prediction, we often encounter non-stationary time series with seasonal-
ity, trend and randomness. The SARIMA model is very suitable for predicting and analyzing this kind of time
series28. The SARIMA model is derived from the autoregressive integrated moving average model (ARIMA) cre-
ated by Box and Jenkins. It is a short-term prediction method with high accuracy39. It can realize the structural
characteristics of time series more fundamentally and achieve the optimal prediction in the sense of v ariance39.
When the time series studied are seasonal, the ARIMA model often requires some seasonal processing, which
transforms the ARIMA model into a SARIMA(p,d,q)(P,D,Q)s model, and it has the following forms:
(1 − ϕ1 L − · · · − ϕp Lp )(1 − α1 Ls − · · · − αP LPs )(�d �D
s yt )
= (1 + θ1 L + · · · + θq Lq )(1 + β1 Ls + · · · + βQ LQs )εt ,
�1s yt = (1 − Ls )yt = yt − yt−s ,
(1 − L)yt = yt − yt−1 ,
where,α1 , α2 , . . . , αP , β1 , β2 , . . . , βQ,ϕ1 , ϕ2 , . . . , ϕp,θ1 , θ2 , . . . , and θq are parameters. d means doing d times
ordinary differencing, and D s means doing D times season differencing. Seasonal cycle s of monthly time series
is 12.
In particular, if some parameters such as α2, β2, ϕ2, θ2 in the model are 0, then the SARIMA(p,d,q)(P,D,Q)s
model becomes sparse. This sparse SARIMA(p,d,q)(P,D,Q)s model can be characterized as:
SARIMA((1, 3, . . . , p), d, (1, 3, . . . , q))((1, 3, . . . , P), D, (1, 3, . . . , Q))s
Scientific Reports | (2021) 11:11513 | https://doi.org/10.1038/s41598-021-91176-5 2
Vol:.(1234567890)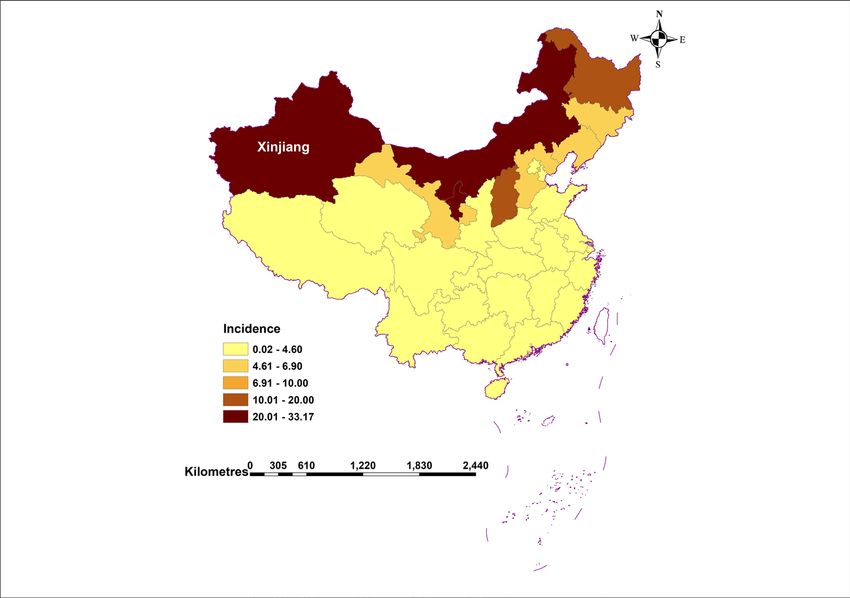
www.nature.com/scientificreports/
In this study, we collected the data of monthly reported cases of human brucellosis in Xinjiang from January
2008 to June 2020. The data had obvious seasonality, trend and randomness. According to the characteristics of
the data, we chose the SARIMA method to do prediction analysis.
The construction process of SARIMA model includes: 1. To Make the research sequence stable by ordinary
differencing or seasonal differencing. The d is the degree of ordinary differencing, and the D is the degree of
seasonal differencing. 2. To determine possible P, Q, p, and q by analyzing the autocorrelation function (ACF)
graph and partial correlation function (PACF) graph of stationary sequence. This step requires researcher’s
professional knowledge and experience. 3. To test the parameters of the possible models (p-value less than 0.05
means statistical significance), and then to compare their Akaike Information Criterion (AIC), Schwarz Criterion
(SC), and R 2 of models passed parameter tests. The larger the R
2 is, and the smaller the AIC and SC values are,
the higher the goodness of fit of the model is. 4. To do the residual error test of the established model with the
largest R2, smallest AIC and SC. If there is almost no autocorrelation and partial correlation among the residuals
of the model, then the residual error will be white noise, indicating that the established model has extracted the
original information fully and can be successfully used for prediction analysis.
Nonlinear Autoregressive Neural Network (NARNN)40–42. In recent years, the NARNN has achieved
good results in time series analysis because of its good nonlinear characteristics, parallel distributed storage
structure and high fault tolerance. As a kind of dynamic neural network, the NARNN has good dynamic and
anti-interference ability, and can be used to approximate any nonlinear dynamic system. The NARNN model is a
dynamic neural network model based on time series, it takes into account the nonlinear ability of neural network
and the advantages of autoregressive (AR) model in processing time series. The output of each time is based on
the dynamic results of the system before the current time, and it has the function of feedback and memory. The
NARNN function model can be expressed as:
y(t) = f [y(t − 1), y(t − 2), . . . , y(t − n)],
where, y represents input parameter, t denotes time period, n is the delay order of the NARNN model, and the
f [·] is the function of the NARNN model. The previously obtained health state sequence F(t) is used as the input
of the NARNN to establish a prediction model for the time series.
In this work, to develop the optimal NARNN model, the monthly reported number of human brucellosis cases
from January 2008 to June 2020 was randomly broken into three subseries: the training, validation, and testing
subseries comprising 70%, 15%, and 15% of all the data, respectively. A series of experiments with different hid-
den neurons and d delays were then conducted to find the optimal method in an open feedback mode based on
the autocorrelogram, response graph of the outputs and targets, mean square error43. Lastly, a prediction into
the testing series can be conducted in a closed-loop mode.
The measurement of model comparison. Root mean square error (RMSE), mean absolute error
(MAE), and mean absolute percentage error (MAPE) are often used to measure the model fitting performance43.
In this study, the RMSE, MAE, and MAPE are used to compare the fitting ability of the established SARIMA
model and the NARNN model. The smaller these values are, the better the fitting and prediction performance of
model is. The measurements are expressed as43,44:
n
2
t=1 yt− y
t
RMSE = ,
n
n
yt− y
t
MAE = t=1 ,
n
n yt− y
t
t=1 yt × 100
MAPE = ,
n
where, y t is the predicted value of yt, yt is the actual values, and n is the number of observations.
Statistical software. We conducted SARIMA models in R [v3.6.2] using the forecast package, and
Eviews7.0 software. We conducted NARNN models by matlab2012b. Except for Fig. 1 plotted by ArcMap10.4.1,
all other Figures are plotted by matlab2012b.
Results
Drawing the distribution graph (Fig. 1) of the average annual incidence of human brucellosis in China from
2014 to 2017. From which we can see that the incidence of human brucellosis in Xinjiang was higher than that
of most provinces. From January 2008 to June 2020, 51,182 cases of human brucellosis were reported in Xinji-
ang, and the number of reported cases in this period was shown in Fig. 2. From Fig. 2, it could be seen that the
time series of human brucellosis cases was obviously seasonal. From May to August of each year, it was the high
incidence period of this disease. From 2008 to 2015, the number of human brucellosis cases showed an upward
trend. After that, under the vigorous prevention and control of the government and Centers for Disease Control
and Prevention in Xinjiang, the number of the brucellosis patients decreased year by year. In February last year,
in the case of strict prevention of COVID-19, the incidence of this disease had also been greatly controlled.
Scientific Reports | (2021) 11:11513 | https://doi.org/10.1038/s41598-021-91176-5 3
Vol.:(0123456789)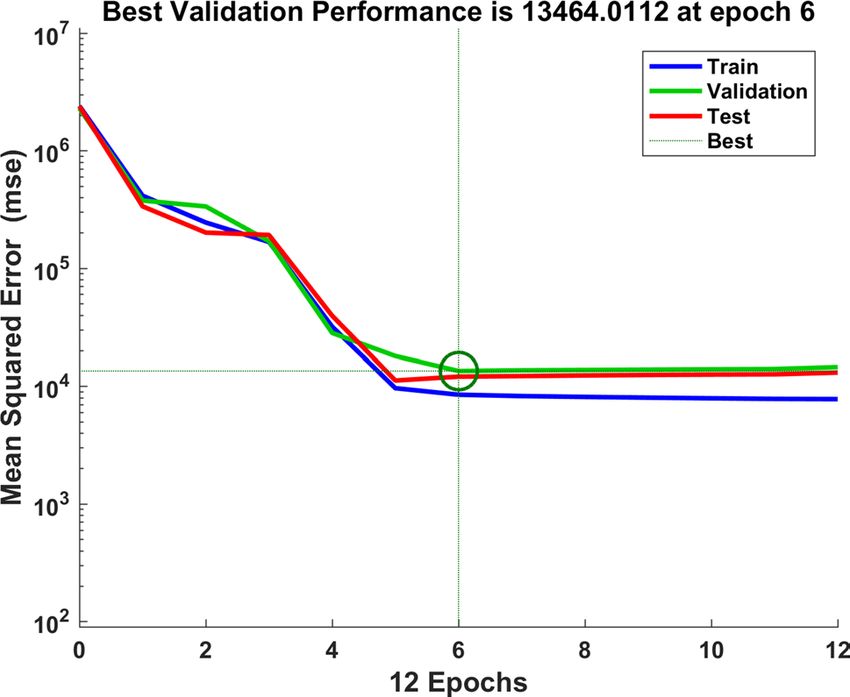
www.nature.com/scientificreports/
Figure 1. The average annual incidence (per 100,000 populations) of human brucellosis in China from 2014 to
2017. (This figure is plotted by ArcMap10.4.1).
Figure 2. The time series of monthly reported cases of human brucellosis in Xinjiang from January 2008 to
June 2020.
The prediction analysis of SARIMA model. The SARIMA model is based on stationary data. Firstly,
we used Augmented Dickey Fuller’s test (ADF) to test the stationarity of the data. The p-value of the test was
0.56, which indicated that the data was not stationary. Because the data had obvious seasonality (s = 12), we
did seasonal differencing to make the data stationary. After the seasonal differencing, the p-value of the ADF
test is less than 0.05, and transformed time series appeared to be stationary (see Fig. 3), indicating that the data
has been stationary (d = 0, D = 1). Draw the ACF and PACF graphs (see Fig. 4) of the stationary data to help us
determining these values of possible p, q, P, and Q. Based on the analysis of Fig. 4, we found that the autocor-
relation coefficients were trailing, therefore, we gave q = 0, Q = 1 or 2. For the value of p, we tried taking 1, 2, 4,
5, 6, and 7, respectively. For the value of P, we took 1. Then, the parameters of SARIMA(p,0,0)(P, 1, Q)12 models
with different combination of p, P, and Q were tested, and the AIC and SC values of these models were cal-
culated. Finally, only six models (SARIMA(1,0,0)(0,1,0)12, SARIMA((1,4,7),0,0)(0,1,0)12, SARIMA((1,5,7),0,0)
(0,1,0)12,SARIMA((1,4,5),0,0)(0,1,2)12,SARIMA((1,4,7),0,0)(0,1,2)12,and SARIMA((1,4,5,7),0,0)(0,1,2)12)
passed all parameter tests, as shown in Table 2. Of these six models, model 6 had the smallest AIC and the larg-
est R2, so it was the model with the best fitting ability. The expression of model 6 was SARIMA((1,4,5,7),0,0)
(0,1,2)12. In order to examine the residuals of the SARIMA((1,4,5,7),0,0)(0,1,2)12 model, we drew the ACF and
PACF plots of the model residuals (see Fig. 5). It could be seen from Fig. 5 that the autocorrelation and partial
correlation coefficients of the residuals were basically within twice the standard deviation, indicating that the
residuals were basically white noise, and the SARIMA((1,4,5,7),0,0)(0,1,2)12 model extracted the information of
the original data well and had good performance. Therefore, the SARIMA((1,4,5,7),0,0)(0,1,2)12 model could be
used to predict the number of reported cases of human brucellosis in Xinjiang.
Scientific Reports | (2021) 11:11513 | https://doi.org/10.1038/s41598-021-91176-5 4
Vol:.(1234567890)www.nature.com/scientificreports/
400
200
0
-200
-400
-600
2009/12 2010/12 2011/12 2012/12 2013/12 2014/12 2015/12 2016/12 2017/12 2018/12 2019/12
Figure 3. Plot of time series after differencing.
1
0.5
ACF
0
-0.5
-1
0 5 10 15 20 25
lags
1
PACF
0
-1
0 5 10 15 20 25
lags
Figure 4. The ACF and PACF of time series after differencing of human brucellosis cases in Xinjiang.
Model 1 Model 2 Model 3 Model 4 Model 5 Model 6
AR(1) 0.85* 0.89* 0.84* 0.95* 0.9* 0.93*
AR(4) – − 0.18* – − 0.4* − 0.18* − 0.33*
AR(5) – – − 0.13* 0.33* – 0.2*
AR(7) – 0.17* 0.18* – 0.19* 0.12*
SMA(2) – – – − 0.89* − 0.88* − 0.89*
AIC 11.85 11.83 11.87 11.58 11.59 11.57
SC 11.88 11.9 11.93 11.67 11.67 11.68
R2 0.71 0.74 0.73 0.794 0.796 0.802
Table 2. Results of parameter tests and the AIC, SC, and R2 values of the six models of passed parameter tests.
*Means significant at 0.05 level.
The prediction analysis of NARNN model. We used the data of time series of human brucellosis cases
from January 2008 to June 2020 in Xinjiang to train NARNN, 70% of the raw data was used as training data, 15%
as validation data, and the remaining 15% as test data. By repeatedly adjusting the number of neurons in the
hidden layer and the number of time lags, and finally, we found that the NARNN structure with 10 hidden layer
neurons and 5 time lag was the best, and its error requirement was satisfied. The best validation performance
was 13,464.0112 at epoch 6 (see Fig. 6). By using the established NARNN model to fit the original the number
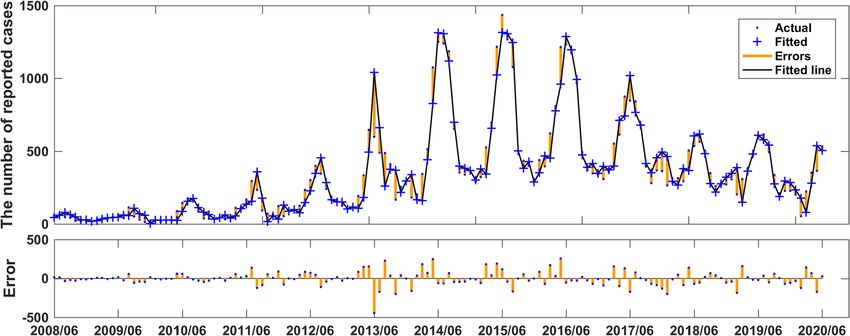
of monthly reported cases of human brucellosis, we got the graph of fitting and error results (see Fig. 7). The
autocorrelation diagram of the errors was shown in Fig. 8. From Fig. 8, we could see that the error was only the
largest correlation with itself, and the correlation coefficient at other lags was almost in the confidence interval,
indicating that the established NARNN model had good fitting performance.
Scientific Reports | (2021) 11:11513 | https://doi.org/10.1038/s41598-021-91176-5 5
Vol.:(0123456789)www.nature.com/scientificreports/
1
ACF
0
-1
0 5 10 15 20 25
lags
1
PACF
0
-1
0 5 10 15 20 25
lags
Figure 5. The ACF and PACF of residual sequence of the SARIMA((1,4,5,7),0,0)(0,1,2)12 model.
Figure 6. The graph of looking for the best validation performance.
Model comparison. Both the SARIMA((1,4,5,7),0,0)(0,1,2)12 model and the established NARNN model in
this study had good fitting performance and could be used to predict and analyze the number of reported cases
of human brucellosis in the future. However, in order to obtain more accurate prediction values, we aimed to
compare the two models and selected the better one to make prediction analysis. Therefore, we calculated the
RMSE, MAE, and MAPE of the two models when they fitted the original human brucellosis sequence, respec-
tively (see Table 3). From Table 3, we could see that the RMSE, MAE, and MAPE of the SARIMA((1,4,5,7),0,0)
(0,1,2)12 model were smaller than that of the NARNN model, indicating that the SARIMA((1,4,5,7),0,0)
(0,1,2)12 model was better than the established NARNN model. Therefore, the SARIMA((1,4,5,7),0,0)(0,1,2)12
model was more suitable to predict the future number of human brucellosis cases in Xinjiang. We used the
SARIMA((1,4,5,7),0,0)(0,1,2)12 model to predict the number of reported cases of human brucellosis in Xinjiang
from July 2020 to December 2021, as shown in Table 4. Furthermore, in order to see the performance of fitting
and prediction more intuitively, we plotted the Fig. 9.
Discussion
Brucellosis remains a serious public health issue, and more efforts are needed to reach the goal of controlling
human and animal brucellosis in China. Xinjiang has a high incidence of human brucellosis, and the brucel-
losis patients are mainly pastoralists and veterinarians. The total population of Xinjiang is no more than thirty
Scientific Reports | (2021) 11:11513 | https://doi.org/10.1038/s41598-021-91176-5 6
Vol:.(1234567890)www.nature.com/scientificreports/
Figure 7. Actual series, fitted series, and residual series of the reported cases sequence of human brucellosis.
Autocorrelation of Error
8000
Correlations
Zero Correlation
7000 Confidence Limit
6000
5000
Correlation
4000
3000
2000
1000
0
-1000
-2000
-20 -15 -10 -5 0 5 10 15 20
Lags
Figure 8. Autocorrelation graph of the residuals of the NARNN model.
RMSE MAE MAPE
SARIMA((1,4,5,7),0,0)(0,1,2)12 75.87 56.62 32.4
NARNN 92.46 61.47 33.6
Table 3. Fitting accuracy values of the SARIMA((1,4,5,7),0,0)(0,1,2)12 model and the NARNN model.
Date Predicted Date Predicted Date Predicted
2020/07 476 2021/01 121 2021/07 531
2020/08 340 2021/02 15 2021/08 443
2020/09 221 2021/03 120 2021/09 252
2020/10 108 2021/04 230 2021/10 118
2020/11 201 2021/05 374 2021/11 137
2020/12 174 2021/06 519 2021/12 128
Table 4. The number of predicted human brucellosis cases in Xinjiang by the SARIMA((1,4,5,7),0,0)(0,1,2)12
model.
Scientific Reports | (2021) 11:11513 | https://doi.org/10.1038/s41598-021-91176-5 7
Vol.:(0123456789)www.nature.com/scientificreports/
Figure 9. The SARIMA((1,4,5,7),0,0)(0,1,2)12 model fitted and forecasted time series of reported cases of
human brucellosis in Xinjiang.
million, furthermore, the number of herdsmen is not very large, but the number of monthly reported cases of
human brucellosis is relatively large. It shows that the incidence of human brucellosis is very high in herdsmen
and veterinary groups. From 2008 to 2016, the incidence of human brucellosis in Xinjiang increased year by year,
which caused great harm to Xinjiang’s economic construction and the development of animal husbandry. In
recent several years, the relevant departments of disease prevention and control in Xinjiang have stepped up their
prevention and control efforts; therefore, the number of human brucellosis cases has been decreasing year by year.
It is well accepted that the accurate identification of seasonality plays a good role in timely responses and rea-
sonably allocated resource for infectious d isease45. In our study, human brucellosis can occur during all seasons,
but a clear seasonality with a periodicity of 12 months was noted from January 2008 to December 2019, and
there was a peak in May, June, July, and August of every year, similar seasonal characteristics are also presented
in other r esearches45,46. In Xinjiang, a variety of complicated factors may be responsible for human brucellosis
peak such as temperature, humidity, wind speed, air pollution, and the climatic characteristics of summer with
high temperature affecting people’s behavior and diet.
In order to further eliminate brucellosis, the prevention and control technology of brucellosis needs to be
gradually improved; and helps from all sides are needed. Forecasting epidemic trend of infectious diseases is an
important link of disease prevention and control. In this study, we have aimed to do some prediction analysis
providing some help for the prevention and control of human brucellosis in Xinjiang. After careful analysis,
we established the optimal SARIMA((1,4,5,7),0,0,)(0,1,2)12 model. In the construction of the NARNN model,
based on the characteristics of the data and repeated debugging, we finally identified the NARNN with a time
lag of 5 and a hidden layer neuron of 10. Using RMSE, MAE and MAPE to compare the fitting abilities of the
SARIMA((1,4,5,7),0,0,)(0,1,2)12 model with that of the established NARNN model, we got the conclusion. The
conclusion showed that the SARIMA((1,4,5,7),0,0,)(0,1,2)12 model had smaller values of RMSE, MAE, and
MAPE, indicating that the fitting ability of the SARIMA((1,4,5,7),0,0,)(0,1,2)12 model was better than that of the
established NARNN model. As a result, the SARIMA((1,4,5,7),0,0,)(0,1,2)12 model was more suitable for future
prediction of the number of human brucellosis cases in Xinjiang. We used the SARIMA((1,4,5,7),0,0,)(0,1,2)12
model to predict the number of reported cases of human brucellosis in Xinjiang from July 2020 to December
2021. And the results showed that if existing prevention and control efforts are maintained, the changes of the
monthly incidence of human brucellosis will be similar to that of July 2019 to December 2020.
Several studies found that the NARNN method has good performance when it is used to do prediction
analysis47. However, most studies found that SARIMA method has a good ability of fitting and forecasting
analysis31–34. Based on the characteristics of our data, we also found that the SARIMA method outperforms the
NARNN method. From Fig. 9, we can see that the established SARIMA((1,4,5,7),0,0,)(0,1,2)12 model can fit his-
tory data successfully, and give credible prediction numbers of human brucellosis cases in Xinjiang.
However, in this study, there are also two main limitations. One of the limitations is the access to more granu-
lar data such as environmental data, meteorological data, local regulations, and so on. These might allow for a
better explanation of changes in the number of human brucellosis cases in Xinjiang. Further improvements of
the proposed model may be achieved by incorporating additional information. Another limitation is that the
accuracy of long-term prediction of the SARIMA((1,4,5,7),0,0,)(0,1,2)12 model will be reduced. Therefore, if long-
term prediction with high accuracy is needed, then new data and updating the model further will be required.
Conclusions
This study is the first prediction analysis of the number of human brucellosis cases in Xinjiang for the period 2008
to 2021. Our study found that both SARIMA method and NARNN method are effective methods for predicting
the number of human brucellosis cases in Xinjiang, and the accuracy of the SARIMA method outperforms that
of the NARNN method. Using the established SARIMA((1,4,5,7),0,0,)(0,1,2)12 model, we predicted the number
of human brucellosis cases in Xinjiang from July 2020 to December 2021.Our study method and prediction
results can contribute some ideas for the policy maker to make decision in the future.
Scientific Reports | (2021) 11:11513 | https://doi.org/10.1038/s41598-021-91176-5 8
Vol:.(1234567890)www.nature.com/scientificreports/
Received: 26 October 2020; Accepted: 24 May 2021
References
1. Dadar, M., Shahali, Y. & Whatmore, A. M. Human brucellosis caused by raw dairy products: A review on the occurrence, major
risk factors and prevention. Int. J. Food Microbiol. 292, 39–47 (2019).
2. Jiang, H., O’Callaghan, D. & Ding, J. B. Brucellosis in China: history, progress and challenge. Infect. Dis. Poverty 9, 55 (2020).
3. Vollmar, P., Zange, S., Zöller, L., Erkel, J. & Thoma, B. R. Brucellose Brucellosis, an overview and current aspects. Dtsch. Med.
Wochenschr. 141, 1014–1018 (2016).
4. Shi, Y. et al. Clinical features of 2041 human brucellosis cases in China. PLoS ONE 13, e0205500 (2018).
5. Zheng, R. et al. A systematic review and meta-analysis of epidemiology and clinical manifestations of human brucellosis in China.
Biomed. Res. Int. 2018, 5712920 (2018).
6. Deng, Y., Liu, X., Duan, K. & Peng, Q. Research progress on Brucellosis. Curr. Med. Chem. 26, 5598–5608 (2019).
7. Lai, S. et al. Changing epidemiology of human brucellosis, China, 1955–2014. Emerg. Infect. Dis. 23, 184–194 (2017).
8. Canfell, K. et al. Mortality impact of achieving WHO cervical cancer elimination targets: A comparative modelling analysis in 78
low-income and lower-middle-income countries. Lancet 395, 591–603 (2020).
9. Alanazi, H. O., Abdullah, A. H., Qureshi, K. N. & Ismail, A. S. Accurate and dynamic predictive model for better prediction in
medicine and healthcare. Ir. J. Med. Sci. 187, 501–513 (2018).
10. Wang, K., Teng, Z. & Zhang, X. Dynamical behaviors of an Echinococcosis epidemic model with distributed delays. Math. Biosci.
Eng. 14, 1425–1445 (2017).
11. Song, Y., Zhang, T., Li, H., Wang, K. & Liu, X. Mathematical model analysis and simulation of visceral leishmaniasis, Kashgar,
Xinjiang, 2004–2016. Complexity 2020, 5049825 (2020).
12. Tian, C. W., Wang, H. & Luo, X. M. Time-series modelling and forecasting of hand, foot and mouth disease cases in China from
2008 to 2018. Epidemiol. Infect. 147, e82 (2019).
13. Arruda, A. G., Vilalta, C., Puig, P., Perez, A. & Alba, A. Time-series analysis for porcine reproductive and respiratory syndrome
in the United States. PLoS ONE 13, e0195282 (2018).
14. Hao, Y. et al. Time series analysis of mumps and meteorological factors in Beijing. China. BMC Infect. Dis. 19, 435 (2019).
15. Hongjun, Y., Chunmei, C. & An, R. Regression models to predict corrected height, weight, and obesity indicators among University
Students in Beijing, China. Am. J. Health Behav. 42, 70–77 (2018).
16. Lamu, A. N. & Olsen, J. A. Testing alternative regression models to predict utilities: mapping the QLQ-C30 onto the EQ-5D-5L
and the SF-6D. Qual. Life Res. 27, 2823–2839 (2018).
17. Baldini, C., Ferro, F., Luciano, N., Bombardieri, S. & Grossi, E. Artificial neural networks help to identify disease subsets and to
predict lymphoma in primary Sjögren’s syndrome. Clin. Exp. Rheumatol. 112, 137–144 (2018).
18. Jaganathan, K. et al. Predicting splicing from primary sequence with deep learning. Cell 176, 535–548 (2019).
19. Shioji, M. et al. Artificial neural networks to predict future bone mineral density and bone loss rate in Japanese postmenopausal
women. BMC Res Notes. 10, 590 (2017).
20. Liu, W. et al. Forecasting incidence of hand, foot and mouth disease using BP neural networks in Jiangsu province, China. BMC
Infect. Dis. 19, 828 (2019).
21. Wu, W., An, S. Y., Guan, P., Huang, D. S. & Zhou, B. S. Time series analysis of human brucellosis in mainland China by using Elman
and Jordan recurrent neural networks. BMC Infect. Dis. 19, 414 (2019).
22. Wang, K. W. et al. Hybrid methodology for tuberculosis incidence time-series forecasting based on ARIMA and a NAR neural
network. Epidemiol. Infect. 145, 1118–1129 (2017).
23. Yang, X., Zou, J., Kong, D. & Jiang, G. The analysis of GM (1, 1) grey model to predict the incidence trend of typhoid and paraty-
phoid fevers in Wuhan City, China. Medicine (Baltimore) 97, e11787 (2018).
24. Zhou, Q., Lin, L., Chen, G. & Du, Z. Prediction and optimization of electrospun polyacrylonitrile fiber diameter based on grey
system theory. Materials (Basel) 12, 2237 (2019).
25. Kırbaş, İ, Sözen, A., Tuncer, A. D. & Kazancıoğlu, F. Ş. Comparative analysis and forecasting of COVID-19 cases in various Euro-
pean countries with ARIMA, NARNN and LSTM approaches. Chaos Solitons Fractals 38, 110015 (2020).
26. Wang, Y. et al. Use of meteorological parameters for forecasting scarlet fever morbidity in Tianjin, Northern China. Environ. Sci.
Pollut. Res. Int. 28, 7281–7294 (2021).
27. Luna, A. M., Lineros, M. L., Gualda, J. E., Giráldez Cervera, J. V. & Madueño Luna, J. M. Assessing the best gap-filling technique
for river stage data suitable for low capacity processors and real-time application using IoT. Sensors (Basel) 20, 6354 (2020).
28. Malki, Z. et al. ARIMA models for predicting the end of COVID-19 pandemic and the risk of second rebound. Neural Comput.
Appl. 23, 1–20 (2020).
29. Saba, A. I. & Elsheikh, A. H. Forecasting the prevalence of COVID-19 outbreak in Egypt using nonlinear autoregressive artificial
neural networks. Process Saf. Environ. Prot. 141, 1–8 (2020).
30. Zhou, L., Zhao, P., Wu, D., Cheng, C. & Huang, H. Time series model for forecasting the number of new admission inpatients.
BMC Med. Inform. Decis. Mak. 18, 39 (2018).
31. Ebhuoma, O., Gebreslasie, M. & Magubane, L. A Seasonal Autoregressive Integrated Moving Average (SARIMA) forecasting model
to predict monthly malaria cases in KwaZulu-Natal South Africa. S. Afr. Med. J. 108, 73–578 (2018).
32. Xu, Q. et al. Forecasting the incidence of mumps in Zibo City based on a SARIMA model. Int. J. Environ. Res. Public Health 14,
925 (2017).
33. Tohidinik, H. R. et al. Forecasting zoonotic cutaneous leishmaniasis using meteorological factors in eastern Fars province, Iran:
a SARIMA analysis. Trop. Med. Int. Health 23, 860–869 (2018).
34. Cong, J., Ren, M., Xie, S. & Wang, P. Predicting seasonal influenza based on SARIMA model, in Mainland China from 2005 to
2018. Int. J. Environ. Res. Public Health 16, 4760 (2019).
35. Jayaraj, V. J., Avoi, R., Gopalakrishnan, N., Raja, D. B. & Umasa, Y. Developing a dengue prediction model based on climate in
Tawau, Malaysia. Acta Trop. 197, 105055 (2019).
36. Jiang, K., Fujii, F. & Shiinoki, T. Prediction of lung tumor motion using nonlinear autoregressive model with exogenous input.
Phys. Med. Biol. 64, 2102 (2019).
37. Xie, C. et al. Trend analysis and forecast of daily reported incidence of hand, foot and mouth disease in Hubei, China by Prophet
model. Sci. Rep. 11, 1445 (2021).
38. Thiruchelvam, L., Dass, S. C., Asirvadam, V. S., Daud, H. & Gill, B. S. Determine neighboring region spatial effect on dengue cases
using ensemble ARIMA models. Sci. Rep. 11, 5873 (2021).
39. Fabio, P. et al. Nonlinear autoregressive neural network models for prediction of transformer oil-dissolved gas concentrations.
Energies 11, 1691 (2018).
40. Ibrahim, M. et al. Nonlinear autoregressive neural network in an energy management strategy for battery/ultra-capacitor hybrid
electrical vehicles. Electr. Power Syst. Res. 36, 262–269 (2016).
41. Benrhmach, G. et al. Nonlinear autoregressive neural network and extended Kalman filters for prediction of financial time series.
J. Appl. Math. 2020, 1–6 (2020).
Scientific Reports | (2021) 11:11513 | https://doi.org/10.1038/s41598-021-91176-5 9
Vol.:(0123456789)www.nature.com/scientificreports/
42. Dong, S. B., Jiang, H. & Wang, L. P. Progress in research and practice of brucellosis surveillance in China. Zhonghua Liu Xing Bing
Xue Za Zhi 40, 870–874 (2019).
43. Wang, Y. et al. Temporal trends analysis of tuberculosis morbidity in mainland China from 1997 to 2025 using a new SARIMA-
NARNNX hybrid model. BMJ Open 9, e024409 (2019).
44. Zheng, Y., Zhang, X., Wang, X., Wang, K. & Cui, Y. Predictive study of tuberculosis incidence by time series method and Elman
neural network in Kashgar, China. BMJ Open 11, e041040 (2021).
45. Wang, Y. et al. Temporal trends analysis of human brucellosis incidence in mainland China from 2004 to 2018. Sci. Rep. 26, 15901
(2018).
46. Karagiannis, I. et al. Outbreak investigation of brucellosis in Tassos, Greece, 2008. Euro Surveill. 17, 13–16 (2012).
47. Namasudra, S., Dhamodharavadhani, S. & Rathipriya, R. Nonlinear neural network based forecasting model for predicting COVID-
19 cases. Neural Process Lett. 1, 1–21 (2021).
Acknowledgements
This work was supported by National Natural Science Foundation of China (Grant Nos. 72064036, 82060609)
and Program for Tianshan Innovative Research Team of Xinjiang Uygur Autonomous Region, China (Grant
Nos. 2020D14020), and Tianshan Youth Project of Xinjiang Uygur Autonomous Region, China (Grant No.
2020Q020), and State Key Laboratory of Pathogenesis, Prevention and Treatment of High Incidence Diseases
in Central Asia (SKL-HIDCA-2020-9).
Author contributions
X.L. and J.W. supervised the study. Y.Z., X.L., J.W. and K.W. designed the study. L.Z. and Y.Z. collected and
organized the data. Y.Z. and C.W. analyzed the data. Y.Z. and K.W. interpreted the results. Y.Z. wrote the first
draft. X.L., J.W., L.Z., K.W., C.W., and G.G. reviewed and edited this manuscript. All authors contributed to the
final draft and approved the submitted version.
Competing interests
The authors declare no competing interests.
Additional information
Correspondence and requests for materials should be addressed to Y.Z., X.Z. or J.W.
Reprints and permissions information is available at www.nature.com/reprints.
Publisher’s note Springer Nature remains neutral with regard to jurisdictional claims in published maps and
institutional affiliations.
Open Access This article is licensed under a Creative Commons Attribution 4.0 International
License, which permits use, sharing, adaptation, distribution and reproduction in any medium or
format, as long as you give appropriate credit to the original author(s) and the source, provide a link to the
Creative Commons licence, and indicate if changes were made. The images or other third party material in this
article are included in the article’s Creative Commons licence, unless indicated otherwise in a credit line to the
material. If material is not included in the article’s Creative Commons licence and your intended use is not
permitted by statutory regulation or exceeds the permitted use, you will need to obtain permission directly from
the copyright holder. To view a copy of this licence, visit http://creativecommons.org/licenses/by/4.0/.
© The Author(s) 2021
Scientific Reports | (2021) 11:11513 | https://doi.org/10.1038/s41598-021-91176-5 10
Vol:.(1234567890)You can also read