April 12, 2017 - San Joaquin Valley Air Pollution Control District
←
→
Page content transcription
If your browser does not render page correctly, please read the page content below
April 12, 2017
• District preparing attainment strategy that addresses multiple
  PM2.5 standards under the federal Clean Air Act
     – 1997 PM2.5 Standard (24-hour 65 μg/m³ and annual 15 μg/m³)
     – 2006 PM2.5 Standard (24-hour 35 μg/m³)
     – 2012 PM2.5 Standard (annual 12 μg/m³)
• 2006 PM2.5 Standard – Attainment Deadline 2019
• 2012 PM2.5 Standard – Attainment Deadline 2021
• District and ARB agree that integrated ozone/PM2.5 strategy must
  be pursued to address latest federal standards
     – NOx emission reductions contribute to attainment of both PM2.5 and Ozone
     – Ensure that resources invested to attain PM2.5 standards also advance
       attainment of new 2015 Ozone Standard
     – Strategy should focus on NOx emission reductions while also leaving no stone
       unturned for direct PM2.5 emission reductions
• Meeting new standards requires enormous reductions in emissions,
  particularly from mobile sources that make up 85% of Valley’s NOx
  emissions

 2
• Three PM2.5 plans due between now and Fall 2017
     – 5% Plan due Dec 2016 for 1997 PM2.5 Standard (EPA inaction)
     – Serious plan due Aug 2017 for 2006 PM2.5 Standard
     – Moderate plan due Oct 2016 for 2012 PM2.5 Standard (submitted to
       ARB Sep 2016)
• District remains committed to leaving no stone unturned to
  find additional reductions from sources under our jurisdiction
• Work with ARB to ensure that State provides all possible
  mobile source control strategies that result in additional
  reductions in emissions
• District will not ask for attainment deadline extension or bump
  up in classification with delayed attainment unless finding is
  made by District and ARB that all available and reasonable
  mobile and stationary control measures are not adequate to
  achieve attainment by the prescribed deadlines
 3
• District’s public process provides multiple opportunities for
  public and stakeholders to provide comments, ask
  questions, and request additional information
    – Conduct public workshops
    – Hold multiple Public Advisory Workgroup meetings
    – Provide monthly updates at public meetings of the District Governing
      Board, Citizens Advisory Committee, and Environmental Justice
      Advisory Group
• Public Workshops
    – December 1, 2016 - ARB workshop
    – December 7, 2016 - District Scoping Public Workshop
    – March 9, 2016 - District Public Workshop
• Public Advisory Workgroup Meetings
    –   January 11, 2017 - Air Quality Modeling
    –   January 25, 2017 - ARB Mobile Source Measures
    –   February 9, 2017 - District measures
    –   April 12, 2017 - Update on Air Quality Modeling and Measures

4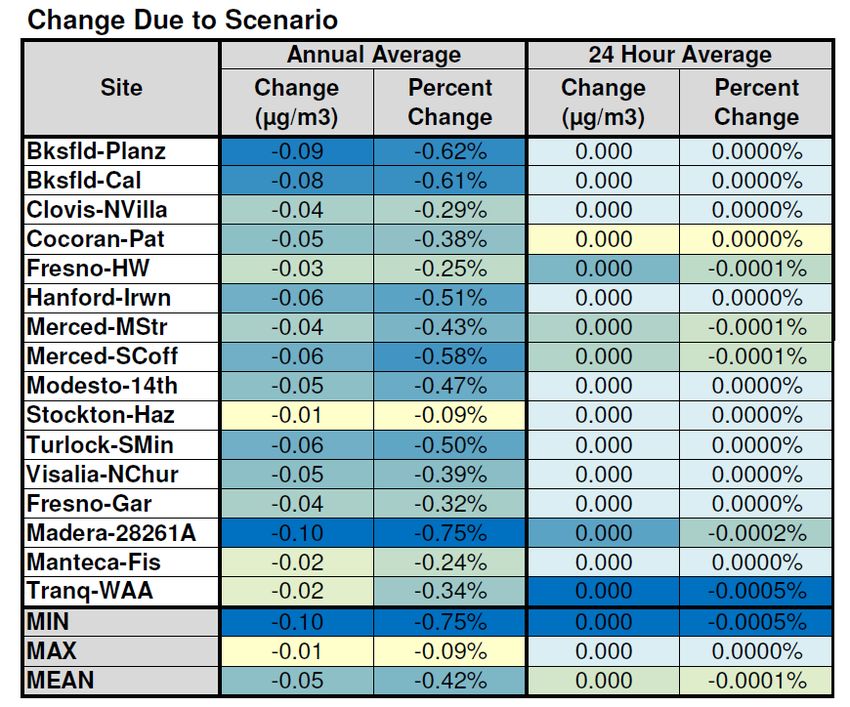
•   Modeling based on foundation of emissions
    inventories
    –   Best available estimates of the amount of pollutants
        and precursors being emitted from each source type
    –   Future-year inventories account for both growth and
        control
    –   Inventories continuously improved
•   Plan’s inventory is a snapshot reflecting best
    information at the time for use in modeling &
    control measures evaluation
•   District coordinates closely with ARB to ensure
    accuracy

5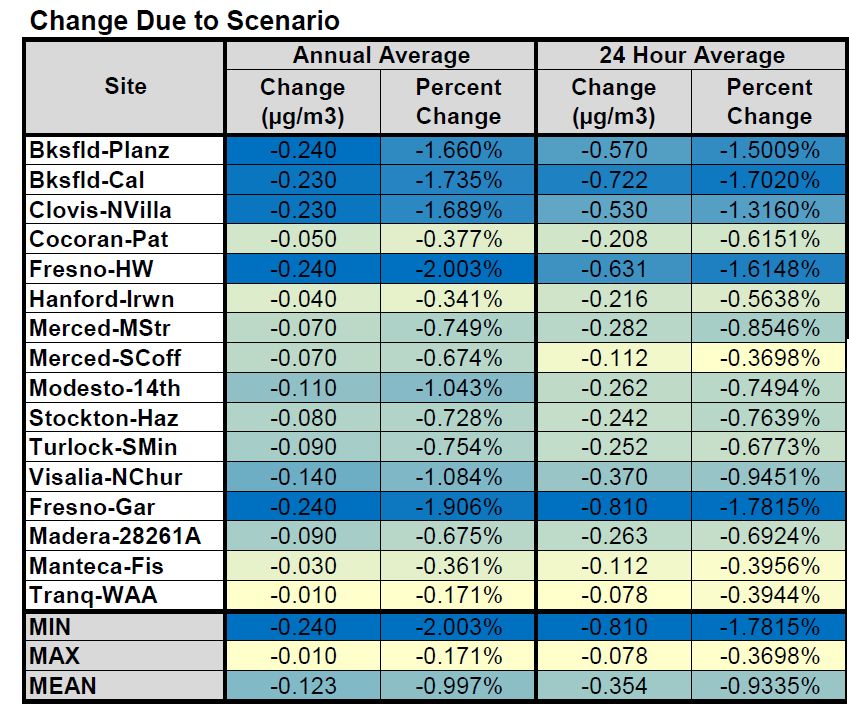
• Modeling necessary to project future air quality
under current control strategy, and under
proposed control strategy for attainment of air
quality standards
• Modeling informs the attainment planning
process on what emissions reductions are
needed to attain an air quality standard
– Provides a target for needed emissions reductions
– Places a focus on which emissions sources could be
targeted for further emissions reductions
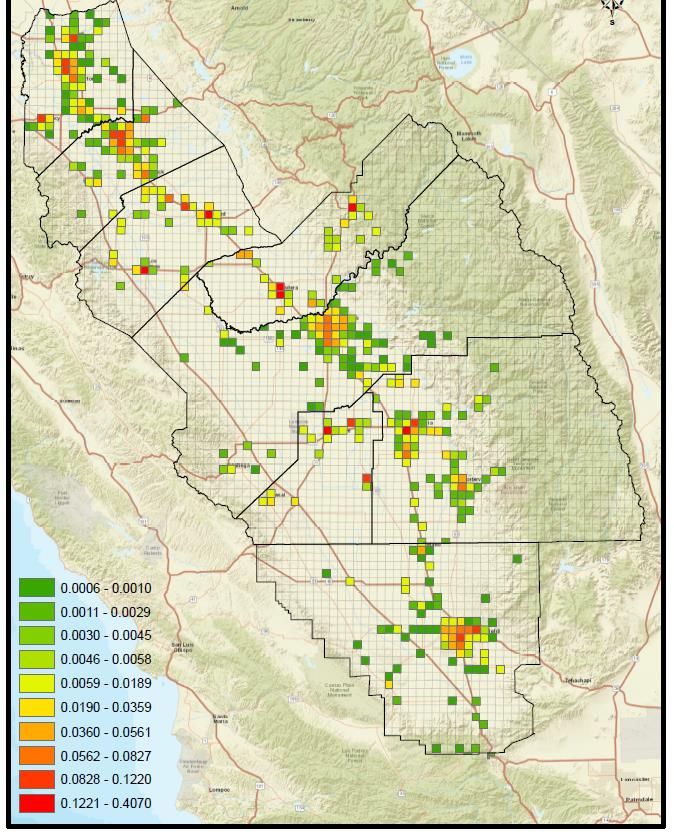
6• Air quality modeling uses highly complex computer
programs, sophisticated computer hardware, and large
databases to predict ambient pollution concentrations given
future emission inventory and meteorological scenarios
• These models simulate air quality concentrations in the
Valley in a “computerized laboratory” that brings together:
– Science of emissions generation through spatial/temporal gridding
– Dynamics of meteorological transport
– Atmospheric photochemistry
• Air quality modeling fundamental to understanding the
Valley’s complex air quality problems
• Many inputs and algorithms in SJV modeling derived from
San Joaquin Valleywide Air Pollution Study Agency
research (CRPAQS, CCOS)
7• Study Agency dedicated resources and effort to further develop
understanding of PM2.5 in Valley
– Over $50 million invested
– Technical projects began in 1993 and continued through 2014
• California Region Particulate Air Quality Study (CRPAQS)
occurred from December 1999 through February 2001
– Study Agency provided $23.5 million for field campaign and research
– Large regional PM study across Valley and surrounding regions
• CRPAQS study accomplishments:
– Improved understanding of PM emissions, composition, and the dynamic
atmospheric processes surrounding them
– Established a strong scientific foundation for informed decision making
– Developed methods to identify the most efficient and cost-effective emission
control strategies to achieve the PM10 and PM2.5 standards in Central
California
8• Resulting dataset supports future modeling work and
attainment plan strategy development
– Studied by researchers around the world
– Hundreds of professional papers published based on analysis of
resulting CRPAQS data
• Understanding of PM2.5 developed through CRPAQS used
in modeling assumptions for past Valley attainment plan
development, including the current development of the
2017 PM2.5 Plan
• CRPAQS research will continue to inform PM planning for
the Valley in the future, along with more recent field
campaigns:
– CalNex (2010) – NOAA and ARB
– DISCOVER-AQ (2013) – NASA
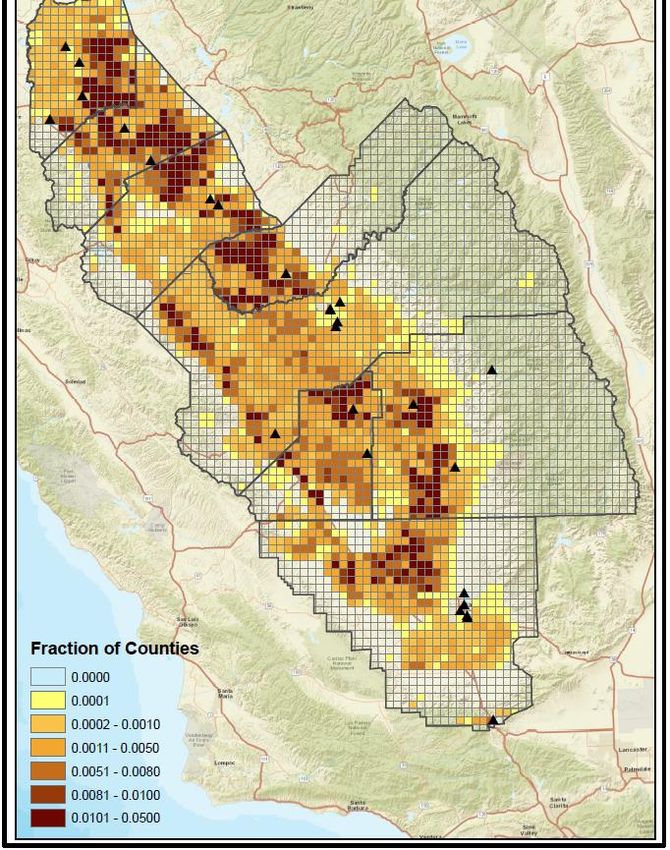
9• PM2.5 formation in the Valley is highly complex
• Direct PM2.5, NOx, and SOx are primary contributors to
the Valley’s PM2.5 levels
– NOx emissions primarily from mobile sources (85% of emissions)
– Reductions in directly emitted PM2.5 emissions from various
sources do not provide equal benefit in reducing PM2.5
concentrations at the Valley’s design value monitoring stations
– Neighborhood-level direct PM2.5 emissions contribute to PM2.5
levels and have adverse health impacts
• Modeling and studies have demonstrated that ammonia
reductions do not achieve significant PM2.5 benefits
– NOx and directly emitted PM2.5 emissions reductions much more
effective in reducing PM2.5 concentrations
– EPA recently proposed new guidance on November 17, 2016
outlining requirements for evaluating precursor significance
1011
12
• Organic Matter: also called combustion carbon or
   organic carbon (ex: residential wood, agricultural
   burning, cooking, direct tailpipe)
 • Elemental Carbon: also called soot or black
   carbon; incomplete combustion (ex: diesel
   engines)
 • Geologic: road dust and soil dust
 • Trace metals: brake wear, fireworks, etc.
 • Ammonium Nitrate: reaction of ammonia and
   nitric acid
 • Ammonium Sulfate: reaction of ammonia and
   sulfuric acid

13
Annual Average                        Average of Top 10% Days

                                                                    Crustal , 6%
                                Crustal , 15%                                      EC, 4%

Ammonium                                  EC, 5%
Nitrate, 38%
                                                                                               OM, 21%

                                                   Ammonium
                                                   Nitrate, 61%
                                        OM, 29%                                             Ammonium
                                                                                            Sulfate, 8%

               Ammonium
               Sulfate, 13%

  14
Annual Average Average of Top 10% Days
Crustal , 8%
Crustal , 2%
EC, 6%
EC, 7%
Ammonium
Nitrate, 40%
OM, 33%
Ammonium
Nitrate, 55%
OM, 34%
Ammonium
Sulfate, 4%
Ammonium
Sulfate, 11%
15Annual Average Average of Top 10% Days
Crustal , 7%
Crustal , 2%
EC, 6%
EC, 6%
Ammonium
Nitrate, 41%
OM, 32%
Ammonium
Nitrate, 55%
OM, 33%
Ammonium
Ammonium
Sulfate, 5 %
Sulfate, 13%
1617
• District working closely with ARB to continue
  sophisticated air quality modeling effort and
  ensure modeling accounts for the following
  characteristics:
     – Location of emissions
     – Seasonality and temporal patterns of emissions
     – Particulate matter speciation
     – Current control programs that include episodic
       curtailment based on meteorological conditions
     – Air quality changes at peak sites due to
       reductions from sources in remote locations

18
• District has conducted additional modeling
analyses to quantify the actual PM2.5 benefits
achieved by direct PM2.5 emissions reductions
from potential ambitious measures
– Replacement of all almond harvesters in Valley with
latest low-emitting harvester technologies
– Installation of PM control technology on all large under-
fired charbroilers installed within last 10-15 years
– Enhancement of Conservation Management Practices
for ag operations to reduce directly emitted PM
– Dust from unpaved roads and ag lands (non-pasture)
– Replacement of 23,628 older high emitting residential
wood-burning devices with cleaner devices
19• Modeling the effectiveness of direct PM2.5 control measures assists in estimating the needed NOx reductions to attain the federal PM2.5 standards (“NOx Carrying Capacity”) • District’s modeling analyses indicate that direct PM2.5 reductions from potential ambitious measures do not provide proportional reductions in PM2.5 concentrations at peak Valley sites (most measures provide minimal benefit) • Significant further reductions in NOx are needed to reach attainment by prescribed deadlines 20
21
22
23
24
25
26
• Based on proposed control strategy for direct
  PM2.5, and considering the effect among all
  PM2.5 air monitoring sites throughout the Valley:
     – 24-hour average PM2.5 design value is expected to be
       reduced by 0.73 to 1.53 µg/m3
     – Annual average PM2.5 design value is expected to be
       reduced by 0.29 to 0.64 µg/m3
• Modeled PM2.5 reductions still fall significantly
  short of attaining the PM2.5 standards of 35
  µg/m3 (24-hour) and 12 µg/m3 (annual)

27
• At beginning of planning process, initial estimates
indicated that, in addition to significant reductions in
directly emitted PM2.5 emissions, another 140
tons/day of reductions in NOx necessary by 2019
– ARB’s initial NOx projections assumed 25% cut in direct
PM2.5 concentrations (organic matter and dust) at peak sites
irrespective of specific measures
• More recent District modeling indicates that needed
NOx reductions might be even greater
– District working with ARB to review modeling results and
continue to refine and enhance modeling
28Additional Emissions Reductions Required for Attainment After Direct
PM2.5 Reductions (2019 Serious Deadline for 2006 24-hr PM2.5 Std)
325
300
Stationary and Area Sources
275
Other Off-Road, including Trains
250
NOx Emissions Inventory (tpd)
Off-Road Equipment
225
Farm Equipment
200 Stationary and
Area Sources
175
Passenger Cars Other Off-Road, including Trains
150 Off-Road Equipment
125 Farm Equipment
Mobile
100 Sources Passenger Cars
75 Heavy Duty Trucks
Heavy Duty Trucks
50
NOx Attainment
Target
25
0
29
2013 2019Additional Emissions Reductions Required for Attainment After Direct
PM2.5 Reductions (2025 Serious Deadline for 2012 Annual PM2.5 Std)
325
300
Stationary and Area Sources
275
Other Off-Road, including Trains
250
Off-Road Equipment
NOx Emissions Inventory (tpd)
225
Farm Equipment
200
175
Passenger Cars
150
Stationary and
125 Area Sources
100 Other Off-Road, including Trains
Mobile Off-Road Equipment
75 Heavy Duty Trucks Sources
Farm Equipment
50 Passenger Cars
25 NOx Attainment
Heavy Duty Trucks Target
0
30
2013 2025• At latest workshop, presented list of ambitious measures
with overly optimistic projections for timing and effectiveness
– Replace all almond harvesters in Valley with latest low-emitting
harvester technologies
– Install PM control technology on larger under-fired charbroilers
installed within last 10-15 years (360 out of 1,800)
– Enhance CMPs for ag operations to reduce directly emitted PM
– Replace 23,628 older high emitting residential wood-burning devices
with cleaner devices
– Electrify 1,053 ag pump engines in areas impacting peak PM2.5
sites where access to electricity is available
– Lower NOx limit for container glass plants
– Lower NOx emissions from various boiler, steam generator, process
heaters > 5 MMBtu/hr
– Lower NOx emissions from various boiler, steam generator, process
heaters 2 to 5 MMBtu/hr
31• Install ultra-low NOx flare technology and require additional flare minimization practices • Lower NOx emissions from various non-agricultural engine categories • Replace 74,912 heavy heavy-duty trucks with upcoming 0.02 g/bhp-hr ultra-low NOx trucks that are 90% cleaner than 2010 trucks recently required by ARB’s Truck and Bus Regulation • Replace 110,000 medium heavy-duty trucks with upcoming 0.02 g/bhp- hr ultra-low NOx trucks that are 90% cleaner than 2010 trucks recently required by ARB’s Truck and Bus Regulation • Replace 102,936 light heavy-duty trucks with upcoming 0.02 g/bhp-hr ultra-low NOx trucks that are 90% cleaner than 2010 trucks recently required by ARB’s Truck and Bus Regulation • Install 2,622 natural gas fueling stations for deployment of 0.02 g/bhp-hr ultra-low NOx heavy duty trucks • Replace 320,000 passenger vehicles with zero-emission vehicles • Replace 76 locomotives with new Tier 4 locomotives 32
• Feasibility and ability to achieve estimated reductions for
  ambitious measures highly unlikely
   – Lack of commercially available technology and necessary fueling
     infrastructure
   – High implementation cost - $51.5 billion
   – Extremely short implementation timeframe before federal deadlines
• Final scope, design and effectiveness of measures to be
  considered subject to comments from Valley businesses
  and residents through public participation process
• Even assuming best case scenario, projected reductions
  short of achieving attainment in 2019, 2021, or 2025

  33
• As evident from sheer scale of fleet and equipment turnover required,
regulations alone not sufficient to achieve reductions in timeframe
necessary under federal law
• Abundantly clear without significant increase in funding for incentive-
based measures, attaining standards not possible
• Reducing emissions from trucks continues to be major priority in any
conceivable strategy for attainment
– Under last truck regulation adopted by state, truck owners purchased or will soon
purchase compliant 2010 model year trucks by 2023
– Asking same truck owners to now purchase newer trucks in 2019 to 2025 timeframe
will require massive incentive investment
• ARB adopted 2016 State SIP Strategy on March 23, 2017
– Does not include any additional measures for the San Joaquin Valley
– ARB committed to return to their Board with specific additional mobile source
measures for the San Joaquin Valley as needed for attainment
• District’s attainment strategy will utilize all available local funding
sources necessary to achieve expeditious reductions
3435
36
37
38
39
40
41
42
• Continue extensive public outreach process
• Continue to work with ARB to conduct in-depth air
  quality modeling that more precisely and accurately
  predicts PM2.5 concentrations at peak monitoring
  sites
• Continue to work with ARB to ensure that the State
  provides all possible mobile source control
  strategies including incentive-based measures that
  result in additional reductions in emissions beyond
  those included in the current control programs
• Continue to evaluate potential emission reduction
  opportunities that the District could pursue
43
• Up-to-date information available at
  www.valleyair.org/2017-pm25-plan
• Receive email updates on the development
  of this plan and future air quality attainment
  plans – email sign up available at
  http://www.valleyair.org/lists/list.htm
• Email comments to
  airqualityplans@valleyair.org

44
You can also read