Profiling Mannheimia haemolytica infection in dairy calves using near infrared spectroscopy (NIRS) and multivariate analysis (MVA)
←
→
Page content transcription
If your browser does not render page correctly, please read the page content below
www.nature.com/scientificreports
OPEN Profiling Mannheimia haemolytica
infection in dairy calves using
near infrared spectroscopy (NIRS)
and multivariate analysis (MVA)
Mariana Santos‑Rivera1, Amelia Woolums2, Merrilee Thoresen2, Ellianna Blair1,
Victoria Jefferson1, Florencia Meyer1 & Carrie K. Vance1*
Bovine respiratory disease (BRD) linked with Mannheimia haemolytica is the principal cause of
pneumonia in cattle. Diagnosis of BRD traditionally relies on visual assessment, which can be
untimely, insensitive, and nonspecific leading to inadequate treatment and further spread of disease.
Near Infrared Spectroscopy (NIRS) is a rapid acquisition vibrational spectroscopy that can profile
changes in biofluids, and when used in combination with multivariate analysis, has potential for
disease diagnosis. This study characterizes the NIR spectral profile of blood plasma from dairy calves
infected with M. haemolytica and validates the spectral biochemistry using standardized clinical and
hematological reference parameters. Blood samples were collected for four days prior to (baseline),
and 23 days after, a controlled intrabronchial challenge. NIR spectral profiles of blood plasma
discriminated and predicted Baseline and Infected states of animal disease progression with accuracy,
sensitivity, and specificity ≥ 90% using PCA–LDA models. These results show that physiological and
biochemical changes occurring in the bloodstream of dairy calves during M. haemolytica infection
are reflected in the NIR spectral profiles, demonstrating the potential of NIRS as a diagnostic and
monitoring tool of BRD over time.
Bovine Respiratory Disease (BRD) is a multi-factorial, multi-pathogen condition causing billion-dollar losses to
the worldwide cattle industry1–4. BRD associated with Mannheimia haemolytica, a gram-negative coccobacillus
that is a constituent of the normal flora of the upper respiratory system of r uminants5, is the principal cause of
pneumonia in cattle5,6. After environmental stress or viral infection, suppression of the host’s defense mechanisms
may occur, and the replication rate of M. haemolytica in the upper respiratory tract increases rapidly, followed by
inhalation and colonization of the lungs1. It is during this growth phase that virulence factors, such as leukotoxin
(LKT), lipopolysaccharide (LPS), bacterial capsule, adhesins, and neuraminidase, are released by M. haemolytica
to elude the innate and adaptive immune responses, allowing it to inhabit the lungs and establish infection6,7.
Once a substantial level of infection occurs, a progression of observable symptoms in the host follows, beginning
with a loss of appetite and is followed by depression, an increase in mucopurulent ocular and nasal secretions,
fever (up to 42 °C), moist coughing, and a rapid, shallow respiratory rate. Clinical exam by auscultation of the
cranioventral lung field typically reveals increased bronchial sounds, crackles, and wheezes. In severe cases,
pleuritis may develop, characterized by an irregular breathing pattern and grunting on expiration5,7,8.
Visual-clinical diagnosis (VCD) of cattle appearance and behavior, after signs of infection are presented, is
currently the standard approach to detecting BRD. Unfortunately, asymptomatic or mildly symptomatic cattle
in the early stages of the disease are not identified or treated appropriately with antibiotics, leading to the spread
of the infection throughout the h erd8,9. The estimated sensitivity of traditional VCD is only 62%, leaving 38%
of cattle with BRD unidentified and u ntreated10. Similarly, with only a 63% specificity rate, uninfected cattle
RD10–12. While failure to identify and treat affected cattle leads to
constitute 37% of all cattle that are treated for B
negative impacts on animal welfare and productivity, unnecessary treatment of healthy cattle leads to financial
loss associated with wasted medication and increases the risk of inducing antibiotic resistance in exchangeable
pathogenic bacteria2,4,5. Transthoracic ultrasound (TU) evaluation is a diagnostic technique used to identify BRD
in young dairy calves on the farm, and in real time13,14. The sensitivity and the specificity of TU were reported
1
Department of Biochemistry, Molecular Biology, Entomology, and Plant Pathology, Mississippi State University,
Starkville, MS 39762, USA. 2College of Veterinary Medicine, Pathobiology and Population Medicine, Mississippi
State University, Starkville, MS 39762, USA. *email: ckv7@msstate.edu
Scientific Reports | (2021) 11:1392 | https://doi.org/10.1038/s41598-021-81032-x 1
Vol.:(0123456789)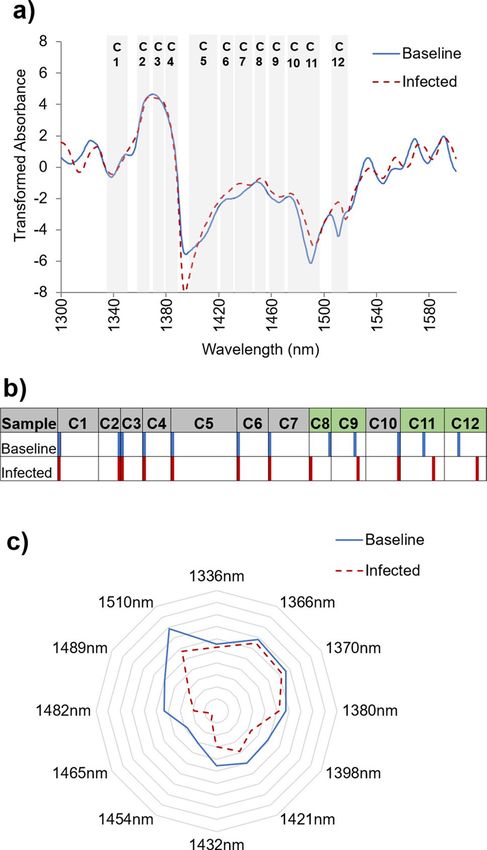
www.nature.com/scientificreports/
Calf ID Age (months) Weight (kg) Baseline samples Infected samples Total
1 6 204 4 3 7
2 6 196 4 11 15
3 6 145 4 3 7
4 5 124 4 3 7
5 5 142 4 3 7
Total samples 20 23 43
Total spectra 200 230 430
Table 1. Number of blood samples contributing to the databases collected before and after the M. haemolytica
challenge. Calf 2 presented mild signs of the infection from Day 1 until Day 19 when his signs aggravated, and
antibiotics were then provided.
to be 89% and 95%, respectively, and were validated by the presence of lung consolidation with ≥ 3 cm of depth
caudal to the heart where active pneumonia can be detected, in addition to referencing against respiratory scores
and haptoglobin levels (≥ 15 mg/dL) in the blood serum15. Haptoglobin is an acute phase response protein and
an early indicator of inflammation and is measured by ELISA (Enzyme-Linked ImmunoSorbant Assay)16–18.
Other laboratory techniques under consideration for early BRD diagnosis include direct detection of the
infectious agent by Polymerase Chain Reaction (PCR), metabolomics profiling using multichannel nuclear mag-
netic resonance (NMR), or volatile compound biomarker analysis by Gas chromatography-mass spectrometry
(GC-MS)8,19–22. However, these approaches require substantial sample purification and preparation and thus
are not only labor-intensive and time-consuming but require specialized facilities for housing sophisticated
instrumentation. Furthermore, the special handling, storage, and transport of biological samples to such exter-
nal laboratories increase the risk of contamination and degradation. Due to the remoteness of most farms, such
analytical methodologies are not feasible for in-field or real-time applications. Since BRD associated with M.
haemolytica poses a serious animal welfare and economic problem, a rapid, portable, and accurate diagnostic
test that can be used under field conditions is needed to correctly identify cattle that may be asymptomatic or in
the early stages of respiratory infection and thus facilitate proper treatment to mitigate disease spread.
Near-Infrared Spectroscopy (NIRS) employs photon energy (hν) in the wavelength range 750–2500 nm to
excite vibrational modes of organic c ompounds23 and, depending on the application, requires minimal sample
preparation. Historically, NIRS has been used in agriculture to quantify nutrient composition for crops and ani-
mal diets and in quality control across the food i ndudustry24. The speed, accuracy, and the new advancements
in portable and handheld NIR spectrometers have elevated this analytical technique to applications in the phar-
maceutical and medical i ndustries25–27. NIRS, combined with chemometrics based multivariate analysis (MVA)28
and concepts developed in the emerging field of Aquaphotomics, may be able to identify and discriminate the
biochemical profile of blood plasma associated with M. haemolytica infection in dairy calves. Aquaphotomics
is a complementary subfield of NIRS focused on water bonding modes and development of spectral profiles
for defined aqueous systems, with increasing applications for the analysis of biological fluids, such as blood
plasma, serum, urine, and m ilk29–32. In biological systems such as blood plasma, although water is the solvent,
its microspectrum is sensitive to changes in solute c omposition31. Besides, the strong NIRS absorbance of OH
bonds in water is known to enhance the signal from other molecules in the s olution33. To this point, in human
blood plasma, NIRS has been used to successfully profile Human Immunodeficiency Virus Type-1 (HIV-1)
infection34,35, Alzheimer’s disease36–38, and lactate content39. In ruminants, blood plasma has been evaluated
using NIRS for early pregnancy diagnosis of s heep40.
Infectious agent challenge studies offer controlled, standardized conditions in order to follow infection pro-
gress and enabling direct comparison across disease stages41. The advantage of a clinical, hematological, and
biochemical profile obtained through a controlled challenge that differentiates diseased and healthy individuals
would represent a significant achievement in the evaluation and management of BRD. Thus, this study aims to
identify and discriminate the clinical signs, blood parameters, and the NIRS spectra of blood plasma obtained
from a controlled bacterial challenge, in order to profile responses of dairy calves to M. haemolytica infection
using multivariate analysis. Our long-term goal is to create a diagnostic strategy for the detection and treatment
of animals in the early stages of BRD, thereby contributing to the sustainability of the food supply chain.
Materials and methods
Bacteria preparation. In preparation for the controlled bacterial challenge, Mannheimia haemolytica iso-
late D153 was streaked onto BD Brain Heart Infusion (BHI) agar (Bacto 237,500) and incubated overnight at
37 °C. A single colony was utilized to inoculate a 5 mL BHI broth (Difco 241,830) starter culture, which was
maintained overnight in a shaker incubator at 200 rpm at 37 °C, diluted 1:100 and incubated again overnight.
On the day of the challenge, the culture was again diluted 1:100, and incubated at 200 rpm and 37 °C until
Abs600 = 1.0, at which point bacteria were pelleted at 10,000 rpm for 10 min at 4 °C and then resuspended to
a final concentration of 1.0 × 10⁹ colony-forming units cfu/30 mL in 0.9% saline. The challenge inoculum was
administered at 1.0 × 10⁹ cfu for every 91 kg of calf body weight.
Animals and M. haemolytica challenge. Five non-vaccinated and immunologically mature Holstein
steers were housed at Mississippi State University (MSU) for the M. haemolytica challenge (Table 1). The animal
Scientific Reports | (2021) 11:1392 | https://doi.org/10.1038/s41598-021-81032-x 2
Vol:.(1234567890)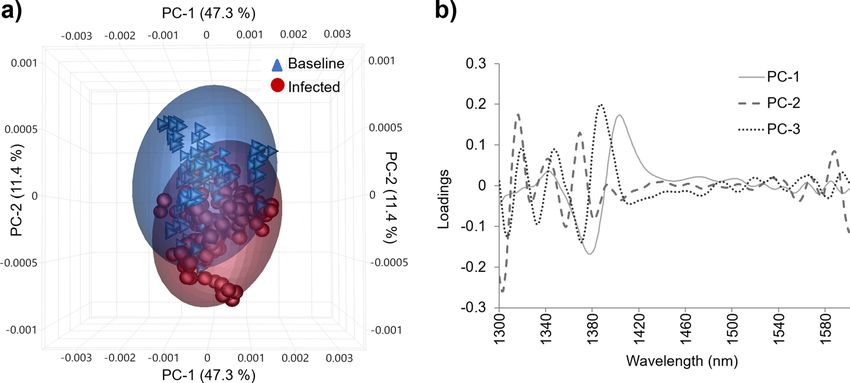
www.nature.com/scientificreports/
experiments were carried out with the approval of the MSU-Institutional Animal Care and Use Committee and
all methods were performed in accordance with MSU-IACUC guidelines and regulations (IACUC-19–037).
The bacterial challenge was given via bronchoalveolar lavage (BAL) catheter. Briefly, each calf was physically
restrained in a chute, and a halter and lead were used to position the calf ’s head straight up. Five mL of 2%
lidocaine was used as a local anesthetic and was squirted into one nostril, and the BAL tube was introduced
through this nostril and gently advanced into the trachea until the end of the catheter wedged into a bronchus.
The appropriate volume of challenge inoculum, based on body weight, was administered through the BAL cath-
eter, followed immediately by 60 mL of sterile 0.9% saline and 120 mL of air. Following the challenge procedure,
a sub-sample of the challenge inoculum was used to prepare a quantitative culture assay on BHI agar and was
checked at 24–48 h, and cfu were counted at 96–120 h. VCD was performed by an experienced veterinarian, and
Complete Blood Counts (CBC) were assessed pre- and post-challenge before blood sample collection during
four baseline days, 11 days immediately after challenge, and then every other day until 23 days post-infection.
Blood collection. A total of 18 blood samples were collected for each calf during the 23 days of the study
(n = 90). Blood samples were collected through jugular venipuncture into two commercial blood collection tubes
containing the anticoagulant Ethylenediaminetetraacetic acid (EDTA) and immediately placed on ice. One tube
was centrifuged at 4000 rpm for 20 min for plasma separation and stored in duplicates of 1 mL at − 80 °C until
NIRS analysis. The second tube was used for CBC analysis using a veterinary hematology analyzer for hema-
tocrit (HCT), hemoglobin (HGB), mean corpuscular hemoglobin (MCH), mean corpuscular hemoglobin con-
centration (MCHC), mean corpuscular volume (MCV), red blood cell count (RBC), red cell distribution width
(RDW), white blood cell count (WBC), and platelets (PTLs). In addition, a microscopic differential count of
nucleated cells was carried out to test the variability between neutrophils (polymorphonuclears, PMNs), eosino-
phils (polymorphonuclear eosinophils, PMEs), basophils (polymorphonuclear basophils, PMBs), monocytes
(MOs), and lymphocytes (LYs).
Statistical analysis for clinical and hematological profiles. The VCD included rectal temperature
(TEMP) recorded with a digital thermometer, heart rate (HR), respiratory rate (RR), and assessment of overall
airway health (the type of cough, secretions) conducted by an experienced veterinarian using a stethoscope.
Using VCD and the antibiotic therapy provided when the clinical signs aggravated as the reference parameters,
blood plasma samples (n = 90) were categorized as Baseline (n = 20), Infected (n = 23), Infected and Treated with
antibiotics (n = 21), and Recovered (n = 26); only the first two categories (Baseline and Infected) were selected
for the application of the statistical analyses (Table 1) to avoid the interference of the antibiotic effect in the bio-
chemical profile. VCD and CBC information was analyzed using univariate statistics to obtain the Mean and the
standard deviation (SD). Significance in parameter response was tested between the two categories Baseline and
Infected, using ANOVA and a pairwise mean comparison applying Student’s t-test with alpha = 0.05 (JMP 14.0
SAS Institute Inc., NC. USA). In addition, Principal Component Analysis (PCA) was applied using full cross-
validation, and algorithm-SVD (Singular Value Decomposition) in order to determine the influence of clinical
signs and CBC values in the baseline and infected periods (Unscrambler X v. 10.5 software CAMO Analytics,
Oslo, Norway).
NIR spectral signature collection. Transmittance NIRS spectra (n = 430) were collected using a portable
ASD FieldSpec 3 + IndicoPro (Malvern Panalytical, ASD Analytical Spectral Devices Inc. Boulder, CO. USA).
Samples were thawed over ice for 15 min and warmed between hands for approximately 1 min before NIR
spectra collection. Plasma samples (300 µl) were analyzed in a 1.00 mm quartz cuvette mounted in an ASD-fibre
optic cuvette adapter. Each NIR spectrum was collected across the range 350–2500 nm (interval = 1.4 nm for the
region 350–1000 nm and 2.0 nm for the region 1000–2500 nm; 50 scans; 34 ms integration). Prior to plasma
spectra collection, a reference spectrum was captured from an empty cuvette. Ten independent spectral signa-
tures were collected per sample, repacking the cuvette with plasma between each replicate.
Multivariate analysis (MVA). The chemometrics based MVA was carried out in Unscrambler X v.10.5
and performed on the first overtone region of the near-infrared spectrum in the vibrational combination band
between 1300 and 1600 nm. The mathematical pre-treatments of Linear Baseline Correction, Standard Nor-
mal Variate (SNV) with de-trending (polynomial order: 2), and a 2nd derivative (symmetric Savitzky–Golay
smoothing, points = 12) were applied to all the databases described next. A balanced database (n = 300) was
created by randomly selecting 30 spectral signatures per calf and per each category (Baseline or Infected), to
ensure the homogeneity of variance and weight of the datasets by controlling for the imbalance and diversity of
the total number of blood samples collected (Table 1). This database (DB0) included spectra from all five calves
and was used to perform the PCA and the Aquaphotomic analyses. To test for mathematical pre-processing and
modeling bias, and against the null hypothesis (no biological signature can be differentiated between samples
from these two classes) in the discriminant analysis, five datasets were created by stratified random sampling
and analyzed in a leave-one–animal-out approach, Table 2. Specifically, spectra obtained from samples from
four calves were sorted into an 80/20% distribution to form the calibration and internal validation sets; plasma
spectra from the remaining calf were used as the external validation set.
Principal component analysis. PCA was applied to the DB0 database and to the calibration sets created
for the discriminant analysis, it was completed as a first step to observe spectral features from both baseline and
infected plasma samples to determine the dataset factorizations and scores distributions, identify dominant
peaks in the loadings and outliers using the Hotelling’s T 2 influence plot. PCA on the mean-centered matrix
Scientific Reports | (2021) 11:1392 | https://doi.org/10.1038/s41598-021-81032-x 3
Vol.:(0123456789)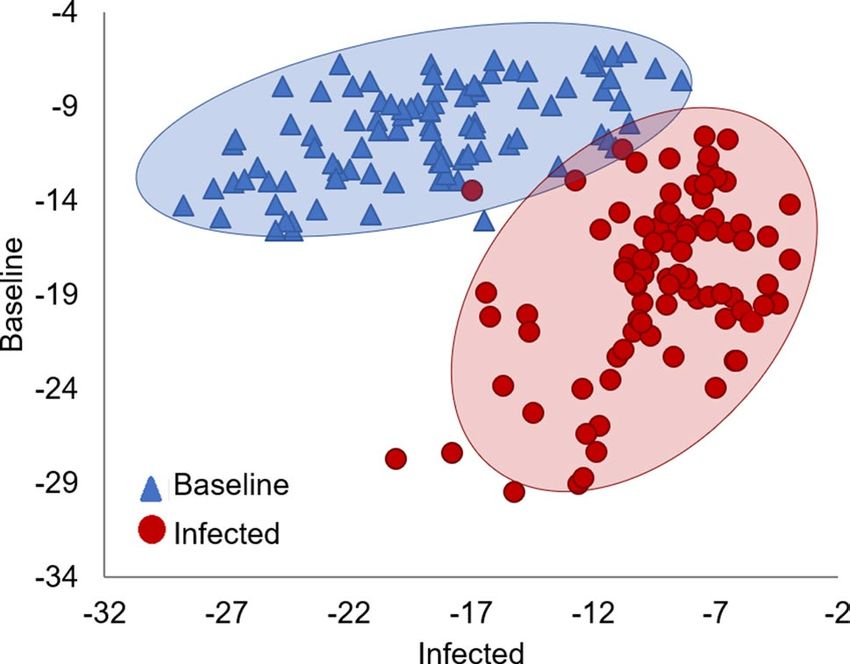
www.nature.com/scientificreports/
DB0 DB1 DB2 DB3 DB4 DB5
Calf ID B I Process B I B I B I B I B I
CAL 24 24 24 24 24 24 24 24
1 30 30 External validation
VAL 6 6 6 6 6 6 6 6
CAL 24 24 24 24 24 24 24 24
2 30 30 External validation
VAL 6 6 6 6 6 6 6 6
CAL 24 24 24 24 24 24 24 24
3 30 30 External validation
VAL 6 6 6 6 6 6 6 6
CAL 24 24 24 24 24 24 24 24
4 30 30 External validation
VAL 6 6 6 6 6 6 6 6
CAL 24 24 24 24 24 24 24 24
5 30 30 External validation
VAL 6 6 6 6 6 6 6 6
Total CAL 192 192 192 192 192
Total VAL 48 48 48 48 48
Total spectra 240 240 240 240 240
External validation 40 30 40 110 40 30 40 30 40 30
Table 2. Balanced databases distribution of spectra collected before and after M. haemolytica challenge. Each
database has spectra from one animal removed for external validation. DB, Database; B, Baseline; I, Infected;
CAL, Calibration; VAL, Internal Validation.
was obtained using full random cross-validation and algorithm-SVD according to Eq. (1) where T = Scores,
P = Loadings, E = Residual, U = First left singular values, D = Singular values, and V = First right singular v alues42.
X = TP T + E = (UD)V T + E (1)
Aquaphotomics. Aquaphotomics was applied as a complementary spectral analysis to distinguish the bio-
chemical profile of blood plasma collected before and after the M. haemolytica challenge. Water microstructure
is represented by 12 spectral bands in the first overtone of the OH stretching region between 1300 and 1600 nm;
these Water Matrix Coordinates (WAMACS) were used to generate barcodes and aquagrams to distinguish
NIR spectra of plasma from baseline and infected stages29,30. To generate the barcodes, which represent wave-
length shifts, the mean spectral information from sterile distilled water was subtracted from the mean spectrum
for each category (Baseline or Infected) obtained from the transformed balanced database DB0. Aquagrams
emphasize changes in the magnitude of peaks and were created by comparing the mean normalized (SNV only)
water absorbance spectral patterns (WASPs) of the blood plasma from baseline and infected stages of the M.
haemolytica challenge.
Linear discriminant analysis. Linear Discriminant Analysis (LDA) was used in the transformed spec-
tra containing the water information (1300–1600 nm) from the balanced databases (DB1–DB5). Before the
application of LDA for spectra classification between Baseline and Infected categories, the dimensionality of
each spectral database was reduced using PCA to overcome the constraint of requiring more objects (samples)
than features (scores or PCs). PCs or factors capturing ≥ 99% of the variance in the calibration datasets were
selected to build the PCA–LDA model for each balanced d atabase28,43. The subsequent LDA based on Bayes’
formula, identifies similar spectral features for intra-class groupings and differential spectral features to separate
the classes of blood plasma collected before and after the M. haemolytica challenge44. The PCA–LDA for the
five prediction models created from databases DB1-5 is reported from the confusion matrix as a percent (%) to
describe the quality parameters of accuracy, sensitivity, and specificity to evaluate the performance of the clas-
sification method45. The sensitivity test quantifies the PCA–LDA model’s ability to correctly identify the true
positives of M. haemolytica infection46 described by Eq. (2) where TP = True positive, and FN = False negative45.
A sensitivity of 85% detects 85% of animals with the disease (true positives) but classifies 15% of infected animals
as healthy (false negatives). A high sensitivity (≥ 90%) is essential where the prediction model is used to identify
severe but treatable diseases47.
TP
Sensitivity % = × 100 (2)
TP + FN
The specificity of the PCA–LDA model is the ability of the model to correctly identify uninfected subjects, or
ositive45. For example,
the true negatives, and is represented by Eq. (3), where TN = True negative, and FP = False p
a specificity of 85% correctly reports 85% of true negatives, but 15% of uninfected animals will be incorrectly
ositives47.
identified as false p
Scientific Reports | (2021) 11:1392 | https://doi.org/10.1038/s41598-021-81032-x 4
Vol:.(1234567890)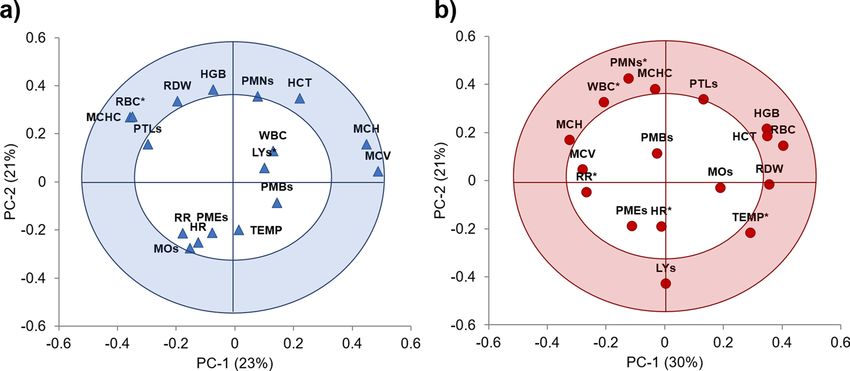
www.nature.com/scientificreports/
Figure 1. Dairy Calves (n = 5) response to M. haemolytica infection across the 23 days of the study. (a) Daily
rectal temperature (°C) per calf. (b) Rectal temperature shown as Mean ± SD. The baseline days are in blue,
infected days in dark red, the days of antibiotic treatment in orange, and the recovered days are in green.
(c) White blood cell count (thousands per cubic milliliter, K/µl) per calf. (d) WBC showed as Mean ± SD. A
characteristic increase 24 h after the challenge (D0, indicated by arrows) can be seen due to the activation of the
innate immunity or nonspecific defense mechanisms against M. haemolytica virulence factors.
TN
Specificity % = × 100 (3)
TN + FP
The prediction equations from the five models were applied to the internal validation and external validation
sets described in Table 2 and evaluated with the same quality parameters. PCA scores plots and PCA–LDA plots
were visualized in JMP 14.0.
Results
Clinical and hematological profile for M. haemolytica infection. In terms of fever response and
rectal temperature, all calves responded similarly before and after bacterial challenge on Day 0 (Fig. 1a). Due to
severe disease on Day 3 post-challenge, four calves (ID 1, 3, 4, and 5) were treated over five days with a third-
generation cephalosporin antibiotic with broad-spectrum activity (Ceftiofur), which caused the recovery of the
calves and the change in the trends for TEMP and WBC (Fig. 1b). In the case of calf 2, mild signs of the infection
were present from Day 1 until Day 19 when his signs aggravated, and antibiotics were provided. Only two calves,
2 and 4, exhibited a variable increasing pattern in WBC starting on Day 8, while the other three calves 1, 3, and 5
maintained pre-challenge levels of WBC due to the antibiotic therapy (Fig. 1c). When the rectal temperature and
the WBC are averaged across individuals, a noticeable increase can be observed 24 h after the M. haemolytica
challenge, which is characteristic of this particular bacterial infection in cattle (Fig. 1b, d).
The mean and standard deviations from the current variables used to identify M. haemolytica infection in
the VCD and CBC and the bovine reference values for blood p arameters48, are listed in Table 3. When taking
into account only the baseline and infected stages of the disease in the controlled challenge, there was a signifi-
cant (p < 0.05) increase in the rectal temperature, heart rate, respiratory rate, WBC, and the percentage PMNs
Scientific Reports | (2021) 11:1392 | https://doi.org/10.1038/s41598-021-81032-x 5
Vol.:(0123456789)www.nature.com/scientificreports/
Analysis Reference value Baseline Infected
Visual-clinical diagnosis (VCD)
Temperature (°C) TEMP 38.0–39.2 38.7 ± 0.5 39.8 ± 1.5*
Respiratory rate per minute RR 26–50 35.8 ± 9.6 89.9 ± 19.2*
Heart rate per minute HR 48–84 91.2 ± 10.2 101.0 ± 17.7*
Complete blood counts (CBC)
Red blood cell count (M/µl) RBC 5–11 7.8 ± 0.4* 7.3 ± 0.8
Hemoglobin (g/dl) HGB 7.7–15.0 10.3 ± 0.5 9.9 ± 0.9
Hematocrit (%) HCT 25–45 26.6 ± 5.9 27.1 ± 2.2
Platelets (K/µl) PLTs 200–900 790.0 ± 189.4 778.0 ± 197.3
White blood cell count (K/µl) WBC 4–12 6.6 ± 1.4 12.4 ± 5.5*
Neutrophils (%) PMNs 27–72 29.5 ± 6.7 49.6 ± 17.7*
Lymphocytes (%) LYs 22–64 41.7 ± 8.7* 27.7 ± 16.4
Eosinophils (%) PMEs 0–12 1.1 ± 0.9 0.5 ± 0.9
Monocytes (%) MOs 0–10 26.6 ± 9.5 21.5 ± 12.1
Basophils (%) PMBs 0–3 1.3 ± 1.0 1.0 ± 1.5
Table 3. Clinical and hematological values (Mean ± SD) compared to reference for dairy calves challenged
with M. haemolytica. Data were analyzed using Student’s t-test between the groups with an α < 0.05 delineating
significant treatment effects (*). K/µl = thousands per cubic milliliter, M/µl = Millions per microliter, g/
dl = grams per deciliter.
Figure 2. Visual-clinical diagnosis (VCD) and Complete blood counts (CBC) correlation loadings plots from
the principal component analysis (PCA). The variables closest to the outer circle (shaded area) have the most
influence in the variability of the database and are positively or negatively correlated with the disease stage
of the dairy calves (n = 5); the points inside the inner circle are considered to have little or no influence. (a)
Baseline or healthy calves; two PCs explained 44% of the variance, here as expected, the VCD variables and the
white blood cell count (WBC) showed no influence. (b) Infected or challenged calves with M. haemolytica, two
PCs explained 51% of the variation of the database. During this state of the disease the activation of the innate
immunity showed a negative correlation in the rectal temperature (TEMP) and a positive correlation with the
WBC and neutrophils (polymorphonuclears, PMNs).
following the challenge with M. haemolytica. By contrast, RBC and the percentage of lymphocytes decreased
after infection compared to the Baseline category but remained in the range of the reference values.
The PCA correlation plots from VCD and CBC for each category (Baseline or Infected) are shown in Fig. 2.
The first two PCs explained 43.6% and 50.4% of the variance of the VCD and CBC databases for the baseline and
2 influence plot (not shown). Prior to
infected periods, respectively. No outliers were found in the Hotelling’s T
bacterial challenge, the parameters that are positively correlated and have the most influence indicating baseline
levels were RBC, HCT, HGB, MCH, MCHC, RDW, and MCV (Fig. 2a). During the infection period, the activa-
tion of the innate immunity showed a negative correlation in TEMP and the percentage of LYs and a positive
correlation with the WBC and the percentage of PMNs (Fig. 2b).
Scientific Reports | (2021) 11:1392 | https://doi.org/10.1038/s41598-021-81032-x 6
Vol:.(1234567890)www.nature.com/scientificreports/
Figure 3. Principal component analysis (PCA) of the transformed blood plasma NIR spectra (1300–1600 nm)
collected before and after the M. haemolytica challenge using the balanced spectral database DB0 (n = 300). (a)
PCA scores plot for samples from the baseline and infected periods containing the scores from the first three
PCs explaining 66.7% of the total variance. (b) PCA loadings showing the dominant peaks influencing the
trends in the scores plot: PC-1 = 47.3%, PC-2 = 11.4%, PC-3 = 8.0%.
Biochemical NIRS profile for M. haemolytica infection. In general, bovine blood plasma is made
up of 92% water, 3% albumin and globulin, 4% immunoglobulins (α and β), 0.4% coagulants and fibrinogen,
0.5% minerals (sodium, potassium, bicarbonate, chloride, calcium), and 0.07% of lipids related with hormone
content49,50. The mean raw and the transformed NIR spectral signatures from the bovine plasma collected before
and after the M. haemolytica challenge displayed a characteristic and expected spectral water pattern in the
wavelength range from 1300 to 1600 nm (Supplementary Fig. S1 online). This reflects the need for the appli-
cation of Aquaphotomics and chemometric analyses to unveil the biochemical profile of the infection in this
complex biofluid.
The complex chemical differences and similarities in the transformed spectra from bovine blood plasma
between 1300 and 1600 nm where OH, CH, and NH bonds interact with NIR light23 can be observed in the trends
from the three dimensional PCA scores plot (Fig. 3a). Here the first three PCs explained 66.7% of the variation
of the DB0 database. No outliers were found in the Hotelling’s T2 influence plot (not shown), eliminating the
possibility of artificial bias. The PC loadings show the dominant peaks influencing the trends in the scores plot
(Fig. 3b). The first PC loading, PC-1 explained 47.3% of the variance of the database; PC-2 and PC-3 explained
another 11.4% and 8.0% of the variance, respectively.
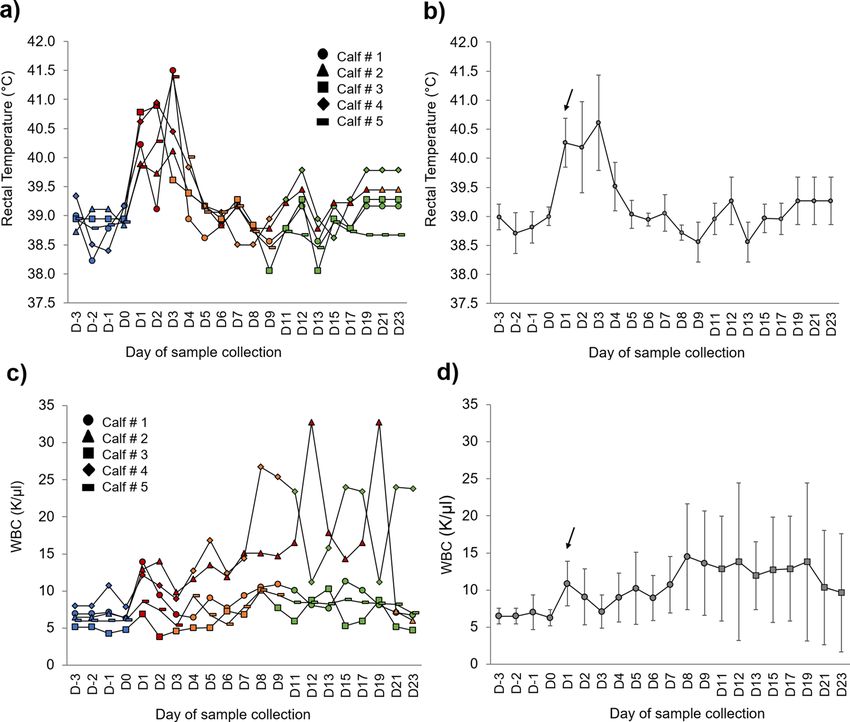
The complementary Aquaphotomic analysis displayed a different spectral pattern for the Baseline and Infected
blood plasma in the wavelength range 1300–1600 nm (Fig. 4a). Barcodes highlight a shift in the WAMACS31
for the baseline and infected blood plasma samples, reflecting changes in the plasma constituents and the water
matrix. In the coordinate C8 (1448–1454 nm), a peak shift to higher frequency can be observed in the infected
blood plasma spectra to 1448 nm in comparison with the baseline peak at 1454 nm, indicating a shift from bulk
water dynamics to an increase in the formation of complex three-dimensional molecular spheres or hydration
shells around solute molecules31,51. Additionally, in the spectra collected from blood plasma collected during
the infected stage, NIR spectral peaks are right-shifted in C9 (1458–1468 nm), C11 (1482–1495 nm), and C12
(1506–1516 nm), more specifically to1466, 1492 and 1516 nm in comparison with spectral peaks at 1465, 1489,
and 1510 nm from the blood plasma collected during the baseline stage; suggesting a shift towards more strongly
bound water and longer-lived water c omplexes52. More highly organized water complexes and limited water
exchange from solvation shells to bulk water occurs as solubility decreases, either in the context of concentration
or reduced polarity of solutes (Fig. 4b).
The aquagram was created with the highest absorbances from the WAMACS in the baseline plasma at 1336,
1366, 1370, 1380, 1398, 1421, 1432, 1454, 1465, 1482, 1489, and 1510 nm (Fig. 4c). Overall, different WASPs can
be observed for the blood plasma collected before and after the M. haemolytica challenge. Higher absorbances at
1366 and 1510 nm for the Infected and Baseline plasma are observed. These spectral absorbance points belong
to the coordinates C2 (1360–1366 nm) and C12 (1370–1376 nm), and represent a higher number of strongly
bound water molecules to non-water constituent molecules in the baseline period, and molecules organized in
water symmetrical and asymmetrical stretching vibrations associated with changes in the solute composition of
the blood plasma during the infection p eriod31.
Classification of the biochemical NIRS profile during M. haemolytica infection. The PCA–LDA
was conducted on the spectra of plasma from both baseline and infected states simultaneously. A total of 18 PCs
explaining 99 ± 0.2% of the variance in the PCA of the calibration sets were selected for the creation of the discri-
minant models using databases DB1 to DB5 (Supplementary Table S1 online). The derived prediction equations
Scientific Reports | (2021) 11:1392 | https://doi.org/10.1038/s41598-021-81032-x 7
Vol.:(0123456789)www.nature.com/scientificreports/
Figure 4. Aquaphotomics. (a) Transformed NIR spectra corresponding to bovine plasma collected before and
after the M. haemolytica challenge. The spectral information from sterile distilled water was removed from
the average spectra. (b) Peak shifts can be observed in the WAMACS barcode in the coordinates C8, C9, C11,
and C12 for the baseline and infected blood plasma. (c) Aquagram displaying the normalized averaged spectra
(SNV only) showing different WASPs. The highest points of absorbance were found at 1366 and 1510 nm for the
Infected and Baseline plasma, respectively.
were then applied to the internal and external validation sets of spectra (Table 4). On average, the calibration of
this supervised pattern recognition approach gave accuracy, sensitivity, and specificity of 98.5 ± 0.9, 97.5 ± 1.2,
and 99.6 ± 0.9%, respectively. These values indicate that only 2.5 ± 1.2% of the infected blood plasma spectra were
classified as false negatives, and 0.4 ± 0.9% of the baseline spectra corresponded to false positives to M. haemo-
lytica infection. All the calibration databases (DB1–DB5) displayed similar trends in the PCA–LDA plot where
two defined groups are observed; in Fig. 5, database DB1, excluding calf 1, is shown as a representation of the five
databases analyzed. In addition, the internal validation set exhibited average values of 94.2 ± 1.7, 91.7 ± 2. 9, and
96.7 ± 1.9% for the accuracy, sensitivity, and specificity, respectively. In this process, 8.3 ± 2. 9% and 3.3 ± 1.9% of
the spectra were classified as false negatives and false positives to the bacteria infection, correspondingly.
Furthermore, the external validation set containing the spectra from the calf excluded during the calibration
process was accurately classified with an average percentage of 83.3 ± 7.5%, a sensitivity of 79.2 ± 21.3%, and a
specificity of 87.5 ± 10.9% when applying the prediction model. This indicates 20.8 ± 21.3% and 12.5 ± 10.9% of
the spectra from the excluded calf to be classified as false negatives and false positives to M. haemolytica infection,
respectively, when VCD is used as the reference method. These results suggest that the biochemical changes in
the bloodstream as a result of the calves’ response to the bacterial infection have the potential to be accurately
detected and classified using NIR spectroscopy.
Scientific Reports | (2021) 11:1392 | https://doi.org/10.1038/s41598-021-81032-x 8
Vol:.(1234567890)www.nature.com/scientificreports/
%PCA–LDA
Database Category and quality Cal 80% Val 20% External validation
Baseline 96/96 24/24 30/40
Infected 94/96 22/24 30/30
DB1 % Accuracy 99.0 95.8 87.5
% Sensitivity 97.9 91.7 100
% Specificity 100 100 75.0
Baseline 96/96 23/24 36/40
Infected 95/96 22/24 69/110
DB2 % Accuracy 99.5 93.8 76.4
% Sensitivity 99.0 91.7 62.7
% Specificity 100 95.8 90.0
Baseline 96/96 23/24 40/40
Infected 92/96 23/24 24/30
DB3 % Accuracy 97.9 95.8 90.0
% Sensitivity 95.8 95.8 80.0
% Specificity 100 95.8 100
Baseline 94/96 23/24 31/40
Infected 93/96 22/24 30/30
DB4 % Accuracy 97.4 93.8 88.8
% Sensitivity 96.9 91.7 100
% Specificity 97.9 95.8 77.5
Baseline 96/96 23/24 38/40
Infected 94/96 21/24 16/30
DB5 % Accuracy 99.0 91.7 74.2
% Sensitivity 97.9 87.5 53.3
% Specificity 100 95.8 95.0
% Accuracy Mean ± SD 98.5 ± 0.9 94.2 ± 1.7 83.4 ± 7.5
% Sensitivity Mean ± SD 97.5 ± 1.2 91.7 ± 2.9 79.2 ± 21.3
% Specificity Mean ± SD 99.6 ± 0.9 96.7 ± 1.9 87.5 ± 10.9
Table 4. PCA–LDA spectra classification and quality parameters for bovine plasma collected before and after
the M. haemolytica challenge.
Figure 5. PCA–LDA plot for the calibration database DB1 excluding calf 1. Baseline = 100%, Infected = 97.9% of
accurately classified spectra from bovine blood plasma collected before and after the M. haemolytica challenge.
Scientific Reports | (2021) 11:1392 | https://doi.org/10.1038/s41598-021-81032-x 9
Vol.:(0123456789)www.nature.com/scientificreports/
Discussion
The trends in the clinical and hematological parameters observed in our controlled challenge are related to the
physiological response to M. haemolytica virulence factors associated with pathogenesis and needed to overcome
the innate and adaptive immune response from the host. Our results are in line with similar profiles documented
in previous studies when calves were challenged with either M. haemolytica alone or after they were exposed to
Bovine Viral Diarrhea Virus Type 1 B8,53,54. After the bacterial challenge, adherence and invasion of the respira-
tory tract cells occurs in response to the bacterial capsule, adhesins, and neuraminidase5. Once the host’s cells
are infected, the LPS complex and other pyrogenic features of M. haemolytica are released, activating the innate
immunity or nonspecific defense mechanisms, triggering the observed fever and an increase in phagocytic
cells (macrophages and neutrophils) after 24 h of the infection8,53. Subsequently, adaptive immunity is affected,
which is reflected by the decrease in lymphocytes due to LKT release by the pathogen. The interaction of LKT
with the CD18 subunit of the β2 integrin receptor of leukocytes forms transmembrane pores causing leakage of
oxygen radicals and other products, such as nitric oxide, lysosomal enzymes, and inflammatory mediators such
as cytokines IL-1β and TNFα, into the surrounding pulmonary parenchyma7. This contributes to cell apopto-
sis and pulmonary necrosis associated with the irregular breathing pattern, grunting on expiration, increased
bronchial sounds, crackles, and wheezes5,7. The differences found in the univariate and multivariate results here
demonstrate physiological and hematological changes occurred in response to the M. haemolytica challenge.
More importantly, these parameters reflect a characteristic physiological response of disease state and provide
the basis of the NIR spectral profiles used to discriminate healthy from infected calves, which will be useful for
future diagnosis and monitoring of infection over time.
The NIR spectral profiles obtained in the chemometrics based MVA and the complementary Aquaphotom-
ics, indicate changes in the biochemical make-up of the bovine blood plasma between the baseline and infected
stages of the M. haemolytica challenge reflecting a calf ’s immune response to the infection through changes in
inflammatory cellular energy metabolism and antimicrobial p athways55. The recruitment of inflammatory cells
results in a shift in their energy demand such that the supply almost exclusively originates from glycolysis, in
order to accomplish the processes of phagocytosis to promote microbial d eath55,56. At the same time, increased
flux through the pentose phosphate pathway (PPP) occurs, generating the reducing equivalent N ADPH55. When
glucose becomes limiting, T-cells utilize alternative energy sources, such as glutamine (critical for nitrogen
metabolism and protein transamination), or fatty acids which feed the tricarboxylic acid cycle (TCA) generat-
ing intermediates such as citrate and the reducing agent NADH for the electron transport chain and aerobic
metabolism56. The NADPH and NADH resulting from the PPP and TCA cycle, respectively, are required to pro-
duce reactive oxygen species (ROS) by NADPH oxidase in the membrane of activated macrophages, which are the
crucial mechanisms for killing phagocytosed bacteria55. Additionally, nitric oxide (NO) and downstream reactive
nitrogen species (RNS) produced by NO synthase in activated macrophages exert microbicidal or microbiostatic
activity against bacteria by using L-arginine imported into the cell for the synthesis of NO as an antimicrobial
product55. The increase of energy substrates, products, and key metabolites from the metabolic shifts occurring
in the host as a response to M. haemolytica infection provide a changing milieu of components contributing to
the biochemical NIR spectral profile. In this way, NIR spectra obtained from the blood plasma collected from
the dairy calves before and after the M. haemolytica challenge differ, thus providing the information needed for
spectra classification representing disease state.
Using NIRS for determining infection from M. haemolytica in dairy calves has a threshold of 90% sensitivity
and specificity within the calibration and validation spectra, which is comparable to other techniques currently
considered for BRD diagnosis. For example, ELISA determination of serum haptoglobin has a sensitivity of 93%
and a specificity of 86% using a cutoff of ≥ 0.81 mg/mL8. Likewise, triplex real-time PCR based on the V3/V4
region of the 16S rRNA gene of three Mycoplasma species (M. bovis, M. bovirhinis, and M. dispar), is reported
to have a diagnostic specificity of 98.2, 99.1, and 100%, respectively, when using bronchoalveolar lavage fluid
(BALF) from infected calves19. Moreover, blood plasma from cattle with or without signs of BRD was evaluated
with NMR for metabolite identification and diagnosis using visual clinical diagnosis as the reference method.
In this case, animals with signs of BRD demonstrated increases in plasma α-glucose chains, hydroxybutyrate,
and phenylalanine, and decreases with tyrosine, glutamine, citrate, and glutamate compared to healthy control
animals. The accuracy, sensitivity, and specificity in this NMR study were 93, 99, and 88% for the calibration and
81, 84, and 74% for the validation process, r espectively20.
Blood plasma spectra containing water information was used for the discriminant analysis (PCA–LDA) of
baseline and infected samples to include the biochemical information of a fluid imbalance that may occur during
the bacterial infection, affecting the blood volume and the blood pressure and consequently, the blood plasma
composition57. Our results for M. haemolytica infection in dairy calves are comparable with previous studies
where human blood plasma was evaluated using NIRS to profile, detect, and classify diseases. In one study, PCA
and soft independent modeling of class analogy (SIMCA) were applied to identify features of NIR spectra of
plasma from patients infected with HIV-1 in comparison with healthy individuals35. Both the PCA scores plot
and the SIMCA Cooman’s plot suggested that HIV-1 infections caused specific blood plasma changes and affect
its Vis–NIR spectra from 600 to 1100 n m35. In other studies, infrared spectroscopy analysis of human blood
plasma has been performed to discriminate mild, moderate, and severe cases of Alzheimer’s disease (AD), in
comparison with normal elderly persons used as a c ontrol36–38. In one study, NIR spectra in combination with
regression analysis based on an oxidative stress index for group classification of AD patients, reported an 80%
sensitivity and 77% specificity to discriminate patients with this disease38. Similarly, NIR spectra in combination
with PCA and quadratic discriminant analysis (PCA–QDA) displayed 92.8% accuracy, 87.5% sensitivity and
96.1% specificity to classify blood plasma from patients at various stages of AD36. In a different study, Fourier
Scientific Reports | (2021) 11:1392 | https://doi.org/10.1038/s41598-021-81032-x 10
Vol:.(1234567890)www.nature.com/scientificreports/
transform infrared (FT-IR) spectra were discriminated with a sensitivity of 89% and specificity of 92% for the
presence of Alzheimer’s disease in blood p lasma37.
In ruminants, blood plasma has been evaluated using NIRS for early diagnosis of pregnancy in sheep, discern-
ing spectra from pregnant and non-pregnant females by partial least squares discriminant analysis (PLS-DA), and
using ELISA for pregnancy-associated glycoprotein (PAG), progesterone (P4), and abdominal ultrasonography at
45 days after artificial insemination (AI) as reference methods. At Day 18 after AI, the sensitivity and specificity of
NIRS and P 4 for pregnancy detection were 98.9% and 100%, respectively. Likewise, on Day 25, these parameters
were 100% for NIRS and PAG40. All these studies suggest that NIRS can be an accurate method of diagnosis with
similar sensitivities and specificities as the reference methods used to analyze blood plasma.
Conclusion
Clinical and hematological profiles for M. haemolytica infection were assessed using MVA, identifying the most
reliable indicators of BRD in cattle among the numerous data parameters usually collected when disease is sus-
pected. Based on these reference parameters and the associated biochemical changes occurring with the immune
response, NIR spectral profiles were established for blood plasma collected before and after M. haemolytica
infection. The NIR spectral profiles were used to develop a PCA–LDA model for discrimination of blood samples
that can identify cattle infected with M. haemolytica with an accuracy, sensitivity, and specificity of > 90% within
the model. Model prediction had an accuracy of 83.3 ± 7.5%, a sensitivity of 79.2 ± 21.3%, and a specificity of
87.5 ± 10.9% for NIR spectra of blood plasma collected from different animals than used in the model structure.
Our data indicate NIRS is a promising approach to rapid in-line diagnosis of BRD caused by M. haemolytica.
Data availability
Data is available upon request from Carrie K. Vance (ckv7@msstate.edu).
Received: 4 September 2020; Accepted: 23 December 2020
References
1. Snowder, G. D., Van Vleck, L. D., Cundiff, L. V. & Bennett, G. L. Bovine respiratory disease in feedlot cattle: environmental, genetic,
and economic factors. J. Anim. Sci. 84, 1999–2008 (2006).
2. Klima, C. L. et al. Pathogens of bovine respiratory disease in North American feedlots conferring multidrug resistance via integra-
tive conjugative elements. J. Clin. Microbiol. 52, 438–448 (2014).
3. Urban-Chmiel, R. & Grooms, D. Prevention and control of bovine respiratory disease. J. Livest. Sci. 3, 27–36 (2012).
4. Dubrovsky, S. A. et al. Preweaning cost of bovine respiratory disease (BRD) and cost-benefit of implementation of preventative
measures in calves on California dairies: the BRD 10K study. J. Dairy Sci. 103, 1583–1597 (2020).
5. Griffin, D., Chengappa, M. M., Kuszak, J. & McVey, D. S. Bacterial pathogens of the bovine respiratory disease complex. Vet. Clin.
N. Am. Food Anim. Pract. 26, 381–394 (2010).
6. Briggs, R. E., Tabatabai, L. B. & Tatum, F. M. Mucosal and parenteral vaccination against pneumonic pasteurellosis in cattle with
a modified-live in-frame lktA deletion mutant of Mannheimia haemolytica. Microb. Pathog. 52, 302–309 (2012).
7. Singh, K., Ritchey, J. W. & Confer, A. W. Mannheimia haemolytica: bacterial-host interactions in bovine Pneumonia. Vet. Pathol.
48, 338–348 (2011).
8. Wolfger, B., Timsit, E., White, B. J. & Orsel, K. A systematic review of bovine respiratory disease diagnosis focused on diagnostic
confirmation, early detection, and prediction of unfavorable outcomes in feedlot cattle. Vet. Clin. N. Am. Food Anim. Pract. 31,
351–365 (2015).
9. Kalina, W. V., Woolums, A. R. & Gershwin, L. J. Formalin-inactivated bovine RSV vaccine influences antibody levels in bronchoal-
veolar lavage fluid and disease outcome in experimentally infected calves. Vaccine 23, 4625–4630 (2005).
10. White, B. J. & Renter, D. G. Bayesian estimation of the performance of using clinical observations and harvest lung lesions for
diagnosing bovine respiratory disease in post-weaned beef calves. J. Vet. Diagn. Investig. 21, 446–453 (2009).
11. White, B. J. et al. Bayesian evaluation of clinical diagnostic test characteristics of visual observations and remote monitoring to
diagnose bovine respiratory disease in beef calves. Prev. Vet. Med. 126, 74–80 (2016).
12. Timsit, E., Dendukuri, N., Schiller, I. & Buczinski, S. Diagnostic accuracy of clinical illness for bovine respiratory disease (BRD)
diagnosis in beef cattle placed in feedlots: a systematic literature review and hierarchical Bayesian latent-class meta-analysis. Prev.
Vet. Med. 135, 67–73 (2016).
13. Ollivett, T. L. & Buczinski, S. On-farm use of ultrasonography for bovine respiratory disease. Vet. Clin. N. Am. Food Anim. Pract.
32, 19–35 (2016).
14. Ollivett, T. L. et al. Thoracic ultrasonography and bronchoalveolar lavage fluid analysis in holstein calves with subclinical lung
lesions. J. Vet. Intern. Med. 29, 1728–1734 (2015).
15. Berman, J., Francoz, D., Dufour, S. & Buczinski, S. Bayesian estimation of sensitivity and specificity of systematic thoracic ultra-
sound exam for diagnosis of bovine respiratory disease in pre-weaned calves. Prev. Vet. Med. 162, 38–45 (2019).
16. Shih, A. W. Y., Mcfarlane, A. & Verhovsek, M. Haptoglobin testing in hemolysis: Measurement and interpretation. Am. J. Hematol.
89, 443–447 (2014).
17. Abdallah, A., Hewson, J., Francoz, D., Selim, H. & Buczinski, S. Systematic review of the diagnostic accuracy of haptoglobin, serum
amyloid A, and fibrinogen versus clinical reference standards for the diagnosis of bovine respiratory disease. J. Vet. Intern. Med.
30, 1356–1368 (2016).
18. Eckersall, P. D. & Bell, R. Acute phase proteins: biomarkers of infection and inflammation in veterinary medicine. Vet. J. 185, 23–27
(2010).
19. Cornelissen, J. B. W. J. et al. Mycoplasma detection by triplex real-time PCR in bronchoalveolar lavage fluid from bovine respira-
tory disease complex cases. BMC Vet. Res. 13, 1–12 (2017).
20. Blakebrough-Hall, C., Dona, A., D’occhio, M. J., McMeniman, J. & González, L. A. Diagnosis of bovine respiratory disease in
feedlot cattle using blood 1H NMR metabolomics. Sci. Rep. 10, 1–12 (2020).
21. Spinhirne, J. P., Koziel, J. A. & Chirase, N. K. Sampling and analysis of volatile organic compounds in bovine breath by solid-phase
microextraction and gas chromatography-mass spectrometry. J. Chromatogr. A 1025, 63–69 (2004).
22. Maurer, D. L., Koziel, J. A., Engelken, T. J., Cooper, V. L. & Funk, J. L. Detection of volatile compounds emitted from nasal secre-
tions and serum: towards non-invasive identification of diseased cattle biomarkers. Separations 5, 18 (2018).
Scientific Reports | (2021) 11:1392 | https://doi.org/10.1038/s41598-021-81032-x 11
Vol.:(0123456789)www.nature.com/scientificreports/
23. Pasquini, C. Near infrared spectroscopy: fundamentals, practical aspects and analytical applications. J. Braz. Chem. Soc. 14, 198–219
(2003).
24. Foley, W. J. et al. Ecological applications of near infrared reflectance spectroscopy: a tool for rapid, cost-effective prediction of the
composition of plant and animal tissues and aspects of animal performance. Oecologia 116, 293–305 (1998).
25. Ozaki, Y., Huck, C., Ishigaki, M. & Ishikawa, D. Near-infrared spectroscopy in biological molecules and tissues. Encycl. Biophys.
https://doi.org/10.1007/978-3-642-35943-9 (2019).
26. Beć, K. B., Grabska, J. & Huck, C. W. Principles and applications of miniaturized near-infrared (NIR) spectrometers. Chem. Eur.
J. https://doi.org/10.1002/chem.202002838 (2020).
27. Grabska, J. & Huck, C. W. Near-infrared spectroscopy in bio-applications. Molecules 25, 2948 (2020).
28. Cozzolino, D. The sample, the spectra and the maths-the critical pillars in the development of robust and sound applications of
vibrational spectroscopy. Molecules 25, 3674 (2020).
29. Tsenkova, R. Introduction aquaphotomics: dynamic spectroscopy of aqueous and biological systems describes peculiarities of
water. J. Near Infrared Spectrosc. 17, 303–314 (2009).
30. Tsenkova, R., Munćan, J., Pollner, B. & Kovacs, Z. Essentials of aquaphotomics and its chemometrics approaches. Front. Chem. 6,
1–25 (2018).
31. Muncan, J. & Tsenkova, R. Aquaphotomics-from innovative knowledge to integrative platform in science and technology. Molecules
24, 2742 (2019).
32. Diaz-Olivares, J. A. et al. Online milk composition analysis with an on-farm near-infrared sensor. bioRxiv (2020). https://doi.
org/10.1101/2020.06.02.129742.
33. Tsenkova, R. Aquaphotomics: water absorbance pattern as a biological marker. NIR News 17, 13–23 (2006).
34. Sakudo, A. et al. A novel diagnostic method for human immunodeficiency virus type-1 in plasma by near-infrared spectroscopy.
Microbiol. Immunol. 49, 695–701 (2005).
35. Bahmani, M. K. et al. Spectroscopic characterization of human immunodeficiency virus type-1-infected plasma by principal com-
ponent analysis and soft independent modeling of class analogy of visible and near-infrared spectra. Mol. Med. Rep. 2, 805–809
(2009).
36. Paraskevaidi, M. et al. Blood-based near-infrared spectroscopy for the rapid low-cost detection of Alzheimer’s disease. Analyst
143, 5959–5964 (2018).
37. Carmona, P. et al. Discrimination analysis of blood plasma associated with Alzheimer’s disease using vibrational spectroscopy. J.
Alzheimer’s Dis. 34, 911–920 (2013).
38. Burns, D. H. et al. Near-infrared spectroscopy of blood plasma for diagnosis of sporadic alzheimer’s disease. J. Alzheimer’s Dis. 17,
391–397 (2009).
39. Lafrance, D., Lands, L. C., Hornby, L. & Burns, D. H. Near-infrared spectroscopic measurement of lactate in human plasma. Appl.
Spectrosc. 54, 300–304 (2000).
40. Andueza, D., Alabart, J. L., Lahoz, B., Muñoz, F. & Folch, J. Early pregnancy diagnosis in sheep using near-infrared spectroscopy
on blood plasma. Theriogenology 81, 509–513 (2014).
41. Knight-Jones, T. J. D., Edmond, K., Gubbins, S. & Paton, D. J. Veterinary and human vaccine evaluation methods. Proc. R. Soc. B
Biol. Sci. 281, 20132839 (2014).
42. Jollife, I. T. & Cadima, J. Principal component analysis: a review and recent developments. Philos. Trans. R. Soc. A Math. Phys. Eng.
Sci. 374, 2015202 (2016).
43. Piemonte, V., Basile, A., Ito, T. & Marrelli, L. Biomedical Engineering Challenges: A Chemical Engineering Insight 1–235 (Wiley,
Hoboken, 2018). https://doi.org/10.1002/9781119296034
44. Fearn, T., Pérez-Marín, D., Garrido-Varo, A. & Guerrero-Ginel, J. E. Classifying with confidence using Bayes rule and kernel
density estimation. Chemom. Intell. Lab. Syst. 189, 81–87 (2019).
45. Morais, C. L. M. & Lima, K. M. G. Principal component analysis with linear and quadratic discriminant analysis for identification
of cancer samples based on mass spectrometry. J. Braz. Chem. Soc. 29, 472–481 (2018).
46. Wong, H. B. & Lim, G. H. Measures of diagnostic accuracy: sensitivity, specificity, PPV and NPV. Proc. Singapore Healthc. 20,
316–318 (2011).
47. Lalkhen, A. G. & McCluskey, A. Clinical tests: sensitivity and specificity. Cont. Educ. Anaesth. Crit. Care Pain 8, 221–223 (2008).
48. Jones, M. L. & Allison, R. W. Evaluation of the Ruminant Complete Blood Cell Count. Vet. Clin. N. Am. Food Anim. Pract. 23,
377–402 (2007).
49. Duarte, R. T., Carvalho Simões, M. C. & Sgarbieri, V. C. Bovine blood components: Fractionation, composition, and nutritive
value. J. Agric. Food Chem. 47, 231–236 (1999).
50. Mathew, J. & Varacallo, M. Physiology Blood Plasma 26–31 (StatPearls Publication, Treasure Island, 2019).
51. Robertson, W. H., Diken, E. G., Price, E. A., Shin, J. W. & Johnson, M. A. Spectroscopic determination of the OH− solvation shell
in the O H−·(H2O)n clusters. Science (80-) 299, 1367–1372 (2003).
52. Stomp, M., Huisman, J., Stal, L. J. & Matthijs, H. C. P. Colorful niches of phototrophic microorganisms shaped by vibrations of the
water molecule. ISME J. 1, 271–282 (2007).
53. Theurer, M. E. et al. Effect of Mannheimia haemolytica pneumonia on behavior and physiologic responses of calves during high
ambient environmental temperatures. J. Anim. Sci. 91, 3917–3929 (2013).
54. Burciaga-Robles, L. O. et al. Effects of exposure to calves persistently infected with bovine viral diarrhea virus type 1b and sub-
sequent infection with mannheima haemolytica on clinical signs and immune variables: model for bovinerespiratory disease via
viral and bacterial interactio. J. Anim. Sci. 88, 2166–2178 (2010).
55. Gleeson, L. E. & Sheedy, F. J. Metabolic reprogramming & inflammation: Fuelling the host response to pathogens. Semin. Immunol.
28, 450–468 (2016).
56. Kominsky, D. J., Campbell, E. L. & Colgan, S. P. Metabolic shifts in immunity and inflammation. J. Immunol. 184, 4062–4068
(2010).
57. Kreimeier, U. Pathophysiology of fluid imbalance. Crit. Care 4, 1–5 (2000).
Acknowledgements
The authors would like to thank the Biochemistry undergraduate students Amanda Free, Hannah Bostick and
Matt Harjes, and the graduate student Matt Scott, DVM, for their help during the sample collection and prepa-
ration. This project was supported by a Special Research Initiative granted by the Mississippi Agricultural and
Forestry Experiment Station, and the USDA-ARS 58-6402-018 Biophotonics Initiative, Grant # G00003581.
Funding sources had no role in the study design, data collection, analysis and interpretation of the data, writing
of the report or submission for publication.
Author contributions
C.K.V., A.W., and F.M were in charge of the research conceptualization, funding acquisition, supervision, and
project administration. A.W. and M.T. designed the methodology for the controlled challenge. A.W., M.T., E.B.,
Scientific Reports | (2021) 11:1392 | https://doi.org/10.1038/s41598-021-81032-x 12
Vol:.(1234567890)You can also read