PROFITING FROM PROPHET - Oliver Wyman
←
→
Page content transcription
If your browser does not render page correctly, please read the page content below
Consulting Actuaries

Volume 5 | Spring 2021

PROFITING
FROM PROPHET
OVERCOMING SPEED BUMPS                                    IN THIS ISSUE
Editor's words: Welcome to the Spring 2021 edition of     Executive Corner
our Prophet modeling newsletter. Modern regulatory        Optimizing Prophet: Balancing
                                                          Model Accuracy, Speed,
and internal reporting requirements place ever-
                                                          And Cost
growing demands on actuarial models. This edition
outlines tools to improve Prophet model runtime           In the Spotlight
and efficiency. You will find useful tips and tricks on   Liability In-Force Compression
Prophet diagnostics and queries along with a feature      In Prophet

on exciting developments in the US360 EMOs.               Tips & Tricks
We hope you enjoy the newsletter.
                                                          What's New in Prophet
                                                          2021 US 360
                                                          EMO Reorganization
Profiting From Prophet

Executive corner

OPTIMIZING PROPHET:
BALANCING MODEL ACCURACY, SPEED,
AND COST
Recent accounting and regulatory regime changes have resulted in increasingly complex reserving
requirements, often involving calculation-intensive stochastic projections. This has pressured companies to find
ways to balance actuarial model accuracy, speed, and cost.

This article outlines four considerations for improving Prophet model runtime and efficiency, viewed across the
dimensions of accuracy, speed, and cost.

Consideration                                  Purpose

Model scalability testing                      Identify the most efficient model setup and runtime environment to
                                               maximize model speed

Infrastructure planning                        Optimize a self-hosted Prophet environment or Prophet Managed Cloud
                                               Service ("PMCS") structure to ensure timely results while managing costs

Model streamlining                             Identify model design components that can increase speed without
                                               sacrificing model accuracy

Ongoing system improvements                    Identify the optimal cadence for inclusion and implementation of Prophet
                                               system improvements

MODEL SCALABILITY TESTING
Purpose: Identify the most efficient model setup and runtime environment to maximize
model speed

Model scalability testing helps identify the most           multiple processors. However, users will experience
efficient model setup and grid core usage. Optimizing       diminishing returns as the number of cores increases;
runtime allows actuaries and management to                  that is, the effort required for the system to distribute
spend more time analyzing and understanding                 data and consolidate results can eventually outweigh
results.Prophet runtime is typically scalable up to         the marginal gain of adding an additional core.
a point; products, scenarios, run numbers, and
even model point batches can be distributed across

© Oliver Wyman                                                                                                            2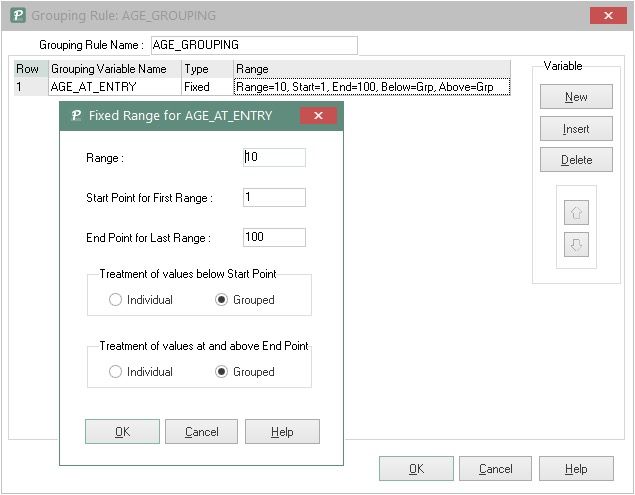
Profiting From Prophet

The exhibit below provides a hypothetical example           model scalability testing is complete, an infrastructure
of a range of core and runtime pairings. Model speed        plan can be developed to optimize grid capacity and
is optimized at the lowest point on the curve. Once         avoid bottlenecks.

Exhibit 1: Run Scalability Testing
 Higher Runtime
Runtime (Hours)

                                                       Maximum cores
                                                       leverage point

                                                                                          Higher Cores
                                     Number Of Cores

Source: Oliver Wyman analysis

INFRASTRUCTURE PLANNING
Purpose: Optimize a self-hosted Prophet environment or Prophet Managed Cloud Service
structure to ensure timely results while managing costs

Optimizing Prophet structure and capacity is as             These services can be scheduled in advance during
important as optimizing model setup to manage               capacity planning or utilized dynamically via PMCS
runtime and costs; otherwise, there exists potential        elastic computing options. Multiple options are
for grid bottleneck and interruptions. Prophet allows       available in PMCS, allowing users to customize to their
the use of cloud services when additional temporary         cost, access, and speed needs. Below are certain key
grid capacity is needed.                                    considerations in designing a grid infrastructure.

© Oliver Wyman                                                                                                     3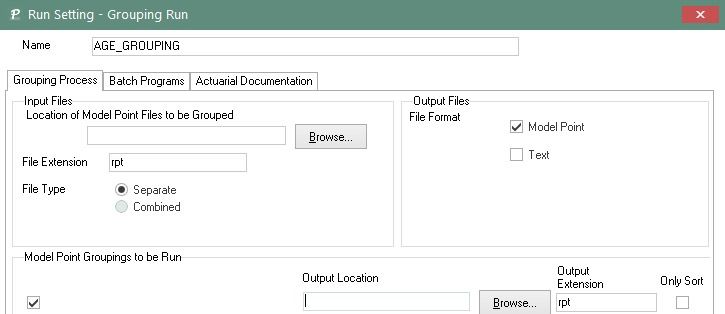
Profiting From Prophet

Consideration                                      Impact

Machine groups and priority options                Minimize delays in the production of model results due to low priority
Assign processing priority across business units   runs consuming grid capacity

Number of concurrent grid users                    Prevent bottlenecks due to insufficient grid capacity to meet the
Determine the maximum required capacity            requirements of different user groups
based on frequency of simultaneous model runs

Number of jobs and aggregate total runtime         Avoid cost of maintaining excess grid capacity during off-peak times
at peak-time                                       while ensuring sufficient capacity during peak-times
Determining grid capacity requirements during
peak versus off-peak times

Expected workspace, assumptions, and model         Balance speed of results retrieval with storage costs
output storage requirements
Determine whether results will be stored locally
or in a cloud environment
Allocation of computer resources required by       Reduce computing costs by only using PMCS when required
Prophet Enterprise (PE) Domain, Push to PE
Domains, and Prophet Professional users
Identify processes that can be performed in
local environments

In addition to the above considerations, companies should identify whether technical specifications of their
infrastructure satisfy cost and performance requirements. The specifications of compute and supporting
servers collectively contribute to performance of the Prophet ecosystem.

MODEL STREAMLINING
Purpose: Identify model design components that can increase speed without sacrificing
model accuracy

Prophet offers solutions to reduce runtime without              • Calibration and testing are required to
requiring model changes, including in-force                         identify the optimal balance of accuracy and
                                                                    speed improvements.
compression, variable targeting, and dynamic
period specification.                                           • Variable targeting allows the user to specify a
                                                                    subset of variables for calculation within a model
• In-force compression performed through the                        structure. Prophet will calculate only those
    Prophet Data Conversion System (DCS) allows                     variables in the subset, increasing model speed
    model points to be grouped together according                   without impacting accuracy.
    to similar features. These features can be selected
    by the user to balance compression ratios with
    accuracy of key results/metrics.
• Dynamic period specification allows for the
    specification of the frequency at which Prophet will
    dynamically recalculate model outputs. Frequency
    options range from annual to monthly.

© Oliver Wyman                                                                                                              4
Profiting From Prophet
Optimizing models with respect to structure and run settings will ensure that Prophet is not performing
unnecessary computing tasks. E.g., compiling Prophet code when not required, logging diagnostic details that
are not being used, etc.
ONGOING SYSTEM IMPROVEMENTS
Purpose: Identify the optimal cadence for inclusion and implementation of Prophet
system improvements
There are frequent Prophet functionality and user acceptance testing, and execute governance
architecture improvements that may affect accuracy, controls should be weighed when evaluating a system
speed, or cost. While it is expected that these improvement. Additionally, improvements to model
improvements will be generally beneficial, the impact accuracy may lead to more complex or more frequent
on model speed and implementation costs of any calculations, potentially increasing runtime. The
potential updates should be considered.The resources tradeoff between accuracy and speed should always
required to implement model updates, perform be considered before implementing improvements.
LIABILITY IN-FORCE
COMPRESSION IN PROPHET
A smart way to accelerate model runs
Liability in-force compression can shorten model k-means and hierarchical agglomerative clustering.
runtime by reducing the number of model points. In Section 2 outlines how to implement model point file
this article, we will dive into advanced compression compression in Prophet software, specifically DCS
approaches, specifically clustering algorithms, and Prophet Professional ("PP"). Section 3 illustrates
and outline how compression can be implemented runtime savings achieved in a Prophet model under
effectively in Prophet. different levels of policy data compression. Definitions
of certain technical terms are provided; these terms
Section 1 provides an overview of cluster analysis are bolded the first time they are used.
and describes two common clustering algorithms:
© Oliver Wyman 5Profiting From Prophet
SECTION 1: CLUSTER ANALYSIS
Compression is a type of cluster analysis that groups data points into clusters based on sets of similar
characteristics. Clusters can be defined as groups of data points with short distances among members or as
dense areas in the data space. While clustering algorithms differ in the methodology used to combine data
points, all share common properties:
• Clustering is accomplished by setting specific • The chosen clustering algorithm then iteratively
characteristics of data points as location variables groups data points to optimize a defined
objective function
Exhibit 2: Plot Of Data Points Based On Two Location Variables
Location Variable 2
Location Variable 1
Source: Oliver Wyman analysis
© Oliver Wyman 6Profiting From Prophet
Clustering Algorithms
Two of the most common clustering algorithms are k-means and hierarchical agglomerative clustering,
which are illustrated below in Exhibits 3 and 4.
Exhibit 3: K-Means Clustering Algorithm
Step 1 Randomly select k data points as centroids, where k represents the
desired number of clusters
Step 2 Assign every data point to its nearest centroid
Step 3 Redetermine the centroid of each cluster based on available data
points in the cluster
Step 4 Repeat steps 2 and 3 until clusters reach their target state, which is
when additional iterations have no impact on the cluster selection
Source: Oliver Wyman analysis
A k-means clustering algorithm is simple to define and illustrate. It partitions the data into a well-distributed set
of clusters when k is relatively small. However, this technique can be sensitive to outliers and the random initial
assignment of the k data points.
Exhibit 4: Agglomerative Hierarchical Clustering Algorithm
Step 1 Treat every data point as an individual cluster. Calculate the distance between
each cluster
Step 2 Merge the closest pair of clusters
Step 3 Repeat step 2 until the target clustering level is reached
Step 4 The result is a set of clusters meeting the target clustering level
© Oliver Wyman 7Profiting From Prophet
Definitions
Centroid: The arithmetic mean position of a given Distortion: Alteration of the original characteristics of the data. In
set of data points Prophet, it is the difference in measure variable between the full
seriatim and grouped model points. As a clustering algorithm is
applied, distortion is inherently introduced into the data model
Children: Member policies of a cluster that are not Grouping factor: A factor used to scale the measure of the parent to
the parent be equal to the sum of the measures of the children when running a
compressed data model
Cluster analysis: Data analysis technique that Location variables: Location variables reflect policy characteristics or
groups data points into clusters risk drivers of the underlying policies in the clustering algorithm
Compression: Type of cluster analysis technique Measure: A metric an actuary attempts to control, or preserve, between
that compresses large sets of data points into the full seriatim and compressed data models (e.g., total reserves)
more compact sets
Compression ratio: Number of data points (e.g. Parent: The representative policy of the cluster. Location variables of
in-force model points) after compression relative this policy are used to represent the cluster as a whole
to the original number of data points (e.g., in-force
seriatim records)
Distance: The Euclidian distance between two Weight: Importance assigned to each location variable used to
data points in terms of their location variables determine the measure metric
Key Considerations
Careful consideration is required when choosing For an extreme example, consider the loss of
location variables. The performance of a Prophet accuracy when attempting to group all in-force
model utilizing compressed data depends on how well insurance policies into a single model point. Thus,
location variables represent the underlying policies. the compression process should involve a tuning
For example, for a valuation model, one should phase specific to the intended application. This
choose location variables that drive reserve levels. phase involves selecting location variables and
If policies are not well represented by the location their respective weights based on trial runs and
variables, the degree of distortion can be significant may require several iterations to achieve adequate
even with minimal compression. calibration. However, once a satisfactory compression
model is established, significant efficiency can be
Furthermore, once a compression process continues achieved without material loss of fidelity in results.
beyond compression ratios supported by the
underlying data and attempts to cluster policies that
differ more significantly, the level of distortion will
increase. This is called “over-clustering”.
© Oliver Wyman 8Profiting From Prophet
SECTION 2: PERFORMING COMPRESSION IN
DCS/PROPHET PROFESSIONAL
Model point file (“MPF”) compression can be performed using either DCS or Prophet Professional. Exhibit 5
outlines key steps involved in compressing in-force data.
Exhibit 5: Compressing In-Force Data In DCS/Prophet Professional
Step 1 Step 2
Set up compression rules and parameters Execute compression
Seriatim DCS/PP DCS/PP Grouped
data Grouping Grouping MPF
set-up run
Step 3
Compare model results
Source: Oliver Wyman analysis
STEP 1: SET UP COMPRESSION RULES AND PARAMETERS
DCS
DCS has standard functionality to create grouped MPFs, which can be appended to an existing seriatim MPF
creation DCS program or designed as a standalone DCS program. Relevant DCS user interface sections are
outlined below.
Exhibit 6: DCS Grouping Sections
Seriatim DCS DCS Grouped
data Grouping Grouping MPF
set-up run
Run Settings Code Editor Output Format Grouping
Source: Oliver Wyman analysis
© Oliver Wyman 9Profiting From Prophet
Run Settings Exhibit 7: Age Grouping Code
The Run Settings tab contains a switch to enable
grouping. Optionality exists, such as defining a
minimum number of policies in each grouped
model point.
Code Editor
The Code Editor allows flexibility in creating and
modifying variables for grouping. DCS provides
flexibility to support clustering algorithms,
such as those detailed in Section 1, and other
grouping approaches.
Output Format
Grouping variables are selected by
checking the “Sort/Group” checkbox.
For a simple grouping example, whereby AGE_
AT_ENTRY is grouped into 10-year age bands, the
Source: Oliver Wyman analysis
following snippet of code can be used:
The new variable AGE_GRP would be included in the MPF as a grouping variable and used temporarily; after
executing the grouping, AGE_GRP and similar variables can be removed via DCS.
Exhibit 8: DCS Output Format
Source: Oliver Wyman analysis
Grouping
The Grouping tab is used to specify grouping calculation type, weighting variables, and decimals for each
output variable. For each variable, DCS uses one of three calculation types when grouping:
• Average • Sumlog (sums the exponential of each value and
• Sum then takes the natural log of the sum)
Up to two weighting variables can be specified. The following example calculates AGE_AT_ENTRY
using an average weighted on the variable TOTAL_ACCVAL.
© Oliver Wyman 10Profiting From Prophet
Exhibit 9: DCS Grouping Calculations
Source: Oliver Wyman analysis
Prophet Professional
Prophet Professional also has grouping functionality, as defined via three main components.
Exhibit 10: Prophet Professional Grouping Sections
Seriatim PP PP
Grouping Grouping Grouped
data MPF
set-up run
Grouping Grouping Grouping
Rules Calculations Run Settings
Source: Oliver Wyman analysis
Grouping Rules
Grouping rules are set at a library level and can be • For “fixed type”, the size of each range, starting
applied to each product within that library, with up to point, and ending point can be specified, along
five pairs of grouping rules and grouping calculations with treatment of values outside of the range
specified for each product. • For “variable type”, the modeler can specify
specific end points for each range
Grouping rules specify variables by which to group
policy data, limited to integer-type variables. “Type” A Prophet Professional example of a grouping rule
can be “fixed” or “variable”, which determines how using “fixed type” to group AGE_AT_ENTRY in 10-year
grouping ranges are set: bands is shown in below
© Oliver Wyman 11Profiting From Prophet
Exhibit 11: Age Grouping Rule
Source: Oliver Wyman analysis
Grouping Calculations
Grouping calculations govern rules to be applied to five calculation types for non-text variables, as
each output variable. Prophet Professional allows for summarized in Exhibit 12.
Exhibit 12: Prophet Professional Calculation Types
Calculation type Description Example
Average Average value in the grouped model AGE_AT_ENTRY averaged over model points
point. Up to two variables can be
selected to apply weighting
Count Number of model points in the grouped NO_POLS_IF set to count of model points
model point
Fixed Fixed value is specified SPCODE set to fixed value of 1
Range Fixed value assigned to each range AGE_AT_ENTRY set to midpoint of each 10-year age band
Must be a grouping variable
Sum Sum of values in the grouped model TOT_VOLUME summed over model points
point. Up to two variables can be
selected to apply weighting
Source: Oliver Wyman analysis
© Oliver Wyman 12Profiting From Prophet Exhibit 13: Age Grouping Calculation Source: Oliver Wyman analysis Grouping Run Settings A Grouping Run Setting must be created to Setting include the location and formatting of execute grouping rules and calculations for a the input MPFs, desired output file format and product. Grouping Run Settings are executed as location, and which model point groupings are to an independent run from typical Calculation Run be run, as shown below. Settings. Parameters set in the Grouping Run Exhibit 14: Grouping Run Setting Source: Oliver Wyman analysis © Oliver Wyman 13
Profiting From Prophet

Comparing DCS to Prophet Professional
Exhibit 15 outlines key differences between compression in DCS and Prophet Professional:

Exhibit 15: Grouping Comparison

Component                    DCS                                       Prophet Professional
Compression support        Simple grouping or clustering             Simple grouping
                           algorithms developed in Code Editor.
                           Custom code provides much greater
                           compression flexibility and support for
                           clustering algorithms
Group/Output               None                                      Unable to group on non-integer variables and
variable limitations                                                 cannot output text variables in grouped MPFs
Calculation type           3 types:                                  5 types:
                           • Average                                 • Average
                           • Sum                                     • Sum
                           • Sumlog                                  • Count
                                                                     • Fixed
                                                                     • Range
Variable flexibility       Code Editor allows new variables          Limited to existing variables
                           specific to grouping

Product flexibility        Applies the same calculation type for     Can set separate grouping calculations for
                           each variable within the DCS program      each product

Seriatim MPF               Can create grouped MPF from in-force      Requires seriatim MPF to apply grouping
                           data source without first creating the
                           seriatim MPF

STEP 2: EXECUTE COMPRESSION

  DCS
To perform DCS compression, the program must first be compiled and then the executable can be run.

  Prophet Professional
To execute the compression program, run the desired Group Run Setting with a Structure containing the
products to be grouped. Only the product list is used from the Structure. The Group Run Setting needs to be
executed before a Calculation Run Setting can use the grouped MPFs.

© Oliver Wyman                                                                                                      14
Profiting From Prophet
STEP 3: COMPARE MODEL RESULTS
The compressed model should be evaluated by comparing model outputs between compressed and seriatim
model runs. Experimentation and iteration may be necessary to determine optimal grouping variables, rules,
and weights.
COMPRESSION IN NESTED RUNS
With the introduction of nested runs and associated from the outer structure to the inner structure
computational requirements, runtime optimization is through model point maps. The compression
critical. Prophet Professional supports compression functionality executes a DCS script before model
functionality allowing a DCS script to create grouped points are passed to the inner structure.
MPFs for use in inner loop runs (i.e., inner loop model
points are allowed to differ from outer loop model The compression functionality is found within a Model
points). During a nested run, model points are passed Point Map, as shown below.
Exhibit 16: Model Point Map
Source: Oliver Wyman analysis
The Group Inner Model Points checkbox shows a list of DCS scripts available to use in the Model Point Map.
Nested run compression functionality is supported in Prophet Enterprise, Push to PE, and Prophet Professional.
Some restrictions to keep in mind when using grouping within nested runs include:
• The DCS script must be compiled before the nested • Binary MPFs are used instead of standard MPFs, in
run is executed order to optimize runtime
• DCS scripts not created from within Prophet • The full range of DCS functionality is restricted,
Professional cannot be used for nested e.g., reading external tables
run compression
© Oliver Wyman 15Profiting From Prophet
SECTION 3: ILLUSTRATIVE MODEL RESULTS
Compression was performed on an illustrative joint annuity product in Prophet using DCS to group on a
range of variables. Exhibits 17 and 18 show resultant output metrics and model runtimes under a range of
compression ratios.
Four simple groupings were applied cumulatively to create grouped MPFs:
1. Primary age: weighted average in 5-year bands 3. Entry month: weighted average in 3-month bands
2. Secondary age: weighted average in 5-year bands 4. All ages and entry months: weighted average with
no bands
Runtime gains track closely to the in-force compression ratio, with any deviation largely attributable to the asset
portion of the ALM run.
Exhibit 17: Runtime vs. Compression
Runtime Compression
(Minutes) Ratio
100%
20
80%
15
60%
10
40%
5
20%
0 0%
Baseline Run 1 Run 2 Run 3 Run 4
Grouping Run
Runtime Compression Ratio
Source: Oliver Wyman analysis
The simple banded groupings (runs 1-3) provide valuable compression while maintaining fidelity of results.
Run 4 (no banding) exhibits significant loss of fidelity.
© Oliver Wyman 16Profiting From Prophet
Exhibit 18: Distortion Of Grouping Runs
PV Accum Deficit % Difference In PV
($MM) Accum Deficit
60 20.0%
50 16.0%
40 12.0%
30 8.0%
20 4.0%
10 0.0%
0 -4.0%
Baseline Run 1 Run 2 Run 3 Run 4
Grouping Run
Source: Oliver Wyman analysis
Conclusion
The in-force data grouping functionality available in DCS/Prophet Professional provides insurers a practical
solution to reducing model runtime. Intelligent grouping and custom clustering algorithms implemented in DCS
can realize even greater gains than out-of-the-box functionality. For computationally intensive tasks such as
stochastic modeling and forecasting, the efficiency achieved by developing a robust compression process could
outweigh the loss in model fidelity and upfront development costs.
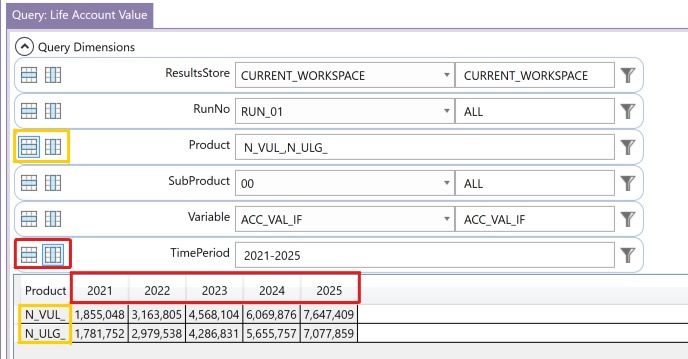
© Oliver Wyman 17Profiting From Prophet Tips & Tricks QUERIES Prophet queries are a powerful tool to analyze results can be queried across multiple run numbers and of one or more Prophet runs. Queries can be created products to quantify the impact of different sensitivity and saved to efficiently produce multi-dimensional runs. Furthermore, results can be plotted on a graph views of results for recurring analyses. Queries and exported into reports. Queries can be viewed provide the ability to create automated reports for and created within Prophet’s Results window, as a variety of use cases. For example, profit metrics shown below. Query creation Queries are comprised of two components — the first five years of a projection run. Cell widths dimensions and parameters — both of which are and alignment, fonts, number formats, and other defined within the query header. In the example formatting options can be set within the ‘Properties’ below, ACC_VAL_IF, N_VUL_/N_ULG_, and 2021-2025 dialog box. To access these properties, click are all parameters that define the query to summarize Properties within the Home tab of the query results year-end account values for two products during viewer window. © Oliver Wyman 18
Profiting From Prophet

Charting queries
Charting queries can be useful to provide quick           life blocks during the first five years of a projection
visualizations across runs, products, variables, or       run.Chart types that are currently supported within
other dimensions. For example, the chart below shows      Prophet queries include line, column, and point charts.
year-end account values for two different universal

Exhibit 19: Life Account Value

     Account Value

8,000,000                                                                     Product

                                                                                  N_ULG_
                                                                                  N_VUL_
6,000,000

4,000,000

2,000,000

        0                                                                    Time Period
                         2021    2022        2023         2024        2025

Source: Oliver Wyman analysis

Types of queries
Various types of queries support different Prophet use    policyholder characteristics while stochastic summary
cases. For example, valuation queries can be executed     queries can be used to summarize results across
to summarize valuation results across different           simulations within a stochastic projection.

Query considerations
Model developers should consider creating query           within stochastic projections, a stochastic query could
templates for model users to easily analyze and view      be used to drill down into these results and provide
results. For example, if there are specific simulations   meaningful insights.
of interest

© Oliver Wyman                                                                                                      19
Profiting From Prophet Tips & Tricks DIAGNOSTIC FILES Diagnostic files provide a modeler with information files provide details on variable calculation order, to enhance model performance and write cleaner time references, dynamic types, and loop statuses. code. Prophet can produce two types of diagnostics Generated during the run phase, runtime diagnostic files: codegen and runtime diagnostics. Generated files provide information on variable contributions during the run preparation phase, codegen diagnostic to runtime. Generating diagnostic files Diagnostic file generation controls are specified in module link. When the runtime diagnostics option is the Advanced— Optimisations section of the Run selected, additional information on run performance Structure Configuration tab. Enabling the codegen is appended to the codegen diagnostic files. diagnostics option creates a file for each product and © Oliver Wyman 20
Profiting From Prophet

Using diagnostic files
Diagnostic files are useful debugging tools for                           Prophet model improvement, generating runtime
products and modules that error during a run or                           diagnostics increases runtimes itself; thus, it is
generate unexpected results. Additionally, diagnostics                    generally considered best practice to only generate
provide a modeler with variable calculation order,                        runtime diagnostics for purposes of model debugging
time references, number of calls, and other                               and optimization. Diagnostic files can be found on
helpful information to better understand variable                         the Results pane of the Prophet Professional Explorer
relationships. While diagnostics provide variable-level                   and within the run’s results folder within Windows
runtime statistics and insights into opportunities for                    explorer (e.g., results/Run#).

Interpreting diagnostic files
Key fields within the diagnostic files are:                               with multiple looping methods that iteratively
                                                                          calculate a set of variables, with variations between
• Group and AscOrDesc— Identifies the group
                                                                          each iteration. For example, Prophet can iteratively
    of variables and time direction (ascending =
                                                                          solve for premium rates that result in a pre-defined
    prospectively, descending = retrospectively) that
    variables are calculated                                              profit margin. CalcLoop, Rebase, and GoalSeek
                                                                          each identify where a variable is being used in the
• TReferences and T-Offset— TReferences indicate
                                                                          associated looping functionality (either ‘Pre’, ‘In’, or
    how time, t, is used in references of that variable,
                                                                          ‘Post’ loop)
    and T-Offset indicates the offset used within
    these references                                                      • Calls, Runtime, Runtime%— Added when runtime
• CalcFrom and CalcTo— Indicates the range of time                            diagnostics are generated; provide the number
    periods for which the variable is calculated                              of times the variable is executed, the runtime
                                                                              in milliseconds, and the percentage of overall
• CalcLoop, Rebase, GoalSeek— Prophet is equipped
                                                                              time used

Note, enhancements to diagnostic files are set to be released with Prophet Professional 2021Q2

© Oliver Wyman                                                                                                                       21
Profiting From Prophet
What's New in Prophet
2021 US 360 EMO REORGANIZATION
Since the February 2021 US 360 library update, the example model office (“EMO”) has been separated into
multiple workspaces to demonstrate different contexts:
• STAT EMO— similar to the previous PBR EMO our Spring 2019 newsletter edition: WELCOME TO
without the inclusion of the GAAP Cohort 360 OUR PROPHET NEWSLETTER!
library. The traditional EMO includes US 360, • GAAP LDTI Disclosure EMO— includes US 360
ALS, and other supporting libraries with example and US GAAP Cohort Disclosures 360 libraries.
products for plain-vanilla insurance products The workspace also contains sample run pairs
• GAAP LDTI EMO— includes US 360 and the GAAP to support LDTI rollforward calculations and
Cohort libraries and base products for whole life, disclosure requirements along with the LDTI
immediate annuity, universal life, and variable life toolkit to illustrate an end-to-end LDTI modeling
products. LDTI rollforward ‘history’ and ‘cohort’ environment. Additional detail on this toolkit
products are also included for all four sample can be found in the Spring 2020 version of this
products. For additional information on the newsletter: MODEL HOUSEKEEPING
structure of GAAP LDTI modeling in Prophet, see
US GAAP COHORT DISCLOSURES 360 LIBRARY
FIS has released a new library to support LDTI necessary disclosures. Each rollforward step leverages
disclosure reporting. This library supports liabilities the US L&A 360 library for liability projections and
for future policy benefits (“LFPB”), deferred acquisition the US GAAP Cohort Disclosures 360 library for
cost (“DAC”), and deferred profit liability (“DPL”) as LDTI calculations.
well as commonly associated disclosures. Additional
liabilities and market risk benefits (“MRB”) are also An additional run step reads results from the prior
supported and can be toggled on or off. The library is runs to generate balances, cash flows, and metrics
available to users licensed for both the US 360 library that are needed for LDTI reporting. A separate
and the Prophet Insurance Data Repository (“IDR”). disclosure product with the new indicator US_GAAP_
TARG_IMP_DISCL is used to aggregate these values.
The disclosure EMO contains separate runs for each
step in the LDTI rollforward process to produce the
© Oliver Wyman 22Profiting From Prophet
For ease of disclosure customization, flags The EMO also supports variable-level
in the model point file are included to allow customization through the addition of
high-level disclosure categories (LFPB, DAC, disclosure configuration tables. These
and DPL) to be toggled “on” or “off” for tables— one each for DAC, LFPB, and DPL—
certain products or reporting cohorts. allow the user to select the variable that
fulfils each disclosure requirement.
Supplementing the disclosure library are two new Excel templates that can be accessed via
the Prophet Excel add-in ribbon.
• US GAAP LDTI Disclosure Reports— • US GAAP LDTI Disclosure Accounting
templates used to read disclosure results Entries— used to organize LDTI
and generate disclosure exhibits results such that they can be fed into a
downstream ledger system
© Oliver Wyman 23About Oliver Wyman Oliver Wyman is a global leader in management consulting. With offices in 60 cities across 29 countries, Oliver Wyman combines deep industry knowledge with specialized expertise in strategy, operations, risk management, and organization transformation. The firm has more than 5,000 professionals around the world who work with clients to optimize their business, improve their operations and risk profile, and accelerate their organizational performance to seize the most attractive opportunities. Oliver Wyman is a business of Marsh McLennan[NYSE: MMC]. The Actuarial Practice of Oliver Wyman has life, health, and property & casualty actuaries that advise financial institutions, insurance companies, regulators, and self-insured entities across a broad spectrum of risk management issues. With almost 400 professionals in over 20 offices across North America, the Caribbean and Europe, the firm’s consulting actuaries provide independent, objective advice, combining a wide range of expertise with specialized knowledge of specific risks. Fidelity National Information Services, Inc., shall have no liability in respect of the views and opinions expressed in this report. For more information, please contact: Dean Kerr, FSA, ACIA, MAAA Matthew Zhang FSA, MAAA, CERA Partner Senior Consultant Dean.Kerr@oliverwyman.com Matthew.Zhang@oliverwyman.com Justin Meade, FSA, MAAA Craig Maly FSA, MAAA, CERA Principal Consultant Justin.Meade@oliverwyman.com Craig.Maly@oliverwyman.com Copyright ©2021 Oliver Wyman All rights reserved. This report may not be reproduced or redistributed, in whole or in part, without the written permission of Oliver Wyman and Oliver Wyman accepts no liability whatsoever for the actions of third parties in this respect. The information and opinions in this report were prepared by Oliver Wyman. This report is not investment advice and should not be relied on for such advice or as a substitute for consultation with professional accountants, tax, legal or financial advisors. Oliver Wyman has made every effort to use reliable, up-to-date and comprehensive information and analysis, but all information is provided without warranty of any kind, express or implied. Oliver Wyman disclaims any responsibility to update the information or conclusions in this report. Oliver Wyman accepts no liability for any loss arising from any action taken or refrained from as a result of information contained in this report or any reports or sources of information referred to herein, or for any consequential, special or similar damages even if advised of the possibility of such damages. The report is not an offer to buy or sell securities or a solicitation of an offer to buy or sell securities. This report may not be sold without the written consent of Oliver Wyman. Oliver Wyman – A business of Marsh McLennan www.oliverwyman.com
You can also read